Safety Benefits of Speed Cameras - C-MARC: Curtin Monash ...
Safety Benefits of Speed Cameras - C-MARC: Curtin Monash ...
Safety Benefits of Speed Cameras - C-MARC: Curtin Monash ...

Create successful ePaper yourself
Turn your PDF publications into a flip-book with our unique Google optimized e-Paper software.
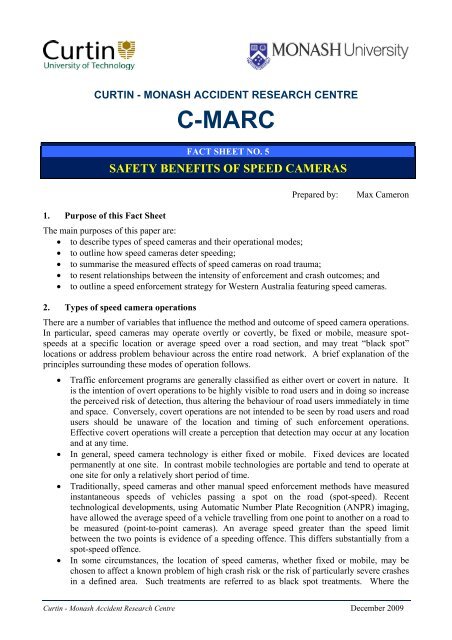
CURTIN - MONASH ACCIDENT RESEARCH CENTRE<br />
C-<strong>MARC</strong><br />
FACT SHEET NO. 5<br />
SAFETY BENEFITS OF SPEED CAMERAS<br />
Prepared by:<br />
Max Cameron<br />
1. Purpose <strong>of</strong> this Fact Sheet<br />
The main purposes <strong>of</strong> this paper are:<br />
to describe types <strong>of</strong> speed cameras and their operational modes;<br />
to outline how speed cameras deter speeding;<br />
to summarise the measured effects <strong>of</strong> speed cameras on road trauma;<br />
to resent relationships between the intensity <strong>of</strong> enforcement and crash outcomes; and<br />
to outline a speed enforcement strategy for Western Australia featuring speed cameras.<br />
2. Types <strong>of</strong> speed camera operations<br />
There are a number <strong>of</strong> variables that influence the method and outcome <strong>of</strong> speed camera operations.<br />
In particular, speed cameras may operate overtly or covertly, be fixed or mobile, measure spotspeeds<br />
at a specific location or average speed over a road section, and may treat “black spot”<br />
locations or address problem behaviour across the entire road network. A brief explanation <strong>of</strong> the<br />
principles surrounding these modes <strong>of</strong> operation follows.<br />
Traffic enforcement programs are generally classified as either overt or covert in nature. It<br />
is the intention <strong>of</strong> overt operations to be highly visible to road users and in doing so increase<br />
the perceived risk <strong>of</strong> detection, thus altering the behaviour <strong>of</strong> road users immediately in time<br />
and space. Conversely, covert operations are not intended to be seen by road users and road<br />
users should be unaware <strong>of</strong> the location and timing <strong>of</strong> such enforcement operations.<br />
Effective covert operations will create a perception that detection may occur at any location<br />
and at any time.<br />
In general, speed camera technology is either fixed or mobile. Fixed devices are located<br />
permanently at one site. In contrast mobile technologies are portable and tend to operate at<br />
one site for only a relatively short period <strong>of</strong> time.<br />
Traditionally, speed cameras and other manual speed enforcement methods have measured<br />
instantaneous speeds <strong>of</strong> vehicles passing a spot on the road (spot-speed). Recent<br />
technological developments, using Automatic Number Plate Recognition (ANPR) imaging,<br />
have allowed the average speed <strong>of</strong> a vehicle travelling from one point to another on a road to<br />
be measured (point-to-point cameras). An average speed greater than the speed limit<br />
between the two points is evidence <strong>of</strong> a speeding <strong>of</strong>fence. This differs substantially from a<br />
spot-speed <strong>of</strong>fence.<br />
In some circumstances, the location <strong>of</strong> speed cameras, whether fixed or mobile, may be<br />
chosen to affect a known problem <strong>of</strong> high crash risk or the risk <strong>of</strong> particularly severe crashes<br />
in a defined area. Such treatments are referred to as black spot treatments. Where the<br />
<strong>Curtin</strong> - <strong>Monash</strong> Accident Research Centre December 2009
Fact Sheet No. 5<br />
<strong>Safety</strong> <strong>Benefits</strong> <strong>of</strong> <strong>Speed</strong> <strong>Cameras</strong><br />
increased risk relates to a particular route or area, the treatment can be spread across this<br />
black route or area. In general, black spot or black route operations are intended to have the<br />
greatest effect at the black spot site or along the black route. In contrast, other forms <strong>of</strong><br />
speed camera operations aim to influence speeding across major parts <strong>of</strong> the road network,<br />
using techniques outlined below.<br />
Decisions regarding overt or covert, mobile or fixed, spot-speed or average speed, and black spot or<br />
network-wide operations may be dependent on a number <strong>of</strong> factors and this is reflected in the<br />
variety <strong>of</strong> enforcement programs operating in different jurisdictions. Some common factors that<br />
likely influence the nature and extent <strong>of</strong> speed camera operations are the level <strong>of</strong> resources available<br />
(e.g. equipment, staff, and <strong>of</strong>fence processing capacity), the road type to be enforced, the prevalence<br />
<strong>of</strong> speeding behaviour prior to enforcement, and public attitudes towards the use <strong>of</strong> automated or<br />
semi-automated speed enforcement technologies.<br />
3. How speed cameras deter speeding<br />
The two primary mechanisms through which speed camera enforcement may effect positive<br />
behaviour change are general deterrence and specific deterrence. The key reasoning behind these<br />
processes relies on utility theory as described by Ross (1981). Road users will decide whether or<br />
not to commit a traffic <strong>of</strong>fence based on a rational analysis <strong>of</strong> the benefits and risks associated with<br />
committing the <strong>of</strong>fence. Note that it is the perceived risks and benefits <strong>of</strong> committing the <strong>of</strong>fence<br />
that determines the utility <strong>of</strong> the action. The perceptions <strong>of</strong> the certainty, swiftness and severity <strong>of</strong><br />
punishment (in that order <strong>of</strong> importance) are generally accepted as the key elements <strong>of</strong> deterrence<br />
theory applied to traffic law enforcement and adjudication (Nichols & Ross, 1990).<br />
General deterrence is a process <strong>of</strong> influencing a potential traffic law <strong>of</strong>fender, through his fear <strong>of</strong><br />
detection and the consequences, to avoid <strong>of</strong>fending (Cameron & Sanderson, 1982). Therefore,<br />
operations employing general deterrence mechanisms necessarily target all road users irrespective<br />
<strong>of</strong> whether they have previously <strong>of</strong>fended. It follows that general deterrence programs have the<br />
potential to influence the behaviour <strong>of</strong> all road users. Homel (1988) has established this as the key<br />
mechanism in the deterrence <strong>of</strong> drink-driving using random breath testing.<br />
In contrast, specific deterrence is a process <strong>of</strong> encouraging an apprehended <strong>of</strong>fender, through his<br />
actual experience <strong>of</strong> detection and the consequences, to avoid re-<strong>of</strong>fending (Cameron & Sanderson,<br />
1982). Therefore, the potential impact <strong>of</strong> a specific deterrence program may be more limited than<br />
that <strong>of</strong> programs relying on the general deterrence mechanism, unless the program is operated<br />
intensely. Enforcement programs relying solely on the mechanism <strong>of</strong> specific deterrence have the<br />
potential to immediately influence only those <strong>of</strong>fenders who have previously been detected and<br />
punished for committing <strong>of</strong>fences. (Other, potential <strong>of</strong>fenders may be influenced by word-<strong>of</strong>-mouth<br />
communication with apprehended <strong>of</strong>fenders.) It follows that the magnitude <strong>of</strong> the penalty,<br />
especially that applying if subsequent <strong>of</strong>fences are committed, is <strong>of</strong> greater importance to specific<br />
deterrence programs than those relying on the general deterrence mechanism.<br />
A general effect on speeding by a speed camera program, in contrast with a local effect, can be<br />
achieved through the mechanism <strong>of</strong> general deterrence or specific deterrence. General effects across<br />
a road network need not be produced only through general deterrence.<br />
The threat inherent in a speed camera program influences its acceptability to the community and to<br />
the decision-makers. Some decision-makers perceive that the threat from some forms <strong>of</strong> speed<br />
camera enforcement would be too high and unacceptable. This attitude has resulted in some<br />
jurisdictions being reluctant to specifically deter speeders on a large scale and instead aiming to<br />
generally deter speeders only at identified problem locations.<br />
<strong>Curtin</strong> - <strong>Monash</strong> Accident Research Centre Page 2
Fact Sheet No. 5<br />
<strong>Safety</strong> <strong>Benefits</strong> <strong>of</strong> <strong>Speed</strong> <strong>Cameras</strong><br />
4. Effects <strong>of</strong> speed cameras on road trauma<br />
A large number <strong>of</strong> scientific evaluations <strong>of</strong> the effects on road trauma by speed cameras in various<br />
Australian States, New Zealand and Europe (particularly Great Britain) have been conducted and<br />
are summarised in Cameron and Delaney (2006). The effects vary by the mode <strong>of</strong> camera<br />
operations and indicate reductions in crashes at various levels <strong>of</strong> injury severity, depending on the<br />
study criteria used. Some modes <strong>of</strong> camera operations apparently achieve only local effects, some<br />
also weaker general effects, and some achieve strong general effects across the road system in<br />
which they operate. The covert operations generally achieve effects on the severity <strong>of</strong> casualty<br />
crashes, especially fatal and more serious crashes, as well as effects on crashes generally (Table 1).<br />
Table 1. Measured effects <strong>of</strong> speed cameras on crashes and crash injury severity (percentage<br />
reductions in road trauma shown as negative values), Australasia and Great Britain.<br />
Type <strong>of</strong> speed<br />
camera site<br />
and operation:<br />
Effects<br />
On crashes:<br />
Jurisdictions<br />
operating<br />
automatic<br />
cameras in<br />
this way<br />
Fatal crashes<br />
Serious<br />
casualty<br />
crashes<br />
Serious<br />
casualty<br />
crashes<br />
Casualty<br />
crashes<br />
Casualty<br />
crashes<br />
Casualties<br />
per casualty<br />
crash<br />
Serious<br />
casualties per<br />
crash<br />
Fixed<br />
installations,<br />
conspicuous<br />
signage<br />
Great Britain<br />
New Zealand<br />
N.S.W.<br />
Local effect<br />
[NSW]:<br />
-90%<br />
Local effect<br />
[GB]:<br />
- 53%<br />
Local effect<br />
[NSW]:<br />
-23%<br />
Local effect<br />
[GB]:<br />
-26%<br />
Overt Camera Operations<br />
Mobile<br />
operations at<br />
known fixed<br />
sites, or<br />
signed<br />
sites/zones<br />
Great Britain<br />
New Zealand<br />
Western<br />
Australia<br />
Local effect<br />
[GB]:<br />
-28%<br />
Local effect<br />
[NZ]:<br />
- 23%<br />
General effect:<br />
- 13%<br />
Randomly<br />
scheduled<br />
mobile<br />
operations at<br />
fixed sites<br />
Queensland<br />
(3000 hours<br />
per month,<br />
2002)<br />
Doubling <strong>of</strong><br />
camera hours<br />
(2003) -<br />
Additional<br />
general effect:<br />
- 9%<br />
Local effect:<br />
- 35%.<br />
General effect:<br />
- 26%<br />
Covert<br />
mobile<br />
operations at<br />
signed sites or<br />
zones<br />
New Zealand<br />
(hidden<br />
camera trial,<br />
1997-2000)<br />
Additional<br />
general effect:<br />
- 11%<br />
Additional<br />
general effect:<br />
- 9%<br />
Covert Camera Operations<br />
Covert<br />
mobile<br />
operations<br />
at unsigned<br />
sites<br />
Victoria to<br />
2000/2001<br />
(4000 hours<br />
per month)<br />
General<br />
effect:<br />
-21%<br />
(- 32% in<br />
Melbourne)<br />
General<br />
effect:<br />
- 21%<br />
Covert<br />
mobile<br />
“flashless”<br />
cameras at<br />
unsigned<br />
sites; lower<br />
enforcement<br />
tolerance<br />
Victoria from<br />
2001/2002<br />
(50%<br />
increase in<br />
hours)<br />
Additional<br />
general effect:<br />
- 3.25% *<br />
<strong>Curtin</strong> - <strong>Monash</strong> Accident Research Centre Page 3
Fact Sheet No. 5<br />
<strong>Safety</strong> <strong>Benefits</strong> <strong>of</strong> <strong>Speed</strong> <strong>Cameras</strong><br />
Fatalities<br />
per crash<br />
(Melbourne)<br />
Additional<br />
general effect:<br />
- 51% *<br />
Material<br />
Local effect:<br />
damage<br />
- 20%.<br />
crashes<br />
General effect:<br />
≈ - 10%<br />
* Added general effect <strong>of</strong> covert mobile operations in Victoria was principally due to the increased hours in 2001/02<br />
Point-to-point camera systems measuring average speeds over road sections have not been included<br />
in the above table because <strong>of</strong> limited experience with them and very few evaluation studies. A<br />
system <strong>of</strong> 15 linked cameras on a 46 km section <strong>of</strong> highway in Strathclyde, Scotland was associated<br />
with a 29% reduction in serious casualty crashes and a 16% reduction in slight injury crashes during<br />
the first three years (A77 <strong>Safety</strong> Group, 2008). The point-to-point camera system covering speeds<br />
through a heavily-trafficked urban tunnel in Austria was associated with 33% reduction in injury<br />
crashes (including fatal), 49% reduction in fatal and serious injuries, and 32% reduction in slight<br />
injuries. These average speed cameras have a general effect across the whole <strong>of</strong> the road<br />
environment that they cover, in contrast with the limited local effect <strong>of</strong> fixed spot-speed cameras.<br />
5. Relationships between enforcement intensity and crash outcomes<br />
As well as the mode <strong>of</strong> operation, the effect <strong>of</strong> speed cameras is related to the intensity <strong>of</strong> operation<br />
in the road environment covered, and hence to drivers’ perceptions <strong>of</strong> the risk <strong>of</strong> detection when<br />
speeding. The intensity is measured by dimensions such as the number <strong>of</strong> fixed cameras, the<br />
monthly operating hours <strong>of</strong> mobile cameras, or the number <strong>of</strong> speeding tickets issued following<br />
detection <strong>of</strong> speeding <strong>of</strong>fences by the different types <strong>of</strong> camera technology.<br />
On the basis <strong>of</strong> a review <strong>of</strong> a large number <strong>of</strong> studies, Elvik (2001) derived a general relationship<br />
between speed enforcement intensity and casualty crash reductions. It was concluded that, even for<br />
the most effective forms <strong>of</strong> enforcement, diminishing returns apply as the level <strong>of</strong> enforcement<br />
increases. However, within the range <strong>of</strong> increases observed in the studies (up to 10-12 fold), it<br />
appears that at least some crash reductions occur for each increase in enforcement effort. Effects<br />
beyond that level are uncertain.<br />
Covert mobile speed cameras<br />
Evaluations <strong>of</strong> the covert mobile speed camera program operating in Victoria provide the data from<br />
which the relationship between enforcement levels using this technology and crash outcomes was<br />
derived (Cameron, Newstead, Diamantopoulou & Oxley, 2003a,b). During 1999, Victoria Police<br />
varied the levels <strong>of</strong> speed camera activity substantially in four Melbourne Police districts according<br />
to a systematic plan. Analysis <strong>of</strong> the associated changes in casualty crash frequency revealed that<br />
crash frequency was inversely associated with changes in the levels <strong>of</strong> speeding TINs (Traffic<br />
Infringement Notices) issued following detection in the same district during the previous month. A<br />
similar relationship was found for the risk <strong>of</strong> fatal outcome in a casualty crash. The relationships<br />
are displayed in Figures 1 and 2 together with 95% confidence limits on the estimates.<br />
<strong>Curtin</strong> - <strong>Monash</strong> Accident Research Centre Page 4
Fact Sheet No. 5<br />
<strong>Safety</strong> <strong>Benefits</strong> <strong>of</strong> <strong>Speed</strong> <strong>Cameras</strong><br />
1.2<br />
3<br />
1.15<br />
2.5<br />
y = 1.0774x -0.1372<br />
y = 1.5644x -0.9838<br />
Relative risk <strong>of</strong> casualty crash<br />
1.1<br />
1.05<br />
1<br />
R 2 = 0.8792<br />
y = 1.012x -0.1115<br />
R 2 = 0.9037<br />
y = 0.9535x -0.0863<br />
Relative risk <strong>of</strong> fatal outcome<br />
2<br />
1.5<br />
1<br />
R 2 = 0.8448<br />
y = 0.9649x -0.8516<br />
R 2 = 0.851<br />
y = 0.5855x -0.7312<br />
0.95<br />
R 2 = 0.9129<br />
0.5<br />
R 2 = 0.7925<br />
0.9<br />
0.0 0.2 0.4 0.6 0.8 1.0 1.2 1.4 1.6 1.8<br />
Relative level <strong>of</strong> speeding TINs detected in Police District during previous month<br />
0<br />
0.0 0.2 0.4 0.6 0.8 1.0 1.2 1.4 1.6 1.8<br />
Relative level <strong>of</strong> speeding tickets detected in Police District during previous month<br />
Figure 1. Relative relationship between casualty<br />
crash risk and level <strong>of</strong> speeding TINs detected by<br />
covert mobile speed cameras<br />
Figure 2. Relative relationship between the risk<br />
<strong>of</strong> fatal outcome in casualty crashes and the<br />
level <strong>of</strong> speeding TINs<br />
Figure 1 shows the relative relationship between casualty crash risk and the level <strong>of</strong> speeding TINs<br />
issued in the prior month, relative to the average level <strong>of</strong> TINs issued, which was about 3,000 TINs<br />
per month from speeding <strong>of</strong>fences detected in each Police District during 1999. Figure 2 shows the<br />
relationship between the risk <strong>of</strong> fatal outcome <strong>of</strong> the casualty crashes and the level <strong>of</strong> speeding TINs<br />
issued, again expressed in relative terms. As you can see, as TINs issued increase, the relative risk<br />
in both figures decreases.<br />
Overt mobile speed cameras with randomised scheduling<br />
Studies have been conducted on the crash reduction effects <strong>of</strong> the Queensland program as it has<br />
grown from 852 hours per month in 1997 to about 6,000 hours per month during 2003-2006<br />
(Newstead and Cameron, 2003; Newstead, 2004, 2005, 2006). The crash reductions have generally<br />
been limited to an area within two kilometres <strong>of</strong> the camera sites. The strongest effects have been<br />
on casualty crashes, with no differential effect on crashes <strong>of</strong> different severity (fatal, hospital<br />
admission, or medical treatment crashes). As the program grew, the two kilometre areas around<br />
camera sites covered a greater proportion <strong>of</strong> the total casualty crashes in Queensland, rising from<br />
about 50% to 83% over the evaluation period. Thus the localised crash reductions around camera<br />
sites can be interpreted as a general effect on crashes, even if assuming that the program has no<br />
effect beyond the two kilometre areas (a conservative assumption). The relationship between the<br />
increased monthly hours and the general casualty crash reductions can be seen in Figure 3.<br />
5<br />
20<br />
General effect (crash reduction %)<br />
0<br />
0<br />
-5<br />
1,000 2,000 3,000 4,000 5,000 6,000 7,000<br />
-10<br />
-15<br />
-20<br />
-25<br />
y = -16.363Ln(x) + 103.43<br />
R 2 = 0.9547<br />
-30<br />
-35<br />
-40<br />
General effect (crash reduction %)<br />
10<br />
0<br />
0 1,000 2,000 3,000 4,000 5,000 6,000 7,000<br />
-10<br />
y = -18.783Ln(x) + 129.7<br />
-20<br />
R 2 = 0.649<br />
-30<br />
-40<br />
-45<br />
-50<br />
Camera hours per month<br />
Camera hours per month<br />
Figure 3. Relationship between casualty crash<br />
reductions and monthly hours <strong>of</strong> overt mobile<br />
speed cameras with randomised scheduling<br />
Figure 4. Relationship between fatal crash<br />
reductions and monthly hours <strong>of</strong> overt mobile<br />
speed cameras with randomised scheduling<br />
<strong>Curtin</strong> - <strong>Monash</strong> Accident Research Centre Page 5
Fact Sheet No. 5<br />
<strong>Safety</strong> <strong>Benefits</strong> <strong>of</strong> <strong>Speed</strong> <strong>Cameras</strong><br />
Figure 4 shows the estimated reductions in fatal crashes associated with the level <strong>of</strong> monthly hours<br />
operated each year. It should be noted that the individual annual estimated reductions are not as<br />
reliable as the reductions in all casualty crashes shown in Figure 3 and that no individual reduction<br />
is statistically significant. Nevertheless, the estimates do suggest a relationship between fatal crash<br />
reductions and camera hours <strong>of</strong> the same type as that in Figure 3. However, there is no evidence that<br />
the magnitude <strong>of</strong> the reduction achieved by the Queensland program on fatal crashes is any greater<br />
than that achieved on casualty crashes in general.<br />
6. A strategy for speed enforcement in Western Australia<br />
The information in Table 1 and illustrated in Figures 1-4 was used to define a package <strong>of</strong> speed<br />
enforcement options suited to the Western Australian road environment which together would<br />
produce at least 25% reduction in fatal crashes, somewhat smaller reductions in less-serious<br />
crashes, and would have maximum benefits from savings in crash costs compared with the<br />
investment (Table 2). As well as speed camera systems <strong>of</strong> appropriate type, the options considered<br />
included hand-held laser speed detectors and moving-mode mobile radar units, both <strong>of</strong> which<br />
require manual interceptions <strong>of</strong> detected speeding <strong>of</strong>fenders. These interception methods were<br />
considered because <strong>of</strong> doubts about the cost-effectiveness <strong>of</strong> speed cameras operated on Western<br />
Australia’s lightly-trafficked rural local roads and urban residential streets.<br />
Table 2.<br />
Recommended speed enforcement programs<br />
<strong>Speed</strong> Enforcement Program<br />
<strong>Speed</strong><br />
Enforceme<br />
nt Hours<br />
per month<br />
<strong>Speed</strong>ing<br />
Tickets<br />
Issued per<br />
month<br />
(short-term)<br />
Crash savings per month<br />
Fatal<br />
crashes<br />
Hospital<br />
admission<br />
crashes<br />
Medical<br />
treatment<br />
crashes<br />
Benefit<br />
Cost<br />
Ratio<br />
URBAN ROADS (Perth)<br />
Covert mobile speed cameras on urban<br />
highways 9,000 90,000 1.11 3.0 10.7 6.1<br />
Laser speed detectors at black spot<br />
sites on urban local roads 1,025 3,410 0.11 2.4 5.2 29.8<br />
Overt fixed spot-speed cameras on<br />
Perth freeways<br />
Intermittent<br />
at 24 sites 10,000 0.04 0.7 1.2 9.3<br />
Total for urban roads 103,410 1.3 6.1 17.0 8.1<br />
RURAL ROADS (Rest <strong>of</strong> WA)<br />
Overt mobile speed cameras randomly<br />
scheduled on rural highways 3,000 10,000 1.13 6.4 6.5 37.4<br />
Mobile radar units on rural local roads<br />
15,000 11,250 0.62 4.9 6.2 6.3<br />
Total for rural roads 21,250 1.7 11.4 12.7 11.8<br />
Total program for all WA roads 124,660 3.0 17.5 29.7 10.1<br />
Percentage reduction in WA crashes 26.0% 12.3% 9.0%<br />
<strong>Curtin</strong> - <strong>Monash</strong> Accident Research Centre Page 6
Fact Sheet No. 5<br />
<strong>Safety</strong> <strong>Benefits</strong> <strong>of</strong> <strong>Speed</strong> <strong>Cameras</strong><br />
Alternatives to the operation <strong>of</strong> covert mobile cameras on Perth’s urban highways were also<br />
considered in the analysis (Cameron and Delaney, 2006; Cameron, 2008). The options <strong>of</strong> operating<br />
the mobile cameras overtly (with randomised scheduling), or a mixture <strong>of</strong> overt and covert<br />
operations, were found to have similar crash reduction benefits but not as strong an effect on fatal<br />
crashes as covert operations (Cameron, 2008).<br />
Another alternative considered was the installation <strong>of</strong> point-to-point speed cameras on Perth<br />
freeways, instead <strong>of</strong> fixed spot-speed cameras, and also on links on the urban and rural highway<br />
system suitable for their application. The analysis found that point-to-point cameras were<br />
potentially more effective and would have greater economic justification than the speed camera<br />
options in Table 2 for some parts <strong>of</strong> the Western Australian road system (e.g. Perth freeways).<br />
7. Summary and conclusions<br />
<strong>Speed</strong> cameras can be operated overtly or covertly, at fixed locations or mobile, measure spotspeeds<br />
or average speed on a road section, and can be directed at black spot locations or aim to<br />
reduce speeding network-wide. All forms <strong>of</strong> operation have been shown to reduce casualty crashes,<br />
at least locally around operating sites, but some operational forms have general effects across<br />
substantial parts <strong>of</strong> the road network that they cover. The operations producing general effects raise<br />
the perceived risk <strong>of</strong> detection when speeding anywhere within broad areas. These operations are<br />
characterised by intensive covert operation or randomised scheduling <strong>of</strong> overt mobile speed<br />
cameras. Point-to-point speed cameras measuring average speed along a road section <strong>of</strong>fer the<br />
potential for a strong general effect over at least the road environments that they cover.<br />
The acceptability <strong>of</strong> different forms <strong>of</strong> speed camera operation in a jurisdiction is related to the<br />
effectiveness and efficiency <strong>of</strong> the threat <strong>of</strong> being detected when speeding by each operational type.<br />
The decision to implement a speed camera system is a socio-political one reflecting the value<br />
society places on reducing road trauma, belief in the evidence that the camera system will achieve<br />
this, acceptance that the threat <strong>of</strong> detection when speeding is reasonable, and being prepared to<br />
forgo some <strong>of</strong> the perceived benefits <strong>of</strong> speeding.<br />
A package <strong>of</strong> speed enforcement programs has been defined for the Western Australian road<br />
environment that recognised its relatively unique characteristics <strong>of</strong> vast size and light traffic density,<br />
except in Perth. A suitable speed enforcement method has been defined for each part <strong>of</strong> the Western<br />
Australia road system and the road trauma reductions and economic benefits calculated if operated<br />
at each level. The speed enforcement package, if fully implemented, is estimated to produce 26%<br />
reduction in fatal crashes, 12% reduction crashes resulting in hospital admission, and 9% reduction<br />
in medically-treated injury crashes. These effects correspond to a reduction <strong>of</strong> 36 fatal, 210 hospital<br />
admission and 357 medically-treated injury crashes per annum. This represents a saving <strong>of</strong> at least<br />
$186 million in social costs per annum, with a benefit-cost ratio <strong>of</strong> at least 10 to 1.<br />
Alternatives to the speed camera options included in the package exist, such as operating the mobile<br />
speed cameras in Perth overtly (with randomised scheduling), or mixed overt and covert, instead <strong>of</strong><br />
solely covert mobile operations, but the effect on fatal crashes would not be as great. The inclusion<br />
<strong>of</strong> point-to-point speed cameras in the package, replacing the fixed cameras on Perth freeways and<br />
other camera options on parts <strong>of</strong> urban and rural highways, where economically warranted, could<br />
make the package more cost-beneficial and effective.<br />
<strong>Curtin</strong> - <strong>Monash</strong> Accident Research Centre Page 7
Fact Sheet No. 5<br />
<strong>Safety</strong> <strong>Benefits</strong> <strong>of</strong> <strong>Speed</strong> <strong>Cameras</strong><br />
8. References<br />
1<br />
A77 <strong>Safety</strong> Group (2007). Casualties halved on A77 – SPECS: End <strong>of</strong> 2 nd year casualty statistics.<br />
News Release, 26 October 2007. Strathclyde, Scotland.<br />
2<br />
Cameron, M.H. (2008). Development <strong>of</strong> strategies for best practice in speed enforcement in<br />
Western Australia: Supplementary Report. Report to Department <strong>of</strong> the Premier and Cabinet, Office<br />
<strong>of</strong> Road <strong>Safety</strong>, Western Australia, May 2008. Report No. 277, <strong>Monash</strong> University Accident<br />
Research Centre, Australia. http://www.monash.edu.au/muarc/reports/muarc277.pdf<br />
3<br />
Cameron, M.H. and Delaney, A. (2006). Development <strong>of</strong> strategies for best practice in speed<br />
enforcement in Western Australia: Final Report. Report to Department <strong>of</strong> the Premier and Cabinet,<br />
Office <strong>of</strong> Road <strong>Safety</strong>, Western Australia, September 2006. Report No. 270, <strong>Monash</strong> University<br />
Accident Research Centre, Australia.<br />
http://www.monash.edu.au/muarc/reports/muarc270.pdf<br />
4 Cameron, M.H., Newstead, S.V., Diamantopoulou, K., and Oxley, P. (2003a). The interaction<br />
between speed camera enforcement and speed-related mass media publicity in Victoria. Report No.<br />
201, <strong>Monash</strong> University Accident Research Centre, Australia.<br />
http://www.monash.edu.au/muarc/reports/muarc201.pdf<br />
5<br />
Cameron, M.H., Newstead, S.V., Diamantopoulou, K., and Oxley, P. (2003b). The interaction<br />
between speed camera enforcement and speed-related mass media publicity in Victoria, Australia.<br />
Proceedings, 47 th Annual Scientific Conference, Association for the Advancement <strong>of</strong> Automotive<br />
Medicine, Lisbon, Portugal.<br />
6<br />
Cameron, M.H. and Sanderson J.T. (1982). Review <strong>of</strong> Police operations for traffic law<br />
enforcement. Report No. TS 82/5, Traffic and <strong>Safety</strong> Department, Royal Automobile Club <strong>of</strong><br />
Victoria, Melbourne, Australia.<br />
7<br />
Elvik, R (2001). Cost-benefit analysis <strong>of</strong> Police enforcement. Working paper 1, ESCAPE<br />
(Enhanced <strong>Safety</strong> Coming from Appropriate Police Enforcement) Project, European Union.<br />
8<br />
Gains, A., Nordstrom, M., Heydecker, B. and Shrewsbury, J. (2005). The national safety camera<br />
programme: four year evaluation report. London: PA Consulting Group and University College<br />
London.<br />
9<br />
Homel, R. (1988). Policing and punishing the drinking driver: A study <strong>of</strong> general and specific<br />
deterrence. (Research in Criminology). New York, Springer-Verlag.<br />
10<br />
Keall, M.D., Povey, L.J. and Frith, W.J. (2001). The relative effectiveness <strong>of</strong> a hidden versus a<br />
visible speed camera programme. Accident Analysis and Prevention, Vol. 33, 277-284.<br />
11<br />
Keall, M.D., Povey, L.J. and Frith, W.J. (2002). Further results from a trial comparing a hidden<br />
speed camera programme with visible camera operation. Accident Analysis and Prevention, Vol. 34,<br />
773-777.<br />
12<br />
Newstead, S. (2004). Evaluation <strong>of</strong> the crash effects <strong>of</strong> the Queensland speed camera program in<br />
the years 2001-2003. Consultancy Report prepared for Queensland Transport, Australia.<br />
<strong>Curtin</strong> - <strong>Monash</strong> Accident Research Centre Page 8
Fact Sheet No. 5<br />
<strong>Safety</strong> <strong>Benefits</strong> <strong>of</strong> <strong>Speed</strong> <strong>Cameras</strong><br />
13 Newstead, S. (2005). Evaluation <strong>of</strong> the crash effects <strong>of</strong> the Queensland speed camera program in<br />
the years 2003-2004. Consultancy Report prepared for Queensland Transport, Australia.<br />
14 Newstead, S. (2006). Evaluation <strong>of</strong> the crash effects <strong>of</strong> the Queensland speed camera program in<br />
the year 2005. Consultancy Report prepared for Queensland Transport, Australia.<br />
15 Newstead, S. and Cameron, M. (2003). Evaluation <strong>of</strong> the crash effects <strong>of</strong> the Queensland <strong>Speed</strong><br />
Camera Program, Report No. 204, <strong>Monash</strong> University Accident Research Centre, Australia.<br />
16 Nichols J.L. and Ross H.L. (1990). The Effectiveness <strong>of</strong> Legal Sanctions in Dealing with<br />
Drinking Drivers. Alcohol, Drugs and Driving, Vol. 6, No. 2, 33-60.<br />
17 Ross, H.L. (1981). Deterrence <strong>of</strong> the drinking driver: an international survey. U.S. Department <strong>of</strong><br />
Transportation, Report No DOT-HS-805-820, Washington DC, USA.<br />
18 Stefan, C. (2006). Section control – Automatic speed enforcement in the Kaisermühlen Tunnel<br />
(Vienna, A22 Motorway). Austrian Road <strong>Safety</strong> Board, Vienna, Austria.<br />
Acknowledgement<br />
This fact sheet has been produced with funding from the Road <strong>Safety</strong> Council in the interest <strong>of</strong><br />
saving lives on our roads.<br />
C-<strong>MARC</strong><br />
<strong>Curtin</strong> - <strong>Monash</strong> Accident Research Centre<br />
School <strong>of</strong> Public Health, Faculty <strong>of</strong> Health Sciences, <strong>Curtin</strong> University <strong>of</strong> Technology<br />
GPO Box U1987, PERTH 6845, Western Australia<br />
Ph: (08) 9266 2304<br />
See www.c-marc.curtin.edu.au for more information<br />
<strong>Curtin</strong> - <strong>Monash</strong> Accident Research Centre Page 9