
You also want an ePaper? Increase the reach of your titles
YUMPU automatically turns print PDFs into web optimized ePapers that Google loves.
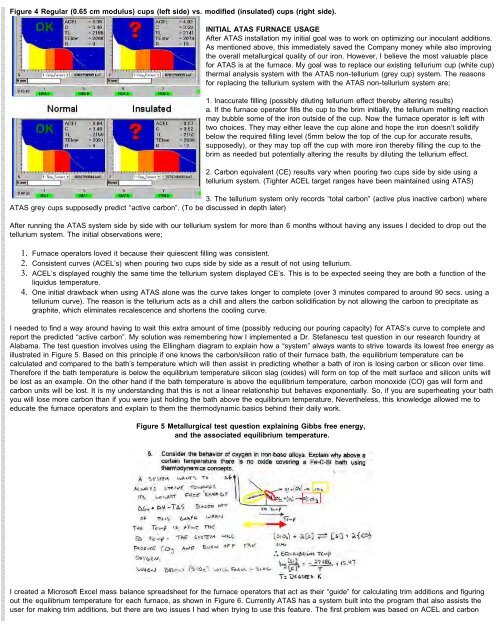
Figure 4 Regular (0.65 cm modulus) cups (left side) vs. modified (insulated) cups (right side).<br />
INITIAL ATAS FURNACE USAGE<br />
After ATAS installation my initial goal was to work on optimizing our inoculant additions.<br />
As mentioned above, this immediately saved the Company money while also improving<br />
the overall metallurgical quality of our iron. However, I believe the most valuable place<br />
for ATAS is at the furnace. My goal was to replace our existing tellurium cup (white cup)<br />
thermal analysis system with the ATAS non-tellurium (grey cup) system. The reasons<br />
for replacing the tellurium system with the ATAS non-tellurium system are;<br />
1. Inaccurate filling (possibly diluting tellurium effect thereby altering results)<br />
a. If the furnace operator fills the cup to the brim initially, the tellurium melting reaction<br />
may bubble some of the iron outside of the cup. Now the furnace operator is left with<br />
two choices. They may either leave the cup alone and hope the iron doesn’t solidify<br />
below the required filling level (5mm below the top of the cup for accurate results,<br />
supposedly), or they may top off the cup with more iron thereby filling the cup to the<br />
brim as needed but potentially altering the results by diluting the tellurium effect.<br />
2. Carbon equivalent (CE) results vary when pouring two cups side by side using a<br />
tellurium system. (Tighter ACEL target ranges have been maintained using ATAS)<br />
3. The tellurium system only records “total carbon” (active plus inactive carbon) where<br />
ATAS grey cups supposedly predict “active carbon”. (To be discussed in depth later)<br />
After running the ATAS system side by side with our tellurium system for more than 6 months without having any issues I decided to drop out the<br />
tellurium system. The initial observations were;<br />
1. Furnace operators loved it because their quiescent filling was consistent.<br />
2. Consistent curves (ACEL’s) when pouring two cups side by side as a result of not using tellurium.<br />
3. ACEL’s displayed roughly the same time the tellurium system displayed CE’s. This is to be expected seeing they are both a function of the<br />
liquidus temperature.<br />
4. One initial drawback when using ATAS alone was the curve takes longer to complete (over 3 minutes compared to around 90 secs. using a<br />
tellurium curve). The reason is the tellurium acts as a chill and alters the carbon solidification by not allowing the carbon to precipitate as<br />
graphite, which eliminates recalescence and shortens the cooling curve.<br />
I needed to find a way around having to wait this extra amount of time (possibly reducing our pouring capacity) for ATAS’s curve to complete and<br />
report the predicted “active carbon”. My solution was remembering how I implemented a Dr. Stefanescu test question in our research foundry at<br />
Alabama. The test question involves using the Ellingham diagram to explain how a “system” always wants to strive towards its lowest free energy as<br />
illustrated in Figure 5. Based on this principle if one knows the carbon/silicon ratio of their furnace bath, the equilibrium temperature can be<br />
calculated and compared to the bath’s temperature which will then assist in predicting whether a bath of iron is losing carbon or silicon over time.<br />
Therefore if the bath temperature is below the equilibrium temperature silicon slag (oxides) will form on top of the melt surface and silicon units will<br />
be lost as an example. On the other hand if the bath temperature is above the equilibrium temperature, carbon monoxide (CO) gas will form and<br />
carbon units will be lost. It is my understanding that this is not a linear relationship but behaves exponentially. So, if you are superheating your bath<br />
you will lose more carbon than if you were just holding the bath above the equilibrium temperature. Nevertheless, this knowledge allowed me to<br />
educate the furnace operators and explain to them the thermodynamic basics behind their daily work.<br />
Figure 5 Metallurgical test question explaining Gibbs free energy,<br />
and the associated equilibrium temperature.<br />
I created a Microsoft Excel mass balance spreadsheet for the furnace operators that act as their “guide” for calculating trim additions and figuring<br />
out the equilibrium temperature for each furnace, as shown in Figure 6. Currently ATAS has a system built into the program that also assists the<br />
user for making trim additions, but there are two issues I had when trying to use this feature. The first problem was based on ACEL and carbon