- Page 1: Family Court of Australia | Annual
- Page 4 and 5: Family Court of Australia Annual Re
- Page 6 and 7: iv Family Court of Australia Annual
- Page 8 and 9: Output Group 1.1 Resolution 34 Cons
- Page 12 and 13: An electronic version of this annua
- Page 14 and 15: JRC LIH MC MO NEC NSO OH&S PAC PBS
- Page 17 and 18: Chief justice’s review Part 1
- Page 19 and 20: The past year has been a challengin
- Page 21 and 22: provide a single entry point - it h
- Page 23 and 24: While the formal evaluation of the
- Page 25: Conclusion The Family Court of Aust
- Page 28 and 29: Overview of the court Part 2 12 Fam
- Page 30 and 31: Governance The Chief Justice is res
- Page 32 and 33: The Internal Audit Committee has al
- Page 34 and 35: Overview of the court Part 2 The Co
- Page 36 and 37: The development of internal protoco
- Page 38 and 39: The Honourable Justice Brian Edward
- Page 40 and 41: Administrative Appeals Tribunal (NO
- Page 42 and 43: Overview of the court Part 2 Hopeva
- Page 44 and 45: ORGANISATIONAL STRUCTURE - 30 JUNE
- Page 46 and 47: Report on Court performance Part 3
- Page 48 and 49: Data quality Report on Court perfor
- Page 50 and 51: Output Group 1.1 Resolution Providi
- Page 52 and 53: Performance Report on Court perform
- Page 54 and 55: Since very few divorce applications
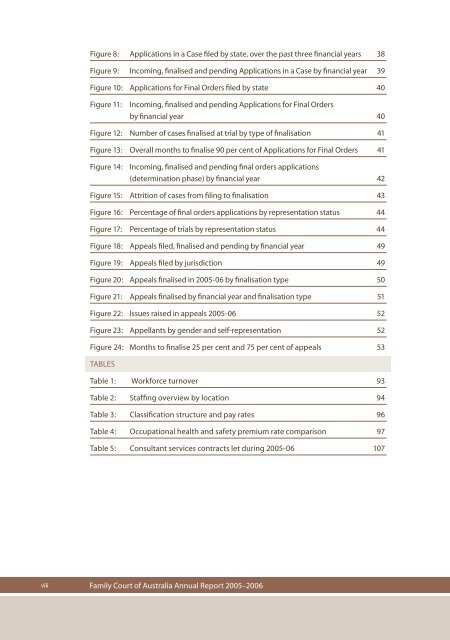
- Page 56 and 57: Figure 10 shows the Applications fo
- Page 58 and 59: Report on Court performance Part 3
- Page 60 and 61:
Figure 16 provides an indication of
- Page 62 and 63:
Appeals Part 4 46 Family Court of A
- Page 64 and 65:
Administration of appeals Appeals a
- Page 66 and 67:
The Court heard 83 appeals, other t
- Page 68 and 69:
Figure 22: Issues raised in appeals
- Page 71 and 72:
SIGNIFICANT JUDGMENTS Part 5
- Page 73 and 74:
Significant judgments In the past y
- Page 75 and 76:
isk of psychological harm to the ch
- Page 77 and 78:
3. The factors identified by the hu
- Page 79 and 80:
Property adjustment — Superannuat
- Page 81 and 82:
Held: Appeal allowed. Remitted for
- Page 83 and 84:
Costs — Security for costs applic
- Page 85 and 86:
Child sexual abuse allegations —
- Page 87 and 88:
6. Each of her Honour’s findings
- Page 89 and 90:
not filed with the Court. The wife
- Page 91 and 92:
7. In relation to his Honour’s s
- Page 93 and 94:
FIRST INSTANCE JUDGMENTS Property a
- Page 95 and 96:
6. The complex issues raised by the
- Page 97 and 98:
It is not necessary to consider if
- Page 99 and 100:
The mother submitted that the child
- Page 101 and 102:
3. Court intervention should be lim
- Page 103 and 104:
Costs — Costs agreements — Whet
- Page 105 and 106:
Other reporting Part 6
- Page 107 and 108:
Management of Human Resources The p
- Page 109 and 110:
Ten places in the National Public S
- Page 111 and 112:
Legend SES Senior Executive Service
- Page 113 and 114:
Occupational Health and Safety (OH&
- Page 115 and 116:
The Court is working to continually
- Page 117 and 118:
Facilities for examining documents
- Page 119 and 120:
The Family Court took these steps t
- Page 121 and 122:
Parramatta Fit-out alterations were
- Page 123 and 124:
Table 5: Consultant services contra
- Page 125:
Advertising and market research The
- Page 128 and 129:
Financial sTATEMENTS Part 7 112 Fam
- Page 130 and 131:
Financial sTATEMENTS Part 7 114 Fam
- Page 132 and 133:
Financial sTATEMENTS Part 7 116 Fam
- Page 134 and 135:
FAMILY COURT OF OF AUSTRALIA INCOME
- Page 136 and 137:
FAMILY COURT OF OF AUSTRALIA STATEM
- Page 138 and 139:
FAMILY COURT OF OF AUSTRALIA SCHEDU
- Page 140 and 141:
FAMILY COURT OF OF AUSTRALIA SCHEDU
- Page 142 and 143:
Notes to to and and forming part pa
- Page 144 and 145:
Notes to and forming part of the Fi
- Page 146 and 147:
Notes to and forming part of the Fi
- Page 148 and 149:
Notes to and forming part of the Fi
- Page 150 and 151:
Notes to and forming part of the Fi
- Page 152 and 153:
Notes Notes to and to and forming p
- Page 154 and 155:
Notes to to and and forming part of
- Page 156 and 157:
Notes Notes to and to and forming f
- Page 158 and 159:
Notes Notes to to and and forming f
- Page 160 and 161:
Notes to and forming part of of the
- Page 162 and 163:
Notes to and forming part of of the
- Page 164 and 165:
Notes to to and and forming part pa
- Page 166 and 167:
Notes to and forming part part of o
- Page 168 and 169:
Financial sTATEMENTS Part 7 Notes t
- Page 170 and 171:
Notes to and forming part part of o
- Page 172 and 173:
Financial sTATEMENTS Part 7 Notes t
- Page 175 and 176:
Appendices Part 8
- Page 177 and 178:
Appendix 1 Court Committees and Pub
- Page 179 and 180:
In addition to the Law Reform Commi
- Page 181 and 182:
Appendix 2 Judicial activities In a
- Page 183 and 184:
Many judges and judicial registrars
- Page 185 and 186:
Registries ADELAIDE 3 Angas St, Ade
- Page 187:
APPENDIX 4 Resources for Outcomes O
- Page 190 and 191:
Glossary of terms Part 9 174 Family
- Page 192 and 193:
Judicial Registrar - A judicial off
- Page 194 and 195:
Compliance index Part 10 178 Family
- Page 196 and 197:
Compliance index Part 10 Corporate
- Page 198 and 199:
Alphabetical Index Part 10 Australi
- Page 200 and 201:
Alphabetical Index Part 10 Deputy C
- Page 202 and 203:
Freedom of Information Act 1982, 10
- Page 204 and 205:
O Alphabetical Index Part 10 Occupa
- Page 206:
Alphabetical Index Part 10 Women’


