View a full copy of this report (PDF Size - 3.69 MB) - Family Court of ...
View a full copy of this report (PDF Size - 3.69 MB) - Family Court of ...
View a full copy of this report (PDF Size - 3.69 MB) - Family Court of ...

You also want an ePaper? Increase the reach of your titles
YUMPU automatically turns print PDFs into web optimized ePapers that Google loves.
Financial sTATEMENTS Part 7<br />
Notes to and forming part <strong>of</strong> the Financial Statements<br />
Notes to and forming part <strong>of</strong> the Financial Statements<br />
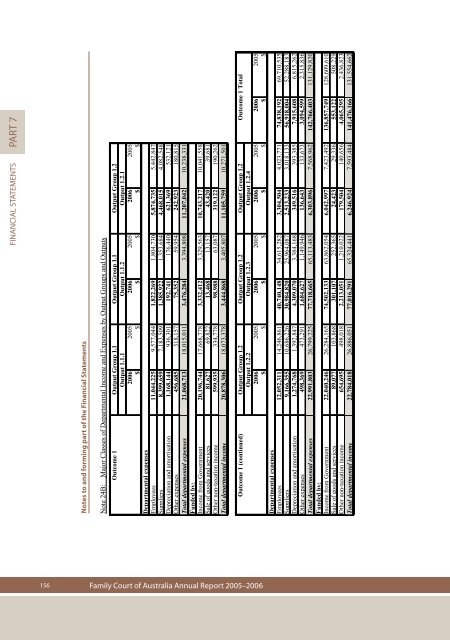
Note 24B: Major Classes <strong>of</strong> Departmental Income and Expenses by Output Groups and Outputs<br />
Outcome 1 Output Group 1.1 Output Group 1.1 Output Group 1.2<br />
Output 1.1.1 Output 1.1.2 Output 1.2.1<br />
2006 2005 2006 2005 2006 2005<br />
$ $ $ $ $ $<br />
Departmental expenses<br />
Employees 11,044,225 9,577,044 1,822,269 1,804,730 5,874,735 5,442,847<br />
Suppliers 8,399,659 7,183,509 1,385,922 1,353,684 4,468,015 4,082,548<br />
Depreciation and amortisation 1,168,144 936,301 192,741 176,440 621,369 532,121<br />
Other expenses 456,685 318,157 75,352 59,954 242,923 180,815<br />
Total departmental expenses 21,068,713 18,015,011 3,476,284 3,394,808 11,207,042 10,238,331<br />
Funded by:<br />
Income from Government 20,196,744 17,668,778 3,332,412 3,329,563 10,743,217 10,041,558<br />
Sale <strong>of</strong> goods and services 81,627 69,822 13,468 13,157 43,420 39,681<br />
Other non-taxation income 599,935 334,778 98,988 63,087 319,122 190,262<br />
Total departmental income 20,878,306 18,073,378 3,444,868 3,405,807 11,105,759 10,271,501<br />
Outcome 1 (continued) Output Group 1.2 Output Group 1.2 Output Group 1.2 Outcome 1 Total<br />
Output 1.2.2 Output 1.2.3 Output 1.2.4<br />
2006 2005 2006 2005 2006 2005 2006 2005<br />
$ $ $ $ $ $ $ $<br />
Departmental expenses<br />
Employees 12,052,311 14,246,861 40,740,148 34,615,282 3,304,504 4,023,771 74,838,192 69,710,535<br />
Suppliers 9,166,355 10,686,226 30,984,820 25,964,087 2,513,233 3,018,133 56,918,004 52,288,187<br />
Depreciation and amortisation 1,274,768 1,392,847 4,309,070 3,384,168 349,516 393,385 7,915,608 6,815,262<br />
Other expenses 498,369 473,291 1,684,627 1,149,946 136,643 133,673 3,094,599 2,315,836<br />
Total departmental expenses 22,991,803 26,799,225 77,718,665 65,113,483 6,303,896 7,568,962 142,766,403 131,129,820<br />
Funded by:<br />
Income from Government 22,040,246 26,284,165 74,502,133 63,862,054 6,042,997 7,423,492 136,857,749 128,609,610<br />
Sale <strong>of</strong> goods and services 89,077 103,868 301,107 252,365 24,423 29,336 553,122 508,229<br />
Other non-taxation income 654,695 498,018 2,213,051 1,210,022 179,504 140,656 4,065,295 2,436,823<br />
Total departmental income 22,784,018 26,886,051 77,016,291 65,324,441 6,246,924 7,593,484 141,476,166 131,554,662<br />
156<br />
<strong>Family</strong> <strong>Court</strong> <strong>of</strong> Australia Annual Report 2005–2006