Effect of Slurry Flow Rate on Tribological, Thermal, and Removal ...
Effect of Slurry Flow Rate on Tribological, Thermal, and Removal ...
Effect of Slurry Flow Rate on Tribological, Thermal, and Removal ...

Create successful ePaper yourself
Turn your PDF publications into a flip-book with our unique Google optimized e-Paper software.
G482<br />
Journal <str<strong>on</strong>g>of</str<strong>on</strong>g> The Electrochemical Society, 151 7 G482-G487 2004<br />
0013-4651/2004/1517/G482/6/$7.00 © The Electrochemical Society, Inc.<br />
<str<strong>on</strong>g>Effect</str<strong>on</strong>g> <str<strong>on</strong>g>of</str<strong>on</strong>g> <str<strong>on</strong>g>Slurry</str<strong>on</strong>g> <str<strong>on</strong>g>Flow</str<strong>on</strong>g> <str<strong>on</strong>g>Rate</str<strong>on</strong>g> <strong>on</strong> <strong>Tribological</strong>, <strong>Thermal</strong>,<br />
<strong>and</strong> <strong>Removal</strong> <str<strong>on</strong>g>Rate</str<strong>on</strong>g> Attributes <str<strong>on</strong>g>of</str<strong>on</strong>g> Copper CMP<br />
Z. Li, a, * ,z L. Borucki, b, ** I. Koshiyama, c <strong>and</strong> A. Philipossian a, **<br />
a University <str<strong>on</strong>g>of</str<strong>on</strong>g> Ariz<strong>on</strong>a, Department <str<strong>on</strong>g>of</str<strong>on</strong>g> Chemical <strong>and</strong> Envir<strong>on</strong>mental Engineering,<br />
Tucs<strong>on</strong>, Ariz<strong>on</strong>a 85721 USA<br />
b Intelligent Planar, Mesa, Ariz<strong>on</strong>a 85205 USA<br />
c Fujimi Incorporated, Kagamigahara, Gifu Prefecture 509-0108, Japan<br />
Chemical mechanical polishing <str<strong>on</strong>g>of</str<strong>on</strong>g> copper is examined experimentally <strong>and</strong> theoretically as a functi<strong>on</strong> <str<strong>on</strong>g>of</str<strong>on</strong>g> slurry flow rate <strong>and</strong> the<br />
product <str<strong>on</strong>g>of</str<strong>on</strong>g> applied wafer pressure <strong>and</strong> relative sliding speed (p V). It is observed that under c<strong>on</strong>stant tribological c<strong>on</strong>diti<strong>on</strong>s,<br />
the removal rate at any fixed value <str<strong>on</strong>g>of</str<strong>on</strong>g> p V generally decreases as slurry flow rate increases. The increased cooling <str<strong>on</strong>g>of</str<strong>on</strong>g> the wafer<br />
surface, as a result <str<strong>on</strong>g>of</str<strong>on</strong>g> increased slurry flow rate, is used to explain this reducti<strong>on</strong> in the reacti<strong>on</strong> rate. At a fixed flow rate, it is<br />
further observed that removal rate does not necessarily increase m<strong>on</strong>ot<strong>on</strong>ically with p V. The rate instead depends <strong>on</strong> the<br />
particular values <str<strong>on</strong>g>of</str<strong>on</strong>g> pressure <strong>and</strong> velocity, regardless <str<strong>on</strong>g>of</str<strong>on</strong>g> the fact that they may result in the same value <str<strong>on</strong>g>of</str<strong>on</strong>g> p V. This dependence<br />
is shown to be caused by changes in the coefficient for c<strong>on</strong>vective heat-transfer between the wafer <strong>and</strong> the slurry, as well as the<br />
heat partiti<strong>on</strong> factor, which determines the fracti<strong>on</strong> <str<strong>on</strong>g>of</str<strong>on</strong>g> the total fricti<strong>on</strong>al power that heats the wafer. Results further indicate that<br />
trends in copper removal rate can be adequately explained with a Langmuir-Hinshelwood kinetics model with both mechanical <strong>and</strong><br />
chemical rate comp<strong>on</strong>ents.<br />
© 2004 The Electrochemical Society. DOI: 10.1149/1.1758818 All rights reserved.<br />
Manuscript submitted November 7, 2003; revised manuscript received January 3, 2004. Available electr<strong>on</strong>ically June 10, 2004.<br />
Copper polishing in rotary chemical mechanical planarizati<strong>on</strong><br />
CMP tools is an important step in the producti<strong>on</strong> <str<strong>on</strong>g>of</str<strong>on</strong>g> copper interc<strong>on</strong>nects<br />
using the dual-damascene process. It has been observed<br />
that the polish rate <str<strong>on</strong>g>of</str<strong>on</strong>g> copper is highly sensitive to temperature, with<br />
an activati<strong>on</strong> energy <strong>on</strong> the order <str<strong>on</strong>g>of</str<strong>on</strong>g> 0.5-0.6 eV. 1,2 This indicates that<br />
a 10°C change in the temperature <str<strong>on</strong>g>of</str<strong>on</strong>g> the pad may be sufficient to<br />
double the copper removal rate. 2 Because <str<strong>on</strong>g>of</str<strong>on</strong>g> this sensitivity, the rate<br />
<strong>and</strong> uniformity <str<strong>on</strong>g>of</str<strong>on</strong>g> copper polishing can be affected by factors that by<br />
intent or by accident change the thermal envir<strong>on</strong>ment <str<strong>on</strong>g>of</str<strong>on</strong>g> the wafer.<br />
Am<strong>on</strong>g the important recognized factors are the applied pressure p,<br />
the relative sliding velocity (V) between the wafer <strong>and</strong> the pad, <strong>and</strong><br />
the kinetic coefficient <str<strong>on</strong>g>of</str<strong>on</strong>g> fricti<strong>on</strong> COF k (t) that is interpolated<br />
linearly from COF data. The product k (t)pV is the total power per<br />
unit area dissipated by fricti<strong>on</strong> by the wafer, pad, <strong>and</strong> slurry. Less<br />
well recognized is that this power may be partiti<strong>on</strong>ed unequally,<br />
providing more or less heating <str<strong>on</strong>g>of</str<strong>on</strong>g> the wafer depending <strong>on</strong> the particular<br />
c<strong>on</strong>diti<strong>on</strong>s <str<strong>on</strong>g>of</str<strong>on</strong>g> sliding as well as the thermal c<strong>on</strong>ductivities <str<strong>on</strong>g>of</str<strong>on</strong>g><br />
the materials involved. 3 Because heat loss is part <str<strong>on</strong>g>of</str<strong>on</strong>g> the energy balance<br />
for the wafer, factors that alter wafer cooling are also important.<br />
In particular, it is shown that increasing the slurry flow rate can<br />
lower the wafer temperature <strong>and</strong> reduce removal rate. Similarly, at a<br />
fixed power input, increasing the sliding speed can also reduce the<br />
polish rate through increased c<strong>on</strong>vective cooling <str<strong>on</strong>g>of</str<strong>on</strong>g> the wafer. All<br />
these effects can occur under otherwise c<strong>on</strong>stant tribological c<strong>on</strong>diti<strong>on</strong>s,<br />
<strong>and</strong> large differences in rate are possible at c<strong>on</strong>stant values <str<strong>on</strong>g>of</str<strong>on</strong>g><br />
p V.<br />
board. The apparatus was calibrated to report the force associated<br />
with a particular voltage reading. Details <str<strong>on</strong>g>of</str<strong>on</strong>g> the experimental apparatus<br />
are described elsewhere. 4 Copper disks, having a nominal diameter<br />
<str<strong>on</strong>g>of</str<strong>on</strong>g> 100 mm <strong>and</strong> a purity <str<strong>on</strong>g>of</str<strong>on</strong>g> 99.99% were used as substrates.<br />
Previous studies 5 had shown that copper disks were a viable alternative<br />
to copper-deposited silic<strong>on</strong> wafers for tribological, thermal,<br />
<strong>and</strong> kinetic investigati<strong>on</strong>s. C<strong>on</strong>diti<strong>on</strong>ing was performed in situ using<br />
a diam<strong>on</strong>d c<strong>on</strong>diti<strong>on</strong>er at a nominal applied pressure <str<strong>on</strong>g>of</str<strong>on</strong>g> 0.5 psi,<br />
rotati<strong>on</strong>al velocity <str<strong>on</strong>g>of</str<strong>on</strong>g> 30 rpm, <strong>and</strong> sweep frequency <str<strong>on</strong>g>of</str<strong>on</strong>g> 20 per min.<br />
Pad c<strong>on</strong>diti<strong>on</strong>ing was followed by a5minpadbreak-in. Pressures<br />
<strong>and</strong> relative pad-wafer velocities were 1.5, 2.0, <strong>and</strong> 2.5 psi <strong>and</strong> 0.31,<br />
0.62, <strong>and</strong> 1.09 m/s 40, 80, <strong>and</strong> 140 rpm, respectively. <str<strong>on</strong>g>Slurry</str<strong>on</strong>g> flow<br />
rates were 80 <strong>and</strong> 140 cc/min. These corresp<strong>on</strong>ded to flow rates <str<strong>on</strong>g>of</str<strong>on</strong>g><br />
215 <strong>and</strong> 377 cc/min <strong>on</strong> the 200 mm industrial Speedfam-IPEC 472<br />
polisher. An infrared video camera was used to record pad temperatures<br />
at 0.2 s intervals at ten fixed locati<strong>on</strong>s near the pad at the<br />
leading edge. Real-time COF data were taken simultaneously al<strong>on</strong>g<br />
real-time infrared thermal measurements. <strong>Removal</strong> rates were calculated<br />
by determining the weight <str<strong>on</strong>g>of</str<strong>on</strong>g> the copper disk prior to <strong>and</strong> after<br />
polishing using a precise balance with a readability <str<strong>on</strong>g>of</str<strong>on</strong>g> 0.01 mg.<br />
Results<br />
Figure 1 shows the Stribeck curves associated with the two flow<br />
rates. Over the range <str<strong>on</strong>g>of</str<strong>on</strong>g> Sommerfeld numbers c<strong>on</strong>sidered, both<br />
Stribeck curves have slopes that are nearly zero. This implies that<br />
the tribological wear mechanism across the range <str<strong>on</strong>g>of</str<strong>on</strong>g> Sommerfeld<br />
Experimental<br />
Experiments were performed <strong>on</strong> a scaled versi<strong>on</strong> <str<strong>on</strong>g>of</str<strong>on</strong>g> a Speedfam-<br />
IPEC 472 polisher using Rodel’s IC-1000 k-groove pads <strong>and</strong> Fujimi’s<br />
PL-7102 copper slurry c<strong>on</strong>taining hydrogen peroxide as the<br />
oxidant. To measure the shear force between the pad <strong>and</strong> the wafer<br />
during polish, a sliding table was placed beneath the polisher. The<br />
sliding table c<strong>on</strong>sists <str<strong>on</strong>g>of</str<strong>on</strong>g> a bottom <strong>and</strong> a top plate that the polisher is<br />
set up<strong>on</strong>. As the wafer <strong>and</strong> pad are engaged, the top plate slides with<br />
respect to the bottom plate in <strong>on</strong>ly <strong>on</strong>e directi<strong>on</strong> due to fricti<strong>on</strong><br />
between the pad <strong>and</strong> wafer. The degree <str<strong>on</strong>g>of</str<strong>on</strong>g> sliding is quantified by<br />
coupling the two plates to a load cell. The load cell is attached to a<br />
strain gauge amplifier that sends a voltage to a data acquisiti<strong>on</strong><br />
* Electrochemical Society Student Member.<br />
** Electrochemical Society Active Member.<br />
z E-mail: zh<strong>on</strong>glin@email.ariz<strong>on</strong>a.edu<br />
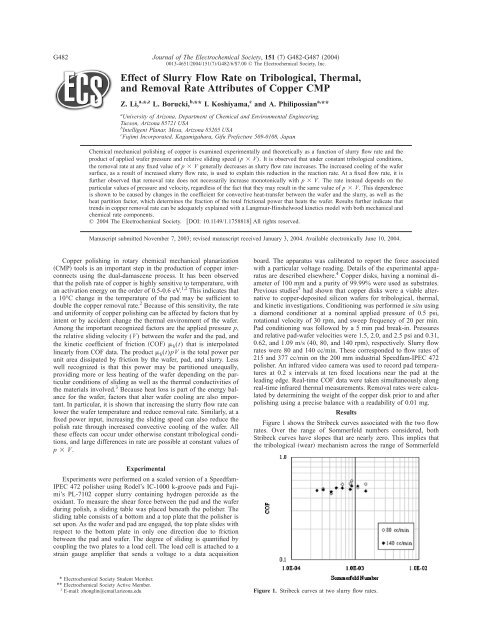
Figure 1. Stribeck curves at two slurry flow rates.
Journal <str<strong>on</strong>g>of</str<strong>on</strong>g> The Electrochemical Society, 151 7 G482-G487 2004<br />
G483<br />
Figure 4. Comparis<strong>on</strong> <str<strong>on</strong>g>of</str<strong>on</strong>g> temperature transients associated with upper line<br />
2.5 psi <strong>and</strong> 1.09 m/s, <strong>and</strong> lower line 1.5 psi <strong>and</strong> 0.31 m/s.<br />
Figure 2. COF data at different flow rates 2.0 psi, 1.09 m/s.<br />
numbers investigated is the same in both cases. The mean COF at 80<br />
cc/min is 0.517, while at 140 cc/min, it is <strong>on</strong>ly slightly lower at<br />
0.491. COFs <str<strong>on</strong>g>of</str<strong>on</strong>g> this magnitude, coupled with the relatively flat<br />
shape <str<strong>on</strong>g>of</str<strong>on</strong>g> the Stribeck curves, indicate the tribological mechanism to<br />
be that <str<strong>on</strong>g>of</str<strong>on</strong>g> ‘‘boundary lubricati<strong>on</strong>’’ in which abrasive particles, pad<br />
asperities, <strong>and</strong> the surface <str<strong>on</strong>g>of</str<strong>on</strong>g> the wafer are all in direct c<strong>on</strong>tact with<br />
<strong>on</strong>e another.<br />
Figure 2 shows that at a c<strong>on</strong>stant wafer pressure <strong>and</strong> relative<br />
pad-wafer velocity, increasing the slurry flow rate from 80 to 140<br />
cc/min reduces COF. This observati<strong>on</strong>, coupled with the fact that<br />
slurry flow rate does not affect the lubricati<strong>on</strong> mechanism, is significant<br />
because it shows that slurry flow rate can be used to modulate<br />
average COF without changing the lubricati<strong>on</strong> mechanism. This is<br />
the key to isolating <strong>and</strong> studying the effect <str<strong>on</strong>g>of</str<strong>on</strong>g> COF <strong>on</strong> removal rate<br />
without having to worry about potential changes in the lubricati<strong>on</strong><br />
characteristics <str<strong>on</strong>g>of</str<strong>on</strong>g> the process with changes in flow rate.<br />
Throughout the course <str<strong>on</strong>g>of</str<strong>on</strong>g> this study, removal rate data is represented<br />
in two ways. First, as in the case <str<strong>on</strong>g>of</str<strong>on</strong>g> Fig. 3, removal rate is<br />
plotted as a functi<strong>on</strong> <str<strong>on</strong>g>of</str<strong>on</strong>g> p V. Results indicate that copper removal<br />
is faster at 80 compared to 140 cc/min. The increase in removal rate<br />
at the lower flow rate is as much as 15%. In Fig. 3, the three lefth<strong>and</strong>-most<br />
pairs <str<strong>on</strong>g>of</str<strong>on</strong>g> data points were taken at a relative pad-wafer<br />
velocity <str<strong>on</strong>g>of</str<strong>on</strong>g> 0.31 m/s. The middle three pairs corresp<strong>on</strong>ded to 0.62<br />
m/s, while the three right-h<strong>and</strong>-most pairs <str<strong>on</strong>g>of</str<strong>on</strong>g> data points were taken<br />
at 1.09 m/s. The most intriguing feature <str<strong>on</strong>g>of</str<strong>on</strong>g> Fig. 3 occurs in the<br />
regi<strong>on</strong> corresp<strong>on</strong>ding to a p V value <str<strong>on</strong>g>of</str<strong>on</strong>g> about 11,000 Pa m/s<br />
W/m 2 , which coincides with the transiti<strong>on</strong> from 2.5 psi <strong>and</strong> 0.62<br />
m/s to 1.5 psi <strong>and</strong> 1.09 m/s. In this regi<strong>on</strong>, as indicated in Fig. 1, the<br />
tribological mechanism <strong>and</strong> the COF are also nearly c<strong>on</strong>stant, yet<br />
according to Fig. 3, there is a notable drop in the removal rate at the<br />
higher velocity at both flow rates. This drop is more pr<strong>on</strong>ounced at<br />
higher flow rate. The reas<strong>on</strong> for this observed n<strong>on</strong>-Prest<strong>on</strong>ian behavior<br />
is discussed later in this article by using appropriate thermal <strong>and</strong><br />
reacti<strong>on</strong> rate models.<br />
The pad temperature transient measured by the IR camera corresp<strong>on</strong>ding<br />
to a slurry flow rate <str<strong>on</strong>g>of</str<strong>on</strong>g> 80 cc/min is shown in Fig. 4. Pad<br />
temperature transient for a given polishing run is defined as the<br />
difference between the average temperature <str<strong>on</strong>g>of</str<strong>on</strong>g> the pad at the end <str<strong>on</strong>g>of</str<strong>on</strong>g><br />
the 75 s polishing interval <strong>and</strong> the average temperature <str<strong>on</strong>g>of</str<strong>on</strong>g> the pad at<br />
the beginning <str<strong>on</strong>g>of</str<strong>on</strong>g> the process. It can be seen that at the highest value<br />
<str<strong>on</strong>g>of</str<strong>on</strong>g> p V, the pad temperature increases by more than 6°C, while at<br />
the lowest value <str<strong>on</strong>g>of</str<strong>on</strong>g> p V, pad temperature remains nearly the<br />
same throughout the polish process. As a general trend, real-time<br />
thermal mapping <str<strong>on</strong>g>of</str<strong>on</strong>g> the pad surface indicated a rise in the average<br />
pad temperature with increasing values <str<strong>on</strong>g>of</str<strong>on</strong>g> p V.<br />
Results show that pad temperature, slurry flow rate, <strong>and</strong> removal<br />
rate are all interrelated. In Fig. 5, removal rate data is plotted as a<br />
functi<strong>on</strong> <str<strong>on</strong>g>of</str<strong>on</strong>g> 1/kT¯p , where k is Boltzmann’s c<strong>on</strong>stant <strong>and</strong> T¯p is the<br />
mean pad temperature taken collectively over time at five sample<br />
points at the leading edge <str<strong>on</strong>g>of</str<strong>on</strong>g> the wafer. Again a reducti<strong>on</strong> in removal<br />
rate is observed as flow rate is increased, <strong>and</strong> except at 1.09 m/s, the<br />
reducti<strong>on</strong> in removal rate is actually associated with a slight increase<br />
in the mean leading edge pad temperature. Thus, the pad temperature<br />
is not necessarily a good indicator <str<strong>on</strong>g>of</str<strong>on</strong>g> the observed trends in<br />
removal rate. For a given slurry flow rate, the scatter in the data<br />
points shown in Fig. 5, as well as the apparent departure from a<br />
classical Arrhenius relati<strong>on</strong>ship i.e., the lack <str<strong>on</strong>g>of</str<strong>on</strong>g> a c<strong>on</strong>stant slope<br />
which would be indicative <str<strong>on</strong>g>of</str<strong>on</strong>g> the activati<strong>on</strong> energy is due to the<br />
Figure 3. <strong>Removal</strong> rate as a functi<strong>on</strong> <str<strong>on</strong>g>of</str<strong>on</strong>g> p V at two slurry flow rates.<br />
Figure 5. <strong>Removal</strong> rates vs. 1/kT, where T is the mean pad temperature at<br />
the leading edge <str<strong>on</strong>g>of</str<strong>on</strong>g> the wafer.
G484<br />
Journal <str<strong>on</strong>g>of</str<strong>on</strong>g> The Electrochemical Society, 151 7 G482-G487 2004<br />
Figure 6. <strong>Thermal</strong> model <strong>and</strong> its associated energy balance.<br />
dependence <str<strong>on</strong>g>of</str<strong>on</strong>g> removal rate <strong>on</strong> 1/kT a thermal factor, as well as <strong>on</strong><br />
p V a mechanical factor. In all cases the mean pad temperature<br />
is different from the mean wafer temperature, thus necessitating the<br />
c<strong>on</strong>structi<strong>on</strong> <str<strong>on</strong>g>of</str<strong>on</strong>g> reliable thermal <strong>and</strong> reacti<strong>on</strong> rate models in order to<br />
explain the observed trends in removal rate.<br />
<strong>Thermal</strong> <strong>and</strong> Reacti<strong>on</strong> <str<strong>on</strong>g>Rate</str<strong>on</strong>g> Models<br />
<strong>Thermal</strong> model.—<strong>Thermal</strong> analysis <str<strong>on</strong>g>of</str<strong>on</strong>g> the experimental data was<br />
performed with a model described in Ref. 6, in which the emphasis<br />
was <strong>on</strong> the thermal modeling <str<strong>on</strong>g>of</str<strong>on</strong>g> the pad. The schematic graph <str<strong>on</strong>g>of</str<strong>on</strong>g> the<br />
thermal model <strong>and</strong> its associated overall energy balance is shown in<br />
Figure 8. Estimated mean wafer temperatures corresp<strong>on</strong>ding to 80 <strong>and</strong><br />
140 cc/min.<br />
Fig. 6. Focusing <strong>on</strong> the wafer, the heat flux k (t)pV due to fricti<strong>on</strong><br />
is partiti<strong>on</strong>ed between the wafer <strong>and</strong> pad with the fracti<strong>on</strong><br />
w <br />
w<br />
w 0.627 Vr w<br />
D<br />
entering the wafer. 3 In Eq. 1, w is an effective thermal c<strong>on</strong>ductivity<br />
associated with the wafer which may depend <strong>on</strong> the surface layers<br />
present, <strong>and</strong> D are the thermal c<strong>on</strong>ductivity <strong>and</strong> thermal diffusivity<br />
<str<strong>on</strong>g>of</str<strong>on</strong>g> the pad, respectively, V is the relative sliding speed, <strong>and</strong> r w is<br />
the wafer radius. The heat flux into the wafer is<br />
1<br />
w<br />
T w<br />
z<br />
w k tpV h ws T w T s <br />
2<br />
where T w is the local wafer temperature, T s is the local slurry temperature,<br />
<strong>and</strong> h ws is a heat-transfer coefficient for exchange between<br />
the wafer <strong>and</strong> slurry. From Eq. 1 <strong>and</strong> 2, it may be seen that an<br />
increase in the sliding speed V results in a decrease in the heat<br />
partiti<strong>on</strong> fracti<strong>on</strong> <strong>and</strong> therefore a decline in the fracti<strong>on</strong> <str<strong>on</strong>g>of</str<strong>on</strong>g> the total<br />
heat flux to the wafer. The slurry temperature field T s in Eq. 2 is<br />
determined by the general model described in Ref. 6. In this model,<br />
the slurry exchanges heat with the pad, wafer, <strong>and</strong> air <strong>and</strong> c<strong>on</strong>vects<br />
it radially outward from the center <str<strong>on</strong>g>of</str<strong>on</strong>g> the pad with velocity<br />
Figure 7. a Ambient temperatures estimated from IR thermal measurements.<br />
b Comparis<strong>on</strong> <str<strong>on</strong>g>of</str<strong>on</strong>g> calculated <strong>and</strong> measured mean pad temperatures<br />
near the leading edge <str<strong>on</strong>g>of</str<strong>on</strong>g> the wafer.<br />
Figure 9. <strong>Removal</strong> rates vs. 1/kT, where T is the mean pad temperature at<br />
the leading edge <str<strong>on</strong>g>of</str<strong>on</strong>g> the wafer.
Journal <str<strong>on</strong>g>of</str<strong>on</strong>g> The Electrochemical Society, 151 7 G482-G487 2004<br />
G485<br />
Figure 10. Simulati<strong>on</strong> <strong>and</strong> experimental<br />
removal rate as a functi<strong>on</strong> <str<strong>on</strong>g>of</str<strong>on</strong>g> p V.<br />
f s /(2h 0 s r), where r is the radius <strong>on</strong> the pad, f s is the slurry flow<br />
rate, <strong>and</strong> h 0<br />
s is the slurry thickness between grooves. Under the<br />
wafer, it is assumed that the slurry is entrained by the pad with no<br />
outward c<strong>on</strong>vective moti<strong>on</strong>. The slurry flow model is very rudimentary,<br />
capturing <strong>on</strong>ly the general outward flow. It can be seen that all<br />
other factors being equal, increasing slurry flow rate f s increases the<br />
rate at which heat is transported <str<strong>on</strong>g>of</str<strong>on</strong>g>f the pad, resulting in cooling <str<strong>on</strong>g>of</str<strong>on</strong>g><br />
the wafer due to lowering <str<strong>on</strong>g>of</str<strong>on</strong>g> T s . In Eq. 2, the c<strong>on</strong>vective heattransfer<br />
coefficient h ws between the wafer <strong>and</strong> slurry varies as the<br />
square root <str<strong>on</strong>g>of</str<strong>on</strong>g> the sliding speed. In Ref. 6, h ws was estimated directly<br />
from correlati<strong>on</strong> theory for pad <strong>and</strong> wafer rotati<strong>on</strong> rates <str<strong>on</strong>g>of</str<strong>on</strong>g> 120<br />
rpm 0.93 m/s. At the same separati<strong>on</strong> between the pad <strong>and</strong> wafer<br />
centers, we can relate the heat-transfer coefficient at sliding speed V<br />
to the speed at 120 rpm<br />
h ws V h ws V 120 V<br />
V 120<br />
The ratio <str<strong>on</strong>g>of</str<strong>on</strong>g> the sliding speeds in Eq. 3 is also the same as the ratio<br />
<str<strong>on</strong>g>of</str<strong>on</strong>g> the rotati<strong>on</strong> rates.<br />
Reacti<strong>on</strong> rate model.—In this report, copper removal rate can be<br />
described well by a subset <str<strong>on</strong>g>of</str<strong>on</strong>g> the Langmuir-Hinshelwood model in<br />
Ref. 7, summarized below. In this model, n moles <str<strong>on</strong>g>of</str<strong>on</strong>g> an unspecified<br />
reactant R in the slurry react at a rate k 1 with the copper film <strong>on</strong> the<br />
wafer to form a product layer L <strong>on</strong> the surface<br />
k 1<br />
Cu nR → L 4<br />
The reacted layer is then removed by mechanical abrasi<strong>on</strong> with a<br />
rate k 2<br />
3<br />
L → L 5<br />
k 2<br />
The abraded material L is carried away by the slurry <strong>and</strong> is not<br />
redeposited. The local removal rate in this sequential mechanism is<br />
RR M w<br />
<br />
k 1 C<br />
1 k 1C<br />
k 2<br />
where M w is the molecular weight <str<strong>on</strong>g>of</str<strong>on</strong>g> copper, is the density, <strong>and</strong> C<br />
is the local molar c<strong>on</strong>centrati<strong>on</strong> <str<strong>on</strong>g>of</str<strong>on</strong>g> reactant. It is assumed that there<br />
is little reactant depleti<strong>on</strong> so that C remains c<strong>on</strong>stant. This allows C<br />
to be absorbed into k 1 <strong>and</strong> be set to unity. In Eq. 6, the rate <str<strong>on</strong>g>of</str<strong>on</strong>g> the<br />
chemical reacti<strong>on</strong> is expressed as k 1 A exp( E/kT w ) with C<br />
6<br />
1. Assuming that the mechanical removal rate is proporti<strong>on</strong>al to<br />
p V, then k 2 c p pV, where c p is an assumed proporti<strong>on</strong>ality<br />
c<strong>on</strong>stant. In the mechanically limited extreme, the polish rate is<br />
RR (M w c p /)pV <strong>and</strong> in the opposite limit it is RR<br />
(M w /)k 1 .<br />
It is important to note the physical dependence <str<strong>on</strong>g>of</str<strong>on</strong>g> the variables in<br />
the removal rate law Eq. 5 with this choice <str<strong>on</strong>g>of</str<strong>on</strong>g> k 1 <strong>and</strong> k 2 . While the<br />
experimental value <str<strong>on</strong>g>of</str<strong>on</strong>g> p V can be chosen at will, the local wafer<br />
temperature T w cannot because it is a functi<strong>on</strong> <str<strong>on</strong>g>of</str<strong>on</strong>g> p V through the<br />
boundary c<strong>on</strong>diti<strong>on</strong> expressed by Eq. 2. T w is also independently<br />
influenced by COF, w , the slurry temperature, <strong>and</strong> the wafer-slurry<br />
heat-transfer coefficient, so that p V does not completely determine<br />
the wafer temperature.<br />
Comparis<strong>on</strong> <str<strong>on</strong>g>of</str<strong>on</strong>g> Theory <strong>and</strong> Experiments<br />
The calibrati<strong>on</strong> <str<strong>on</strong>g>of</str<strong>on</strong>g> the thermal model for copper polishing <strong>and</strong><br />
comparis<strong>on</strong>s <str<strong>on</strong>g>of</str<strong>on</strong>g> pad temperature histories predicted by the model<br />
with measured pad temperatures, including thermal effects from in<br />
situ c<strong>on</strong>diti<strong>on</strong>ing, are described in Ref. 8. This model in turn is a<br />
slight reparameterizati<strong>on</strong> <str<strong>on</strong>g>of</str<strong>on</strong>g> the same model for oxide polish. 6 In the<br />
present analysis, the important parameters involve the heat partiti<strong>on</strong><br />
fracti<strong>on</strong> in Eq. 1 for which the value <str<strong>on</strong>g>of</str<strong>on</strong>g> w 217 W/m K was chosen<br />
vs. the value <str<strong>on</strong>g>of</str<strong>on</strong>g> 124 for silic<strong>on</strong>, <strong>and</strong> 385 for pure copper in Ref.<br />
8, <strong>and</strong> the wafer-slurry heat-transfer coefficient in Eq. 3, which was<br />
estimated as 762 W/m 2 °C at 120 rpm for the applicati<strong>on</strong> in Ref. 6.<br />
As menti<strong>on</strong>ed in Eq. 1, the effective thermal c<strong>on</strong>ductivity <str<strong>on</strong>g>of</str<strong>on</strong>g> wafer<br />
was associated with the layers presented in the wafer surface. During<br />
the polishing, the wafer surface was fully or partly covered with<br />
oxide copper rather other just pure copper; thus, the effective thermal<br />
c<strong>on</strong>ductivity was lower than that <str<strong>on</strong>g>of</str<strong>on</strong>g> pure copper. The value <str<strong>on</strong>g>of</str<strong>on</strong>g><br />
w 217 W/m K was an optimized <strong>on</strong>e by fitting the model to the<br />
experimental measured data.<br />
Based <strong>on</strong> this calibrati<strong>on</strong>, the model was run for all pressures,<br />
relative pad-wafer velocities, <strong>and</strong> slurry flow rates. The measured<br />
COF from each c<strong>on</strong>diti<strong>on</strong> was smoothed with a linear regressi<strong>on</strong> line<br />
as described in Ref. 8. The ambient temperature that was employed<br />
as an initial c<strong>on</strong>diti<strong>on</strong> in each case for the pad, wafer, <strong>and</strong> slurry <strong>and</strong><br />
for calculating the c<strong>on</strong>vective heat loss to the air was estimated by<br />
averaging the five initial temperatures measured <strong>on</strong> the surface <str<strong>on</strong>g>of</str<strong>on</strong>g><br />
the pad near the leading edge <str<strong>on</strong>g>of</str<strong>on</strong>g> the wafer. The ambient temperature<br />
was found to vary by as much as 1.5°C about a mean <str<strong>on</strong>g>of</str<strong>on</strong>g> 25°C, as<br />
shown in Fig. 7a. Figure 7b compares the calculated mean pad temperature<br />
rise at sample point locati<strong>on</strong>s with the measured mean temperatures.<br />
These are in good agreement over all c<strong>on</strong>diti<strong>on</strong>s, thus<br />
providing added c<strong>on</strong>fidence in the calibrati<strong>on</strong> <str<strong>on</strong>g>of</str<strong>on</strong>g> the model. The<br />
model then provided the wafer temperature field needed for comput-
G486<br />
Journal <str<strong>on</strong>g>of</str<strong>on</strong>g> The Electrochemical Society, 151 7 G482-G487 2004<br />
Figure 11. Theoretical mechanical <strong>and</strong> chemical c<strong>on</strong>tributi<strong>on</strong>s to copper removal<br />
rate.<br />
Figure 12. C<strong>on</strong>tour graph <str<strong>on</strong>g>of</str<strong>on</strong>g> removal rate vs. wafer temperature p V.<br />
ing the reacti<strong>on</strong> rates using Eq. 6. Figure 8 shows the estimated<br />
mean wafer temperature plotted against the mean leading edge pad<br />
temperature. Results show that wafer temperature rises approximately<br />
twice as fast as the pad temperature.<br />
Figure 9 plots the modeled <strong>and</strong> measured removal rates using the<br />
estimated mean wafer temperature rather than the mean pad temperature.<br />
Compared to Fig. 5, the removal rate data is now<br />
‘‘stretched’’ slightly in the horiz<strong>on</strong>tal directi<strong>on</strong> due to the temperature<br />
rescaling. It is observed that at the lower rotati<strong>on</strong> rates, there is<br />
also some scatter <strong>and</strong> apparent r<strong>and</strong>omizati<strong>on</strong> <str<strong>on</strong>g>of</str<strong>on</strong>g> the data points<br />
because removal rate is dependent <strong>on</strong> 1/kT as well as <strong>on</strong> p V.<br />
Next, starting with the estimated mean wafer temperatures for<br />
each c<strong>on</strong>diti<strong>on</strong>, the parameters A, E, <strong>and</strong> c p in the removal rate<br />
expressi<strong>on</strong> Eq. 6 were calculated by minimizing the least-squares<br />
error between the predicti<strong>on</strong>s <str<strong>on</strong>g>of</str<strong>on</strong>g> Eq. 6 <strong>and</strong> the measured rates. The<br />
optimum values, A 2.7 10 8 mol/m 2 s, E 0.68 eV, <strong>and</strong> c p<br />
2.2 10 7 mol/Pa m 3 provided a root-mean-square rms fitting<br />
error <str<strong>on</strong>g>of</str<strong>on</strong>g> 313 Å. The estimated activati<strong>on</strong> energy E is close to<br />
those measured in Ref. 1 <strong>and</strong> 2. The model was then re-run under all<br />
c<strong>on</strong>diti<strong>on</strong>s <strong>and</strong> the mean removal rate calculated over the wafer<br />
surface as shown in Fig. 10. The model reproduces much <str<strong>on</strong>g>of</str<strong>on</strong>g> the<br />
scatter at the lower rotati<strong>on</strong> rates. As menti<strong>on</strong>ed earlier, the reas<strong>on</strong><br />
for the scatter is that removal rate depends <strong>on</strong> both T w <strong>and</strong> p V<br />
rather than just <strong>on</strong> T w . The model captures the upward trend in<br />
removal rate with p V, the reducti<strong>on</strong> in removal rate with increased<br />
slurry flow at higher values <str<strong>on</strong>g>of</str<strong>on</strong>g> p V, <strong>and</strong> the downward<br />
transiti<strong>on</strong> that occurs between 0.62 <strong>and</strong> 1.09 m/s.<br />
Using the model, the underlying causes for changes in removal<br />
rate at the transiti<strong>on</strong> between 2.5 psi <strong>and</strong> 0.62 m/s to 1.5 psi <strong>and</strong> 1.09<br />
m/s at which p V is nearly c<strong>on</strong>stant at 11,000 Pa m/s were<br />
investigated. At a c<strong>on</strong>stant slurry flow rate <str<strong>on</strong>g>of</str<strong>on</strong>g> 140 cc/min, the ambient<br />
temperature, COF functi<strong>on</strong>, heat partiti<strong>on</strong> fracti<strong>on</strong>, <strong>and</strong> waferslurry<br />
heat-transfer coefficient were systematically switched from<br />
the 1.5 psi <strong>and</strong> 1.09 m/s c<strong>on</strong>diti<strong>on</strong> to the 2.5 psi <strong>and</strong> 0.62 m/s<br />
c<strong>on</strong>diti<strong>on</strong>. It was found that the ambient temperature, COF, <strong>and</strong> heat<br />
partiti<strong>on</strong> fracti<strong>on</strong> accounted for about 40% <str<strong>on</strong>g>of</str<strong>on</strong>g> the temperature<br />
change with the latter two accounting for most <str<strong>on</strong>g>of</str<strong>on</strong>g> the difference <strong>and</strong><br />
having about equal influences. About 55% <str<strong>on</strong>g>of</str<strong>on</strong>g> the difference was due<br />
to a change in the c<strong>on</strong>vective cooling coefficient, <strong>and</strong> the remainder<br />
was accounted for by the fact that p V was not precisely c<strong>on</strong>stant<br />
across the transiti<strong>on</strong>.<br />
The individual values <str<strong>on</strong>g>of</str<strong>on</strong>g> k 1 <strong>and</strong> k 2 obtained from the fit are<br />
plotted against p V in Fig. 11. This figure indicates that copper<br />
removal is mechanically limited at the lowest values <str<strong>on</strong>g>of</str<strong>on</strong>g> p V <strong>and</strong><br />
reacti<strong>on</strong> limited at the higher values <str<strong>on</strong>g>of</str<strong>on</strong>g> p V. The solid line is a<br />
plot <str<strong>on</strong>g>of</str<strong>on</strong>g> k 2 c p p V representing the mechanical rate c<strong>on</strong>stant,<br />
while circles represent the chemical rate computed by averaging<br />
k 1 A exp(E/kT w ) over the wafer surface, where T w is the<br />
wafer temperature in Kelvin. In Fig. 11, k 2 is represented by a<br />
straight line because it depends <strong>on</strong>ly <strong>on</strong> p V. The circles do not<br />
fall exactly <strong>on</strong> a straight line because k 1 depends <strong>on</strong> wafer temperature<br />
which is <strong>on</strong>ly partly determined by p V. C<strong>on</strong>sidering that<br />
removal rate is dependent <strong>on</strong> both thermal <strong>and</strong> mechanical factors, a<br />
c<strong>on</strong>tour plot describing the removal rate as the functi<strong>on</strong>s <str<strong>on</strong>g>of</str<strong>on</strong>g> temperature<br />
<strong>and</strong> p V is a more appropriate representati<strong>on</strong> <str<strong>on</strong>g>of</str<strong>on</strong>g> the removal<br />
rate characteristics <str<strong>on</strong>g>of</str<strong>on</strong>g> the copper CMP process. As shown in Fig. 12,<br />
the c<strong>on</strong>tour plot adequately captures the complex interplay am<strong>on</strong>g<br />
removal rate, temperature, <strong>and</strong> p V during the process.<br />
C<strong>on</strong>clusi<strong>on</strong>s<br />
Copper removal rates were examined experimentally <strong>and</strong> theoretically<br />
as a functi<strong>on</strong> <str<strong>on</strong>g>of</str<strong>on</strong>g> fricti<strong>on</strong>al power density <strong>and</strong> slurry flow<br />
rate under c<strong>on</strong>stant boundary lubricati<strong>on</strong> c<strong>on</strong>diti<strong>on</strong>s. The observed<br />
decrease in removal rate with increasing slurry flow rate was supported<br />
by theory, which attributed the change to the cooling <str<strong>on</strong>g>of</str<strong>on</strong>g> the<br />
wafer by the slurry. An observed transiti<strong>on</strong> in the removal rate that<br />
occurred when the rotati<strong>on</strong> rate was changed at nearly c<strong>on</strong>stant<br />
value <str<strong>on</strong>g>of</str<strong>on</strong>g> p V was also theoretically explained as being due to a<br />
combinati<strong>on</strong> <str<strong>on</strong>g>of</str<strong>on</strong>g> a change in the COF, the heat partiti<strong>on</strong> factor, <strong>and</strong><br />
the wafer-slurry heat-transfer coefficient, with the latter being dominant.<br />
Trends in removal rates were explained as a functi<strong>on</strong> <str<strong>on</strong>g>of</str<strong>on</strong>g> p<br />
V <strong>and</strong> the wafer temperature using a model with both chemical<br />
<strong>and</strong> mechanical comp<strong>on</strong>ents. The model was reacti<strong>on</strong> rate limited at<br />
higher removal rates, emphasizing that removal <str<strong>on</strong>g>of</str<strong>on</strong>g> copper, unlike<br />
oxide, was in general n<strong>on</strong>-Prest<strong>on</strong>ian.<br />
Acknowledgments<br />
The authors express their gratitude to Pr<str<strong>on</strong>g>of</str<strong>on</strong>g>essor Duane B<strong>on</strong>ing <str<strong>on</strong>g>of</str<strong>on</strong>g><br />
MIT for allowing the authors to borrow MITs infrared camera for<br />
thermal analysis. This work was financially supported by the NSF/<br />
SRC Engineering Research Center for Envir<strong>on</strong>mentally Benign<br />
Semic<strong>on</strong>ductor Manufacturing.<br />
The University <str<strong>on</strong>g>of</str<strong>on</strong>g> Ariz<strong>on</strong>a assisted in meeting the publicati<strong>on</strong> costs <str<strong>on</strong>g>of</str<strong>on</strong>g> this<br />
article.<br />
References<br />
1. J. Sorooshian, D. DeNardis, L. Charns, Z. Li, D. B<strong>on</strong>ing, F. Shadman, <strong>and</strong> A.<br />
Philipossian, in Proceedings <str<strong>on</strong>g>of</str<strong>on</strong>g> the 2003 CMP-MIC, p. 43-50 2003.<br />
2. P. Renteln <strong>and</strong> T. Ninh, Mater. Res. Soc. Symp. Proc., 566, 155 1999.
Journal <str<strong>on</strong>g>of</str<strong>on</strong>g> The Electrochemical Society, 151 7 G482-G487 2004<br />
G487<br />
3. R Cowan <strong>and</strong> W. Winer, in ASM H<strong>and</strong>book, Fricti<strong>on</strong>, Lubricati<strong>on</strong> <strong>and</strong> Wear Technology,<br />
vol. 18, P. J. Blau, Editor, pp. 39-44, ASM Internati<strong>on</strong>al Materials Park, OH<br />
1992.<br />
4. A. Philipossian <strong>and</strong> E. Mitchell, Micro, 207, 852002.<br />
5. Z. Li, S. Rader, P. Lefevre, K. Ina, <strong>and</strong> A. Philipossian, Paper 899 presented at The<br />
Electrochemical Society Meeting, Orl<strong>and</strong>o, FL, Oct 12-17, 2003.<br />
6. L. Borucki, L. Charns, <strong>and</strong> A. Philipossian, Paper 918 presented at The Electrochemical<br />
Society Meeting, Orl<strong>and</strong>o, FL, Oct 12-17, 2003.<br />
7. D. Thakurta, D. Schwendeman, R. Gutmann, S. Shankar, L. Jiang, <strong>and</strong> W. Gill,<br />
Thin Solid Films, 414, 782002.<br />
8. L. Borucki, Z. Li, <strong>and</strong> A. Philipossian, Paper 903 presented at The Electrochemical<br />
Society Meeting, Orl<strong>and</strong>o, FL, Oct 12-17, 2003.