Effect of Slurry Flow Rate on Tribological, Thermal, and Removal ...
Effect of Slurry Flow Rate on Tribological, Thermal, and Removal ...
Effect of Slurry Flow Rate on Tribological, Thermal, and Removal ...

Create successful ePaper yourself
Turn your PDF publications into a flip-book with our unique Google optimized e-Paper software.
Journal <str<strong>on</strong>g>of</str<strong>on</strong>g> The Electrochemical Society, 151 7 G482-G487 2004<br />
G485<br />
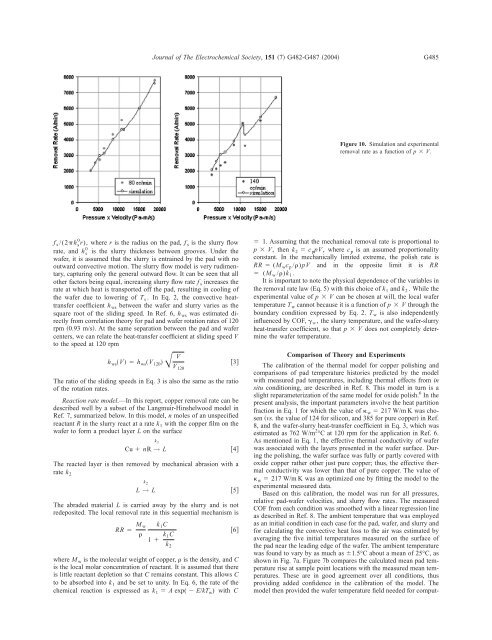
Figure 10. Simulati<strong>on</strong> <strong>and</strong> experimental<br />
removal rate as a functi<strong>on</strong> <str<strong>on</strong>g>of</str<strong>on</strong>g> p V.<br />
f s /(2h 0 s r), where r is the radius <strong>on</strong> the pad, f s is the slurry flow<br />
rate, <strong>and</strong> h 0<br />
s is the slurry thickness between grooves. Under the<br />
wafer, it is assumed that the slurry is entrained by the pad with no<br />
outward c<strong>on</strong>vective moti<strong>on</strong>. The slurry flow model is very rudimentary,<br />
capturing <strong>on</strong>ly the general outward flow. It can be seen that all<br />
other factors being equal, increasing slurry flow rate f s increases the<br />
rate at which heat is transported <str<strong>on</strong>g>of</str<strong>on</strong>g>f the pad, resulting in cooling <str<strong>on</strong>g>of</str<strong>on</strong>g><br />
the wafer due to lowering <str<strong>on</strong>g>of</str<strong>on</strong>g> T s . In Eq. 2, the c<strong>on</strong>vective heattransfer<br />
coefficient h ws between the wafer <strong>and</strong> slurry varies as the<br />
square root <str<strong>on</strong>g>of</str<strong>on</strong>g> the sliding speed. In Ref. 6, h ws was estimated directly<br />
from correlati<strong>on</strong> theory for pad <strong>and</strong> wafer rotati<strong>on</strong> rates <str<strong>on</strong>g>of</str<strong>on</strong>g> 120<br />
rpm 0.93 m/s. At the same separati<strong>on</strong> between the pad <strong>and</strong> wafer<br />
centers, we can relate the heat-transfer coefficient at sliding speed V<br />
to the speed at 120 rpm<br />
h ws V h ws V 120 V<br />
V 120<br />
The ratio <str<strong>on</strong>g>of</str<strong>on</strong>g> the sliding speeds in Eq. 3 is also the same as the ratio<br />
<str<strong>on</strong>g>of</str<strong>on</strong>g> the rotati<strong>on</strong> rates.<br />
Reacti<strong>on</strong> rate model.—In this report, copper removal rate can be<br />
described well by a subset <str<strong>on</strong>g>of</str<strong>on</strong>g> the Langmuir-Hinshelwood model in<br />
Ref. 7, summarized below. In this model, n moles <str<strong>on</strong>g>of</str<strong>on</strong>g> an unspecified<br />
reactant R in the slurry react at a rate k 1 with the copper film <strong>on</strong> the<br />
wafer to form a product layer L <strong>on</strong> the surface<br />
k 1<br />
Cu nR → L 4<br />
The reacted layer is then removed by mechanical abrasi<strong>on</strong> with a<br />
rate k 2<br />
3<br />
L → L 5<br />
k 2<br />
The abraded material L is carried away by the slurry <strong>and</strong> is not<br />
redeposited. The local removal rate in this sequential mechanism is<br />
RR M w<br />
<br />
k 1 C<br />
1 k 1C<br />
k 2<br />
where M w is the molecular weight <str<strong>on</strong>g>of</str<strong>on</strong>g> copper, is the density, <strong>and</strong> C<br />
is the local molar c<strong>on</strong>centrati<strong>on</strong> <str<strong>on</strong>g>of</str<strong>on</strong>g> reactant. It is assumed that there<br />
is little reactant depleti<strong>on</strong> so that C remains c<strong>on</strong>stant. This allows C<br />
to be absorbed into k 1 <strong>and</strong> be set to unity. In Eq. 6, the rate <str<strong>on</strong>g>of</str<strong>on</strong>g> the<br />
chemical reacti<strong>on</strong> is expressed as k 1 A exp( E/kT w ) with C<br />
6<br />
1. Assuming that the mechanical removal rate is proporti<strong>on</strong>al to<br />
p V, then k 2 c p pV, where c p is an assumed proporti<strong>on</strong>ality<br />
c<strong>on</strong>stant. In the mechanically limited extreme, the polish rate is<br />
RR (M w c p /)pV <strong>and</strong> in the opposite limit it is RR<br />
(M w /)k 1 .<br />
It is important to note the physical dependence <str<strong>on</strong>g>of</str<strong>on</strong>g> the variables in<br />
the removal rate law Eq. 5 with this choice <str<strong>on</strong>g>of</str<strong>on</strong>g> k 1 <strong>and</strong> k 2 . While the<br />
experimental value <str<strong>on</strong>g>of</str<strong>on</strong>g> p V can be chosen at will, the local wafer<br />
temperature T w cannot because it is a functi<strong>on</strong> <str<strong>on</strong>g>of</str<strong>on</strong>g> p V through the<br />
boundary c<strong>on</strong>diti<strong>on</strong> expressed by Eq. 2. T w is also independently<br />
influenced by COF, w , the slurry temperature, <strong>and</strong> the wafer-slurry<br />
heat-transfer coefficient, so that p V does not completely determine<br />
the wafer temperature.<br />
Comparis<strong>on</strong> <str<strong>on</strong>g>of</str<strong>on</strong>g> Theory <strong>and</strong> Experiments<br />
The calibrati<strong>on</strong> <str<strong>on</strong>g>of</str<strong>on</strong>g> the thermal model for copper polishing <strong>and</strong><br />
comparis<strong>on</strong>s <str<strong>on</strong>g>of</str<strong>on</strong>g> pad temperature histories predicted by the model<br />
with measured pad temperatures, including thermal effects from in<br />
situ c<strong>on</strong>diti<strong>on</strong>ing, are described in Ref. 8. This model in turn is a<br />
slight reparameterizati<strong>on</strong> <str<strong>on</strong>g>of</str<strong>on</strong>g> the same model for oxide polish. 6 In the<br />
present analysis, the important parameters involve the heat partiti<strong>on</strong><br />
fracti<strong>on</strong> in Eq. 1 for which the value <str<strong>on</strong>g>of</str<strong>on</strong>g> w 217 W/m K was chosen<br />
vs. the value <str<strong>on</strong>g>of</str<strong>on</strong>g> 124 for silic<strong>on</strong>, <strong>and</strong> 385 for pure copper in Ref.<br />
8, <strong>and</strong> the wafer-slurry heat-transfer coefficient in Eq. 3, which was<br />
estimated as 762 W/m 2 °C at 120 rpm for the applicati<strong>on</strong> in Ref. 6.<br />
As menti<strong>on</strong>ed in Eq. 1, the effective thermal c<strong>on</strong>ductivity <str<strong>on</strong>g>of</str<strong>on</strong>g> wafer<br />
was associated with the layers presented in the wafer surface. During<br />
the polishing, the wafer surface was fully or partly covered with<br />
oxide copper rather other just pure copper; thus, the effective thermal<br />
c<strong>on</strong>ductivity was lower than that <str<strong>on</strong>g>of</str<strong>on</strong>g> pure copper. The value <str<strong>on</strong>g>of</str<strong>on</strong>g><br />
w 217 W/m K was an optimized <strong>on</strong>e by fitting the model to the<br />
experimental measured data.<br />
Based <strong>on</strong> this calibrati<strong>on</strong>, the model was run for all pressures,<br />
relative pad-wafer velocities, <strong>and</strong> slurry flow rates. The measured<br />
COF from each c<strong>on</strong>diti<strong>on</strong> was smoothed with a linear regressi<strong>on</strong> line<br />
as described in Ref. 8. The ambient temperature that was employed<br />
as an initial c<strong>on</strong>diti<strong>on</strong> in each case for the pad, wafer, <strong>and</strong> slurry <strong>and</strong><br />
for calculating the c<strong>on</strong>vective heat loss to the air was estimated by<br />
averaging the five initial temperatures measured <strong>on</strong> the surface <str<strong>on</strong>g>of</str<strong>on</strong>g><br />
the pad near the leading edge <str<strong>on</strong>g>of</str<strong>on</strong>g> the wafer. The ambient temperature<br />
was found to vary by as much as 1.5°C about a mean <str<strong>on</strong>g>of</str<strong>on</strong>g> 25°C, as<br />
shown in Fig. 7a. Figure 7b compares the calculated mean pad temperature<br />
rise at sample point locati<strong>on</strong>s with the measured mean temperatures.<br />
These are in good agreement over all c<strong>on</strong>diti<strong>on</strong>s, thus<br />
providing added c<strong>on</strong>fidence in the calibrati<strong>on</strong> <str<strong>on</strong>g>of</str<strong>on</strong>g> the model. The<br />
model then provided the wafer temperature field needed for comput-