Effect of Slurry Flow Rate on Tribological, Thermal, and Removal ...
Effect of Slurry Flow Rate on Tribological, Thermal, and Removal ...
Effect of Slurry Flow Rate on Tribological, Thermal, and Removal ...

You also want an ePaper? Increase the reach of your titles
YUMPU automatically turns print PDFs into web optimized ePapers that Google loves.
G486<br />
Journal <str<strong>on</strong>g>of</str<strong>on</strong>g> The Electrochemical Society, 151 7 G482-G487 2004<br />
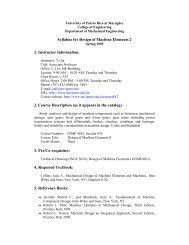
Figure 11. Theoretical mechanical <strong>and</strong> chemical c<strong>on</strong>tributi<strong>on</strong>s to copper removal<br />
rate.<br />
Figure 12. C<strong>on</strong>tour graph <str<strong>on</strong>g>of</str<strong>on</strong>g> removal rate vs. wafer temperature p V.<br />
ing the reacti<strong>on</strong> rates using Eq. 6. Figure 8 shows the estimated<br />
mean wafer temperature plotted against the mean leading edge pad<br />
temperature. Results show that wafer temperature rises approximately<br />
twice as fast as the pad temperature.<br />
Figure 9 plots the modeled <strong>and</strong> measured removal rates using the<br />
estimated mean wafer temperature rather than the mean pad temperature.<br />
Compared to Fig. 5, the removal rate data is now<br />
‘‘stretched’’ slightly in the horiz<strong>on</strong>tal directi<strong>on</strong> due to the temperature<br />
rescaling. It is observed that at the lower rotati<strong>on</strong> rates, there is<br />
also some scatter <strong>and</strong> apparent r<strong>and</strong>omizati<strong>on</strong> <str<strong>on</strong>g>of</str<strong>on</strong>g> the data points<br />
because removal rate is dependent <strong>on</strong> 1/kT as well as <strong>on</strong> p V.<br />
Next, starting with the estimated mean wafer temperatures for<br />
each c<strong>on</strong>diti<strong>on</strong>, the parameters A, E, <strong>and</strong> c p in the removal rate<br />
expressi<strong>on</strong> Eq. 6 were calculated by minimizing the least-squares<br />
error between the predicti<strong>on</strong>s <str<strong>on</strong>g>of</str<strong>on</strong>g> Eq. 6 <strong>and</strong> the measured rates. The<br />
optimum values, A 2.7 10 8 mol/m 2 s, E 0.68 eV, <strong>and</strong> c p<br />
2.2 10 7 mol/Pa m 3 provided a root-mean-square rms fitting<br />
error <str<strong>on</strong>g>of</str<strong>on</strong>g> 313 Å. The estimated activati<strong>on</strong> energy E is close to<br />
those measured in Ref. 1 <strong>and</strong> 2. The model was then re-run under all<br />
c<strong>on</strong>diti<strong>on</strong>s <strong>and</strong> the mean removal rate calculated over the wafer<br />
surface as shown in Fig. 10. The model reproduces much <str<strong>on</strong>g>of</str<strong>on</strong>g> the<br />
scatter at the lower rotati<strong>on</strong> rates. As menti<strong>on</strong>ed earlier, the reas<strong>on</strong><br />
for the scatter is that removal rate depends <strong>on</strong> both T w <strong>and</strong> p V<br />
rather than just <strong>on</strong> T w . The model captures the upward trend in<br />
removal rate with p V, the reducti<strong>on</strong> in removal rate with increased<br />
slurry flow at higher values <str<strong>on</strong>g>of</str<strong>on</strong>g> p V, <strong>and</strong> the downward<br />
transiti<strong>on</strong> that occurs between 0.62 <strong>and</strong> 1.09 m/s.<br />
Using the model, the underlying causes for changes in removal<br />
rate at the transiti<strong>on</strong> between 2.5 psi <strong>and</strong> 0.62 m/s to 1.5 psi <strong>and</strong> 1.09<br />
m/s at which p V is nearly c<strong>on</strong>stant at 11,000 Pa m/s were<br />
investigated. At a c<strong>on</strong>stant slurry flow rate <str<strong>on</strong>g>of</str<strong>on</strong>g> 140 cc/min, the ambient<br />
temperature, COF functi<strong>on</strong>, heat partiti<strong>on</strong> fracti<strong>on</strong>, <strong>and</strong> waferslurry<br />
heat-transfer coefficient were systematically switched from<br />
the 1.5 psi <strong>and</strong> 1.09 m/s c<strong>on</strong>diti<strong>on</strong> to the 2.5 psi <strong>and</strong> 0.62 m/s<br />
c<strong>on</strong>diti<strong>on</strong>. It was found that the ambient temperature, COF, <strong>and</strong> heat<br />
partiti<strong>on</strong> fracti<strong>on</strong> accounted for about 40% <str<strong>on</strong>g>of</str<strong>on</strong>g> the temperature<br />
change with the latter two accounting for most <str<strong>on</strong>g>of</str<strong>on</strong>g> the difference <strong>and</strong><br />
having about equal influences. About 55% <str<strong>on</strong>g>of</str<strong>on</strong>g> the difference was due<br />
to a change in the c<strong>on</strong>vective cooling coefficient, <strong>and</strong> the remainder<br />
was accounted for by the fact that p V was not precisely c<strong>on</strong>stant<br />
across the transiti<strong>on</strong>.<br />
The individual values <str<strong>on</strong>g>of</str<strong>on</strong>g> k 1 <strong>and</strong> k 2 obtained from the fit are<br />
plotted against p V in Fig. 11. This figure indicates that copper<br />
removal is mechanically limited at the lowest values <str<strong>on</strong>g>of</str<strong>on</strong>g> p V <strong>and</strong><br />
reacti<strong>on</strong> limited at the higher values <str<strong>on</strong>g>of</str<strong>on</strong>g> p V. The solid line is a<br />
plot <str<strong>on</strong>g>of</str<strong>on</strong>g> k 2 c p p V representing the mechanical rate c<strong>on</strong>stant,<br />
while circles represent the chemical rate computed by averaging<br />
k 1 A exp(E/kT w ) over the wafer surface, where T w is the<br />
wafer temperature in Kelvin. In Fig. 11, k 2 is represented by a<br />
straight line because it depends <strong>on</strong>ly <strong>on</strong> p V. The circles do not<br />
fall exactly <strong>on</strong> a straight line because k 1 depends <strong>on</strong> wafer temperature<br />
which is <strong>on</strong>ly partly determined by p V. C<strong>on</strong>sidering that<br />
removal rate is dependent <strong>on</strong> both thermal <strong>and</strong> mechanical factors, a<br />
c<strong>on</strong>tour plot describing the removal rate as the functi<strong>on</strong>s <str<strong>on</strong>g>of</str<strong>on</strong>g> temperature<br />
<strong>and</strong> p V is a more appropriate representati<strong>on</strong> <str<strong>on</strong>g>of</str<strong>on</strong>g> the removal<br />
rate characteristics <str<strong>on</strong>g>of</str<strong>on</strong>g> the copper CMP process. As shown in Fig. 12,<br />
the c<strong>on</strong>tour plot adequately captures the complex interplay am<strong>on</strong>g<br />
removal rate, temperature, <strong>and</strong> p V during the process.<br />
C<strong>on</strong>clusi<strong>on</strong>s<br />
Copper removal rates were examined experimentally <strong>and</strong> theoretically<br />
as a functi<strong>on</strong> <str<strong>on</strong>g>of</str<strong>on</strong>g> fricti<strong>on</strong>al power density <strong>and</strong> slurry flow<br />
rate under c<strong>on</strong>stant boundary lubricati<strong>on</strong> c<strong>on</strong>diti<strong>on</strong>s. The observed<br />
decrease in removal rate with increasing slurry flow rate was supported<br />
by theory, which attributed the change to the cooling <str<strong>on</strong>g>of</str<strong>on</strong>g> the<br />
wafer by the slurry. An observed transiti<strong>on</strong> in the removal rate that<br />
occurred when the rotati<strong>on</strong> rate was changed at nearly c<strong>on</strong>stant<br />
value <str<strong>on</strong>g>of</str<strong>on</strong>g> p V was also theoretically explained as being due to a<br />
combinati<strong>on</strong> <str<strong>on</strong>g>of</str<strong>on</strong>g> a change in the COF, the heat partiti<strong>on</strong> factor, <strong>and</strong><br />
the wafer-slurry heat-transfer coefficient, with the latter being dominant.<br />
Trends in removal rates were explained as a functi<strong>on</strong> <str<strong>on</strong>g>of</str<strong>on</strong>g> p<br />
V <strong>and</strong> the wafer temperature using a model with both chemical<br />
<strong>and</strong> mechanical comp<strong>on</strong>ents. The model was reacti<strong>on</strong> rate limited at<br />
higher removal rates, emphasizing that removal <str<strong>on</strong>g>of</str<strong>on</strong>g> copper, unlike<br />
oxide, was in general n<strong>on</strong>-Prest<strong>on</strong>ian.<br />
Acknowledgments<br />
The authors express their gratitude to Pr<str<strong>on</strong>g>of</str<strong>on</strong>g>essor Duane B<strong>on</strong>ing <str<strong>on</strong>g>of</str<strong>on</strong>g><br />
MIT for allowing the authors to borrow MITs infrared camera for<br />
thermal analysis. This work was financially supported by the NSF/<br />
SRC Engineering Research Center for Envir<strong>on</strong>mentally Benign<br />
Semic<strong>on</strong>ductor Manufacturing.<br />
The University <str<strong>on</strong>g>of</str<strong>on</strong>g> Ariz<strong>on</strong>a assisted in meeting the publicati<strong>on</strong> costs <str<strong>on</strong>g>of</str<strong>on</strong>g> this<br />
article.<br />
References<br />
1. J. Sorooshian, D. DeNardis, L. Charns, Z. Li, D. B<strong>on</strong>ing, F. Shadman, <strong>and</strong> A.<br />
Philipossian, in Proceedings <str<strong>on</strong>g>of</str<strong>on</strong>g> the 2003 CMP-MIC, p. 43-50 2003.<br />
2. P. Renteln <strong>and</strong> T. Ninh, Mater. Res. Soc. Symp. Proc., 566, 155 1999.