Scargo Lake Water Quality Management Report - the Town of Dennis
Scargo Lake Water Quality Management Report - the Town of Dennis
Scargo Lake Water Quality Management Report - the Town of Dennis

You also want an ePaper? Increase the reach of your titles
YUMPU automatically turns print PDFs into web optimized ePapers that Google loves.
<strong>Scargo</strong> <strong>Lake</strong><br />
<strong>Water</strong> <strong>Quality</strong> <strong>Management</strong> <strong>Report</strong><br />
Draft FINAL REPORT<br />
October 2012<br />
for <strong>the</strong><br />
<strong>Town</strong> <strong>of</strong> <strong>Dennis</strong><br />
Prepared by:<br />
Coastal Systems Group<br />
School for Marine Science and Technology<br />
University <strong>of</strong> Massachusetts Dartmouth<br />
706 South Rodney French Blvd.<br />
New Bedford, MA 02744-1221
<strong>Scargo</strong> <strong>Lake</strong><br />
<strong>Water</strong> <strong>Quality</strong> <strong>Management</strong> <strong>Report</strong><br />
Draft FINAL REPORT<br />
October 2012<br />
Prepared for<br />
<strong>Town</strong> <strong>of</strong> <strong>Dennis</strong><br />
<strong>Water</strong> <strong>Quality</strong> Advisory Committee<br />
Department <strong>of</strong> Natural Resources<br />
Prepared By<br />
Ed Eichner, Senior <strong>Water</strong> Scientist/Project Manager<br />
Brian Howes, Director<br />
Dave Schlezinger, Research Associate<br />
COASTAL SYSTEMS GROUP<br />
SCHOOL FOR MARINE SCIENCE AND TECHNOLOGY<br />
UNIVERSITY OF MASSACHUSETTS DARTMOUTH<br />
706 South Rodney French Blvd., New Bedford, MA 02744-1221<br />
Cover photo: 2012 <strong>Scargo</strong> <strong>Lake</strong> Regatta courtesy <strong>of</strong> Wixon Middle Level Academy, N.H. Wixon Middle School
Acknowledgements:<br />
The authors acknowledge <strong>the</strong> contributions <strong>of</strong> <strong>the</strong> many individuals and boards who have worked<br />
tirelessly for <strong>the</strong> restoration and protection <strong>of</strong> <strong>the</strong> pond and lakes in <strong>the</strong> <strong>Town</strong> <strong>of</strong> <strong>Dennis</strong>. Without<br />
<strong>the</strong>se pond stewards and <strong>the</strong>ir efforts, this project would not have been possible.<br />
The author also specifically recognizes and applauds <strong>the</strong> generosity <strong>of</strong> time and effort spent by<br />
<strong>Dennis</strong> Pond and <strong>Lake</strong> Stewards (PALS) working through and with <strong>the</strong> <strong>Dennis</strong> <strong>Water</strong> <strong>Quality</strong><br />
Advisory Committee, both past and present members. These individuals gave <strong>of</strong> <strong>the</strong>ir time to<br />
collect water quality information, which made this analysis possible. Among this group<br />
particular thanks go to Suzanne Brock, Virginia Esau, Jennifer Flood, Cliff Adams, John Harper,<br />
Peter Berrien, Joshua L. Crowell, Seth H. Crowell, Bill McCormick, Richard Wilson, Willis A.<br />
Boo<strong>the</strong>, Dick Armstrong, Paul Fiset, Gerry Gallagher, Jerry Kellett, and Jean C. Twiss for <strong>the</strong>ir<br />
support and unquenchable advocacy for <strong>Dennis</strong> ponds and <strong>the</strong> citizens that care for <strong>the</strong>m.<br />
In addition to <strong>the</strong>se contributions, technical and project support has been freely and graciously<br />
provided by Karen Johnson, Brian Malone, Alan Marcy, and Terry Hayes at <strong>the</strong> <strong>Town</strong> <strong>of</strong> <strong>Dennis</strong><br />
and Mike Bartlett, David White, Dale Goehringer, Sara Sampieri, Jennifer Benson and o<strong>the</strong>rs at<br />
<strong>the</strong> Coastal Systems Program, School for Marine Science and Technology, University <strong>of</strong><br />
Massachusetts Dartmouth.<br />
Recommended Citation<br />
Eichner, E., B. Howes, and D. Schlezinger. 2012. <strong>Scargo</strong> <strong>Lake</strong> <strong>Water</strong> <strong>Quality</strong> <strong>Management</strong><br />
<strong>Report</strong>. Coastal Systems Program, School for Marine Science and Technology, University <strong>of</strong><br />
Massachusetts Dartmouth. New Bedford, MA. 65 pp.
Executive Summary<br />
<strong>Scargo</strong> <strong>Lake</strong><br />
<strong>Water</strong> <strong>Quality</strong> <strong>Management</strong> <strong>Report</strong><br />
draft Final <strong>Report</strong><br />
October 2012<br />
<strong>Scargo</strong> <strong>Lake</strong> is <strong>the</strong> largest (60 acres) and deepest (50 ft) freshwater pond in <strong>the</strong> <strong>Town</strong> <strong>of</strong><br />
<strong>Dennis</strong>. It is located to <strong>the</strong> north <strong>of</strong> <strong>Scargo</strong> Hill and south <strong>of</strong> Route 6A. The lake has two public<br />
beaches (<strong>Scargo</strong> Beach and Princess Beach) and a public boat ramp located <strong>of</strong>f Route 6A. A<br />
stream outlet in <strong>the</strong> nor<strong>the</strong>ast section connects <strong>the</strong> lake to Sesuit Harbor.<br />
Over <strong>the</strong> past 10 years or so, citizen volunteers have worked through advocacy and<br />
sampling time to develop key information about <strong>the</strong> water quality <strong>of</strong> <strong>Scargo</strong> <strong>Lake</strong>. In 2009, with<br />
<strong>the</strong> guidance <strong>of</strong> <strong>the</strong> town <strong>Water</strong> <strong>Quality</strong> Advisory Committee and <strong>the</strong> town Natural Resource<br />
Department, staff from <strong>the</strong> Coastal Systems Program, School for Marine Science and<br />
Technology (SMAST), University <strong>of</strong> Massachusetts Dartmouth completed a review <strong>of</strong> available<br />
water quality data and assessed where key targeted information was necessary to develop a water<br />
quality management plan (Eichner, 2009). The targeted data collection included collecting <strong>of</strong><br />
<strong>Scargo</strong> <strong>Lake</strong>-specific measures <strong>of</strong> stormwater run<strong>of</strong>f, sediment nutrient regeneration, bird<br />
populations, and an updated bathymetric map (Eichner and Howes, 2012). This report utilizes<br />
this information to provide an assessment <strong>of</strong> steps needed to restore <strong>Scargo</strong> <strong>Lake</strong>.<br />
Review <strong>of</strong> surface water conditions in <strong>Scargo</strong> <strong>Lake</strong> show conditions that are acceptable<br />
for swimming and o<strong>the</strong>r contact recreation. There has been no evidence <strong>of</strong> extensive algal<br />
blooms, blue-green algal blooms or fish kills; conditions that have impacted o<strong>the</strong>r Cape Cod<br />
ponds such as Hinckleys Pond in Harwich, Mystic <strong>Lake</strong> in Barnstable, and Long Pond in<br />
Brewster/Harwich. Total phosphorus and chlorophyll concentrations in this upper, warm layer,<br />
which extends down to 7-9 m, are elevated, but not exceptionally high.<br />
However, deeper in <strong>Scargo</strong> <strong>Lake</strong>, in <strong>the</strong> colder waters deeper than 9 m, are conditions<br />
that impair this portion <strong>of</strong> <strong>the</strong> lake habitat and raise concerns <strong>the</strong> future surface water quality <strong>of</strong><br />
<strong>the</strong> whole lake. During a given year, <strong>the</strong> earliest water quality data available is from April and<br />
this data shows that oxygen demand from <strong>the</strong> pond sediments has already begun to consume<br />
oxygen from overlying waters. These conditions persist and worsen throughout <strong>the</strong> summer,<br />
eventually reaching up to <strong>the</strong> bottom <strong>of</strong> <strong>the</strong> warm surface water layer and, on occasion, into <strong>the</strong><br />
surface water layer. Review <strong>of</strong> collected water quality data shows that <strong>the</strong>se low oxygen<br />
conditions release phosphorus, but overall phosphorus concentrations appear to be low enough<br />
and residual oxygen is high enough in <strong>the</strong> upper portions <strong>of</strong> <strong>the</strong> cold layer that extensive algal<br />
blooms are not initiated.<br />
These diminishing oxygen concentrations are due to sediment oxygen demand, but <strong>the</strong>re<br />
is no indication that <strong>the</strong> phosphorus released from <strong>the</strong>se sediments is seeping into <strong>the</strong> upper<br />
waters in a significant mass. The sediment testing indicates that aerobic sediments in <strong>the</strong> 4-8 m<br />
depth range are <strong>the</strong> primary sediment phosphorus source during <strong>the</strong> summer. The collection <strong>of</strong><br />
EX1
phosphorus in <strong>the</strong>se sediments may be facilitated by an extensive freshwater mussel population.<br />
Chlorophyll-a readings show that phytoplankton are growing more extensively at <strong>the</strong> low oxygen<br />
boundary (9 m), but <strong>the</strong>se do not seem to be extensively impacting concentrations in <strong>the</strong> waters<br />
above <strong>the</strong>m. Overall review <strong>of</strong> sediment data shows that <strong>the</strong> pond is collecting more phosphorus<br />
each year and it is likely that this will gradually worsen dissolved oxygen conditions over time<br />
without intervention. There is, however, no discernible trend <strong>of</strong> worsening dissolved oxygen<br />
conditions or Secchi clarity over <strong>the</strong> past 10 years.<br />
Review <strong>of</strong> potential next steps for <strong>the</strong> management <strong>of</strong> <strong>Scargo</strong> <strong>Lake</strong> largely depends on <strong>the</strong><br />
criteria that are used to judge its water quality conditions. Massachusetts Department <strong>of</strong><br />
Environmental Protection (MassDEP) regulatory standards for surface waters require dissolved<br />
oxygen concentrations in lakes with cold water fisheries to have dissolved oxygen (DO)<br />
concentrations <strong>of</strong> 6 ppm or above (314 CMR 4.05(3)(b)1). As shown in <strong>the</strong> DO pr<strong>of</strong>iles, <strong>the</strong> cold<br />
water fishery in <strong>Scargo</strong> <strong>Lake</strong> regularly disappears during <strong>the</strong> summer as sediment oxygen<br />
demand drops DO concentrations below 6 ppm throughout <strong>the</strong> whole cold water layer and with<br />
anoxic conditions (6 ppm), cold water can be sustained, it will provide some trout habitat, as well as protecting<br />
<strong>the</strong> warm, upper waters <strong>of</strong> <strong>the</strong> lake from regenerated deep water phosphorus. Project staff<br />
reviewed available options and recommend that <strong>the</strong> town consider implementing a hypolimnetic<br />
aeration project.<br />
Hypolimnetic aeration is a process <strong>of</strong> controlled injection <strong>of</strong> air into <strong>the</strong> deep water in<br />
such a way that <strong>the</strong> cold water layer is maintained and oxygen levels are increased. It is
ecommended that this process be confined to <strong>the</strong> deep basin <strong>of</strong> <strong>Scargo</strong> <strong>Lake</strong> in depths below 9<br />
m. Since <strong>the</strong> layers do not begin to form until April, <strong>the</strong> system could be turned on in May and<br />
run through September. Deep dissolved oxygen concentrations naturally begin to recover in<br />
October, as rapid cooling <strong>of</strong> <strong>the</strong> lake begins to breakdown <strong>the</strong> layers, so <strong>the</strong> system could be<br />
turned <strong>of</strong>f at that point.<br />
The area <strong>of</strong> <strong>the</strong> deep basin below 9 m is 16 acres and <strong>the</strong> average depth <strong>of</strong> this layer is 2<br />
m. This volume and area is relatively small for <strong>the</strong> application <strong>of</strong> hypolimnetic aeration and<br />
great care would be necessary in <strong>the</strong> design to have an air flow that sustains <strong>the</strong> <strong>the</strong>rmal layering.<br />
Based on ranges <strong>of</strong> cost presented in <strong>the</strong> MassGEIR (MassDEP/MassDCR, 2004) and updated to<br />
2011 dollars, <strong>the</strong> likely cost range would be $10,000 to $60,000. Preliminary calculations <strong>of</strong><br />
necessary air flow are small, so capital costs should be relatively small, but costs such as design,<br />
energy, and regulatory approval would likely push <strong>the</strong> costs toward <strong>the</strong> higher estimate. Long<br />
term maintenance would also have to be factored into <strong>the</strong> cost estimates. There are a number <strong>of</strong><br />
design options.<br />
Use <strong>of</strong> hypolimnetic aeration would be a long term solution that would need to be<br />
initiated and maintained each summer. Proper air/oxygen flows, mixing, and adequate<br />
characterization <strong>of</strong> <strong>the</strong> treated ponds are key factors in <strong>the</strong> most successful installations.<br />
Successful installations have no negative impacts on fish, shellfish, or plants. Unsuccessful<br />
installations present <strong>the</strong> opportunity to increase <strong>the</strong> transfer <strong>of</strong> phosphorus from deep waters to<br />
<strong>the</strong> more productive shallow waters and/or to destabilize <strong>the</strong> <strong>the</strong>rmal layering and compromise<br />
<strong>the</strong> cold water fishery. If this is combined with reductions in watershed phosphorus inputs, <strong>the</strong><br />
lake will gradually (over decades) reduce <strong>the</strong> mass <strong>of</strong> phosphorus in <strong>the</strong> sediments and <strong>the</strong><br />
sources from <strong>the</strong> watershed will not replenish this mass.<br />
Part <strong>of</strong> <strong>the</strong> long term success <strong>of</strong> <strong>the</strong> proposed in-lake treatment is going to be successful<br />
complementary reductions in watershed phosphorus inputs. As mentioned above, wastewater<br />
reductions would have <strong>the</strong> greatest impact. Wastewater is currently estimated to annually<br />
contribute 3.6 to 5.4 kg to <strong>Scargo</strong> <strong>Lake</strong>, which is greater than half <strong>of</strong> <strong>the</strong> watershed input.<br />
Removal <strong>of</strong> this whole load would reduce <strong>the</strong> mass in <strong>the</strong> lake to 34 to 44% <strong>of</strong> current levels and<br />
result in TP concentrations <strong>of</strong> 3.1 to 7.4 ppb without factoring in <strong>the</strong> sediment contributions.<br />
Accomplishing this type <strong>of</strong> reduction, however, would present a number <strong>of</strong> challenges.<br />
The houses on <strong>the</strong> western edge <strong>of</strong> <strong>the</strong> lake are located in areas <strong>of</strong> significant elevation changes<br />
and wastewater collection to ei<strong>the</strong>r neighborhood treatment facilities or a larger facility would<br />
have to address <strong>the</strong>se changes with pumps that would add operation and design costs. In<br />
addition to <strong>the</strong>se costs, wastewater facilities siting issues and costs would also be an issue. It<br />
might be possible to address <strong>the</strong>se comprehensively during town-wide discussions <strong>of</strong> wastewater<br />
infrastructure to meet estuary TMDLs.
Table <strong>of</strong> Contents<br />
<strong>Scargo</strong> <strong>Lake</strong> <strong>Water</strong> <strong>Quality</strong> <strong>Management</strong> <strong>Report</strong><br />
draft Final <strong>Report</strong><br />
October 2012<br />
EXECUTIVE SUMMARY ................................................................................................................. EX1<br />
I. INTRODUCTION ................................................................................................................................. 1<br />
II. SCARGO LAKE BATHYMETRY AND WATER BUDGET ........................................................ 3<br />
III. SCARGO LAKE WATER QUALITY DATA AND REVIEW ..................................................... 6<br />
III.A. DISSOLVED OXYGEN AND TEMPERATURE ...................................................................................... 9<br />
III.B. SECCHI DEPTH/TRANSPARENCY ................................................................................................... 13<br />
III.C. PHOSPHORUS ................................................................................................................................ 13<br />
III. D. NITROGEN .................................................................................................................................. 15<br />
III.E. ALKALINITY AND PH .................................................................................................................... 17<br />
III.F. CHLOROPHYLL-A AND PHAEOPHYTIN ........................................................................................... 19<br />
IV. OTHER KEY ECOSYSTEM FUNCTIONS/MEASURES .......................................................... 22<br />
IV.A. SCARGO LAKE BIRD POPULATION SURVEY .................................................................................. 22<br />
IV.B. SCARGO LAKE STORMWATER SURVEY ........................................................................................ 22<br />
IV.C. SCARGO LAKE SEDIMENT SURVEY ............................................................................................... 30<br />
IV.D. SCARGO LAKE MUSSEL SURVEY .................................................................................................. 35<br />
V. ECOLOGICAL AND REGULATORY STATUS: DATA SYNTHESIS AND<br />
NUTRIENT ASSESSMENT .................................................................................................................. 35<br />
V.A. LIMITING NUTRIENT: PHOSPHORUS MANAGEMENT IS KEY ........................................................... 35<br />
V.B. PHOSPHORUS SOURCES: BUDGET OF WATERSHED, EXTERNAL, AND INTERNAL P INPUTS ............ 37<br />
V.B.1. External Sources: Wastewater/Septic Systems Phosphorus .................................................................. 37<br />
V.B.2. External Sources: Lawn Fertilizer Phosphorus .................................................................................... 41<br />
V.B.3. O<strong>the</strong>r External Phosphorus Sources: Ro<strong>of</strong>s, Precipitation, Birds, Roads ............................................ 41<br />
V.B.4. External Sources: <strong>Water</strong>shed Phosphorus Budget ................................................................................ 42<br />
V.C. INTERNAL PHOSPHORUS INPUTS AND DISCHARGES: SEDIMENT NUTRIENT REGENERATION<br />
AND STREAM OUTFLOW ......................................................................................................................... 44<br />
V.D. OVERALL PHOSPHORUS BUDGET................................................................................................... 44<br />
V.E. OVERALL SCARGO LAKE STATUS AND DISCUSSION ...................................................................... 45<br />
VI. SUMMARY ....................................................................................................................................... 49<br />
VII. RECOMMENDED NEXT STEPS ................................................................................................ 53<br />
VII.1. BEGIN REVIEW OF DESIGN DISCUSSIONS FOR HYPOLIMNETIC AERATION .................................. 53<br />
VII.2. REVIEW POTENTIAL OPTIONS TO REDUCE WASTEWATER PHOSPHORUS SOURCES ..................... 53<br />
VII.3. CONTINUE FUTURE CITIZEN MONITORING ................................................................................. 53<br />
VII.4. INITIATE DISCUSSIONS WITH MASSDEP REGARDING TMDL GUIDANCE .................................... 53<br />
VIII. REFERENCES ............................................................................................................................. 54
List <strong>of</strong> Figures<br />
<strong>Scargo</strong> <strong>Lake</strong> <strong>Water</strong> <strong>Quality</strong> <strong>Management</strong> <strong>Report</strong><br />
draft Final <strong>Report</strong><br />
October 2012<br />
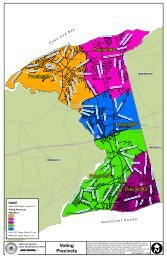
Figure I-1. Location <strong>of</strong> <strong>Scargo</strong> <strong>Lake</strong> in <strong>the</strong> <strong>Town</strong> <strong>of</strong> <strong>Dennis</strong>, MA ................................................ 2<br />
Figure II-1. <strong>Scargo</strong> <strong>Lake</strong> Bathymetry ............................................................................................ 4<br />
Figure III-1. <strong>Scargo</strong> <strong>Lake</strong> Average Monthly Temperature Pr<strong>of</strong>iles ............................................ 11<br />
Figure III-2. <strong>Scargo</strong> <strong>Lake</strong> Average Monthly Dissolved Oxygen Pr<strong>of</strong>iles ................................... 12<br />
Figure III-3. <strong>Scargo</strong> <strong>Lake</strong> Average Monthly Secchi Clarity........................................................ 14<br />
Figure III-4. <strong>Scargo</strong> <strong>Lake</strong> Average Monthly Total Phosphorus .................................................. 16<br />
Figure III-5. <strong>Scargo</strong> <strong>Lake</strong> Average Monthly Total Nitrogen ....................................................... 18<br />
Figure III-6. <strong>Scargo</strong> <strong>Lake</strong> Average August/September Pigment Concentrations ........................ 21<br />
Figure IV-1. Average Monthly Bird Counts on <strong>Scargo</strong> <strong>Lake</strong><br />
(October 10, 2010 and September 30, 2011). .................................................... 23<br />
Figure IV-2. <strong>Scargo</strong> Beach: <strong>Scargo</strong> <strong>Lake</strong> Stormwater Sampling. .............................................. 25<br />
Figure IV-3. <strong>Scargo</strong> Boat Ramp: <strong>Scargo</strong> <strong>Lake</strong> Stormwater Sampling. ...................................... 26<br />
Figure IV-4. Gretchen Way/Erb Drive/Princess Beach: <strong>Scargo</strong> <strong>Lake</strong> Stormwater Sampling. ... 27<br />
Figure IV-5. Measured 2011 Stormwater Run<strong>of</strong>f Volumes: <strong>Scargo</strong> <strong>Lake</strong>. ................................ 28<br />
Figure IV-6. Measured Stormwater Nutrient Loads (Total Phosphorus and Total Nitrogen):<br />
2011 <strong>Scargo</strong> <strong>Lake</strong>. ............................................................................................. 29<br />
Figure IV-7. <strong>Scargo</strong> <strong>Lake</strong> Sediment Core Locations. .................................................................. 31<br />
Figure IV-8. <strong>Scargo</strong> <strong>Lake</strong> Freshwater Mussel Survey. ................................................................ 36<br />
Figure V-1. Average Monthly Nitrogen to Phosphorus Ratios in <strong>Scargo</strong> <strong>Lake</strong>. ......................... 38<br />
Figure V-2. <strong>Scargo</strong> <strong>Lake</strong> Parcels within 300 ft Buffer. ............................................................... 40<br />
Figure V-3. <strong>Scargo</strong> <strong>Lake</strong> External/<strong>Water</strong>shed Phosphorus Budget. ............................................ 43<br />
Figure V-4. Potential Hypolimnetic Aeration Options. ............................................................... 48
List <strong>of</strong> Tables<br />
<strong>Scargo</strong> <strong>Lake</strong> <strong>Water</strong> <strong>Quality</strong> <strong>Management</strong> <strong>Report</strong><br />
draft Final <strong>Report</strong><br />
October 2012<br />
Table II-1. <strong>Scargo</strong> <strong>Lake</strong> <strong>Water</strong> Budget .......................................................................................... 5<br />
Table III-1. Data collection frequency for <strong>Scargo</strong> <strong>Lake</strong> (2001-2011) ........................................... 7<br />
Table III-2. Field and laboratory reporting units and detection limits for water samples analyzed<br />
at <strong>the</strong> SMAST Coastal Systems Analytical Facility Laboratory and field data<br />
parameters for PALS Snapshots .......................................................................... 7<br />
Table III-3. Laboratory methods and detection limits for pond water samples analyzed by <strong>the</strong><br />
Cape Cod National Seashore lab.......................................................................... 8<br />
Table IV-1. <strong>Scargo</strong> <strong>Lake</strong> Sediment Core Analysis. ..................................................................... 33<br />
Table V-1. <strong>Water</strong>shed/External Phosphorus Loading Factors ..................................................... 39
I. Introduction<br />
The <strong>Town</strong> <strong>of</strong> <strong>Dennis</strong> has 57 ponds that collectively occupy 275 acres; <strong>the</strong> largest and <strong>the</strong><br />
deepest <strong>of</strong> <strong>the</strong>se ponds is <strong>Scargo</strong> <strong>Lake</strong> (Figure I-1). <strong>Scargo</strong> <strong>Lake</strong> is 60 acres and 15 m deep. In<br />
order to address community concerns about <strong>the</strong>ir water quality, pond sampling strategies were<br />
developed, volunteer samplers were trained, and initial data reviews were completed working<br />
with University <strong>of</strong> Massachusetts Dartmouth School for Marine Science and Technology<br />
(SMAST) staff and o<strong>the</strong>r regional partners. Sampling <strong>of</strong> <strong>Dennis</strong> ponds by town volunteers began<br />
in 2001 and have been sustained through <strong>the</strong> Cape Cod Pond and <strong>Lake</strong> Stewards (PALS)<br />
program with sampling continuing and expanding through 2011 (Eichner and o<strong>the</strong>rs, 2003).<br />
In 2009, SMAST staff completed a review and syn<strong>the</strong>sis <strong>of</strong> <strong>the</strong> available pond sampling<br />
data at <strong>the</strong> town’s request (Eichner, 2009). This review identified water quality problems in a<br />
number <strong>of</strong> <strong>the</strong> ponds. It also included a series <strong>of</strong> recommendations for a) targeted data collection<br />
to help better define water quality management options, as well as recommendations to b)<br />
develop pond-specific management plans to facilitate discussion and ultimately achieve<br />
sustainable water quality conditions in <strong>the</strong> town’s ponds. The town, through <strong>the</strong> <strong>Water</strong> <strong>Quality</strong><br />
Advisory Committee, prioritized <strong>the</strong>se recommendations and began addressing <strong>the</strong> first<br />
recommendations in 2010.<br />
The <strong>Water</strong> <strong>Quality</strong> Advisory Committee decided to first address <strong>the</strong> targeted data<br />
collection recommended for <strong>Scargo</strong> <strong>Lake</strong>. Eichner (2009) identified three significant data needs<br />
for understanding <strong>the</strong> sources <strong>of</strong> phosphorus in <strong>the</strong> lake and providing <strong>the</strong> solid basis for a water<br />
quality management plan: 1) a characterization <strong>of</strong> <strong>the</strong> sediments and <strong>the</strong>ir contribution to lake<br />
nutrient balance (and impairment), 2) a characterization <strong>of</strong> nutrient inputs from stormwater, and<br />
3) an understanding <strong>of</strong> potential nutrient contributions by birds. These efforts were completed in<br />
2010 and 2011 and are documented in a SMAST Technical Memorandum (Eichner and Howes,<br />
2012).<br />
The second phase <strong>of</strong> recommended work for <strong>Scargo</strong> <strong>Lake</strong> was started this year: <strong>the</strong><br />
development <strong>of</strong> <strong>Scargo</strong> <strong>Lake</strong> <strong>Water</strong> <strong>Quality</strong> <strong>Management</strong> <strong>Report</strong>. This report uses <strong>the</strong> targeted<br />
data collected during <strong>the</strong> first phase and available water quality data collected since 2001 to<br />
develop a conceptual model <strong>of</strong> <strong>Scargo</strong> <strong>Lake</strong> and use this model and <strong>the</strong> collected data to review<br />
water quality management options. This report details <strong>the</strong> development <strong>of</strong> <strong>the</strong> model and review<br />
<strong>of</strong> selection options. Recommendations for targeted data collection are proceeding for o<strong>the</strong>r<br />
ponds in <strong>the</strong> <strong>Town</strong> <strong>of</strong> <strong>Dennis</strong> (Eagle Pond and Cedar Pond) and will be summarized in a separate<br />
SMAST Technical Memorandum.<br />
1
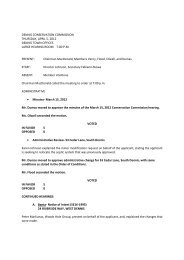
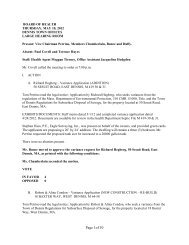
Figure I-1. Location <strong>of</strong> <strong>Scargo</strong> <strong>Lake</strong> in <strong>the</strong> <strong>Town</strong> <strong>of</strong> <strong>Dennis</strong>, MA<br />
The <strong>Town</strong> <strong>of</strong> <strong>Dennis</strong> has a total <strong>of</strong> 57 ponds, <strong>of</strong> which <strong>Scargo</strong> <strong>Lake</strong> (red box) is <strong>the</strong> largest and<br />
<strong>the</strong> deepest (Eichner and o<strong>the</strong>rs, 2003). This figure is adapted from Eichner (2009) and <strong>the</strong><br />
named ponds are those that are regularly sampled by town volunteers and <strong>the</strong> <strong>Dennis</strong> <strong>Water</strong><br />
<strong>Quality</strong> Advisory Committee.<br />
2
II. <strong>Scargo</strong> <strong>Lake</strong> Bathymetry and <strong>Water</strong> Budget<br />
A lake water budget accounts for <strong>the</strong> water entering and leaving <strong>the</strong> lake. Knowing <strong>the</strong><br />
volume <strong>of</strong> <strong>the</strong> lake, <strong>the</strong> watershed area, and streamflows <strong>of</strong> water entering or leaving <strong>the</strong> lake, <strong>the</strong><br />
flux <strong>of</strong> water can be used to calculate a residence time or <strong>the</strong> time that an average volume <strong>of</strong><br />
water remains in <strong>the</strong> lake. The water budget is also used to provide some insight into how long<br />
nutrients or pollutants remain in <strong>the</strong> lake.<br />
In order to refine <strong>the</strong> volume <strong>of</strong> <strong>Scargo</strong> <strong>Lake</strong>, CSP/SMAST staff completed <strong>the</strong><br />
bathymetric survey on June 28, 2011 (Eichner and Howes, 2012). Depth readings were<br />
sufficient to produce bathymetric contours <strong>of</strong> 5-ft intervals (Figure II-1). This contour density is<br />
an improvement over <strong>the</strong> 10-ft contour intervals previously available on <strong>the</strong> historic MADFW<br />
bathymetric map. The survey was completed using a differential GPS for positioning mounted<br />
on a boat with a survey-grade fathometer.<br />
Total volume for <strong>Scargo</strong> <strong>Lake</strong> based on <strong>the</strong> new contours is 1,563,037 m3, which is 8%<br />
larger than <strong>the</strong> volume based upon <strong>the</strong> historic MADFW bathymetric map. This result should<br />
not be surprising given that <strong>the</strong> CSP/SMAST bathymetric survey identified deeper holes north <strong>of</strong><br />
<strong>the</strong> main basin that were not identified in <strong>the</strong> MADFW bathymetric map. The larger volume<br />
increased <strong>the</strong> average depth <strong>of</strong> <strong>Scargo</strong> <strong>Lake</strong> from 6.0 m (19.7 ft) to 6.5 m (21.2 ft).<br />
In order to understand <strong>the</strong> watershed to <strong>Scargo</strong> <strong>Lake</strong>, it is important to understand its<br />
hydrogeologic setting. <strong>Scargo</strong> <strong>Lake</strong> is located in an area <strong>of</strong> <strong>Lake</strong> Deposits and <strong>Dennis</strong> Ice-<br />
Contact Deposits (Figure II-2). Most <strong>of</strong> <strong>the</strong> sou<strong>the</strong>rn shore <strong>of</strong> <strong>Scargo</strong> <strong>Lake</strong> abuts <strong>the</strong> Ice-<br />
Contact Deposits, which accumulated at <strong>the</strong> face <strong>of</strong> <strong>the</strong> continental ice sheet during <strong>the</strong><br />
Laurentide glacial stage (Oldale, 1992). These materials tend to be coarse sand and gravel with<br />
mixes <strong>of</strong> silt, clay, and till. The <strong>Lake</strong> itself is situated in <strong>Lake</strong> Deposits, which are <strong>the</strong> younger,<br />
and accumulated when <strong>the</strong> continental ice sheet was located in a relative stable location in Cape<br />
Cod Bay and a lake formed south <strong>of</strong> <strong>the</strong> ice sheet. The lake trapped sediments flowing <strong>of</strong>f <strong>the</strong><br />
face <strong>of</strong> <strong>the</strong> ice sheet. These materials tend to be fine sediments and clays.<br />
The watershed to <strong>Scargo</strong> <strong>Lake</strong> includes both geologic deposits plus portions <strong>of</strong> <strong>the</strong><br />
Harwich Outwash Plain Deposits. This watershed was recently delineated by <strong>the</strong> US Geological<br />
Survey (USGS) using <strong>the</strong>ir regional groundwater model <strong>of</strong> <strong>the</strong> Monomoy Lens (Walter and<br />
Whealan, 2005). The delineation was completed as part <strong>of</strong> <strong>the</strong> Massachusetts Estuaries Project<br />
(MEP) and will be included in <strong>the</strong> Sesuit Harbor MEP report (Howes, et al., in preparation).<br />
<strong>Water</strong>shed water entering Cape Cod kettle ponds enters <strong>the</strong> pond along <strong>the</strong> upgradient<br />
shoreline and generally discharges back to <strong>the</strong> groundwater system along <strong>the</strong> downgradient<br />
shoreline (Walter and o<strong>the</strong>rs, 2002). If <strong>the</strong>re is a stream entering or leaving <strong>the</strong> pond, it can act<br />
as a path <strong>of</strong> least resistance and will focus groundwater into <strong>the</strong> pond or pond water discharging<br />
out <strong>of</strong> <strong>the</strong> pond into <strong>the</strong> stream. There are no streams entering <strong>Scargo</strong> <strong>Lake</strong>, but <strong>the</strong>re is a stream<br />
discharging from <strong>the</strong> lake along <strong>the</strong> nor<strong>the</strong>astern edge that ultimately flows to Sesuit Harbor.<br />
The Sesuit Harbor MEP report includes monitoring <strong>of</strong> this stream and shows that <strong>the</strong> stream<br />
drains <strong>of</strong>f ~40% <strong>of</strong> <strong>the</strong> watershed flow that enters <strong>the</strong> lake, which means that <strong>the</strong> remainder <strong>of</strong><br />
<strong>the</strong> watershed flow re-enters <strong>the</strong> groundwater along <strong>the</strong> downgradient (nor<strong>the</strong>rn) shoreline <strong>of</strong> <strong>the</strong><br />
lake.<br />
3
3300<br />
3355<br />
55<br />
1100<br />
2200<br />
3300<br />
1155<br />
2255<br />
3300<br />
3355<br />
4400<br />
4455<br />
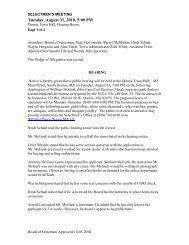
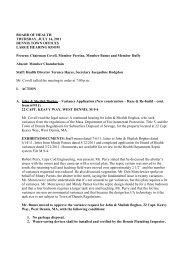
Figure II-1. <strong>Scargo</strong> <strong>Lake</strong> Bathymetry<br />
Bathymetry developed by SMAST/CSP personnel on June 28, 2011 using a differential GPS for<br />
positioning mounted on a boat with a survey-grade fathometer. Total volume is 1,563,037 m3,<br />
which is 8% larger than <strong>the</strong> volume based upon <strong>the</strong> historic MADFW bathymetric map.<br />
4
Collectively, <strong>the</strong> watershed and flow information provides <strong>the</strong> basis for a water budget<br />
for <strong>Scargo</strong> <strong>Lake</strong>. A pond water budget summarizes all <strong>the</strong> water inputs and outputs. Although<br />
pond volumes may fluctuate on longer time scales (e.g., years), <strong>the</strong> volume <strong>of</strong> ponds are<br />
relatively stable, so inputs and outputs should balance. Shorter term events, such as high volume<br />
rainstorms, can temporarily change <strong>the</strong> volume, but <strong>the</strong>se changes are quickly assimilated by <strong>the</strong><br />
aquifer and have little impact on an annual water budget (e.g., Eichner and o<strong>the</strong>rs, 1998). Table<br />
II-1 shows <strong>the</strong> <strong>Scargo</strong> <strong>Lake</strong> water budget, which can be represented as:<br />
Groundwater in + Precipitation = Groundwater out + streamflow out + evaporation<br />
Table II-1. <strong>Scargo</strong> <strong>Lake</strong> <strong>Water</strong> Budget<br />
Groundwater<br />
<strong>Water</strong> Surface<br />
Precipitation<br />
<strong>Water</strong><br />
Surface<br />
Evaporation<br />
Streamflow<br />
TOTAL<br />
m3/yr m3/yr m3/yr m3/yr m3/yr<br />
<strong>Water</strong> In 553,306 272,226 825,532<br />
<strong>Water</strong> Out 320,495 174,347 330,690 825,532<br />
Balance + 232,811 +272,226 -174,347 -330,690 0<br />
This water budget is an update on <strong>the</strong> budget included in Eichner (2009) due to<br />
information developed during this project. The 2009 budget included water inputs from<br />
projected run<strong>of</strong>f from roads within a 300 ft buffer along <strong>the</strong> downgradient side <strong>of</strong> <strong>the</strong> lake and<br />
did not include <strong>the</strong> stream outflow information. The stormwater evaluation completed under this<br />
project showed that <strong>the</strong> only significant stormwater input along <strong>the</strong> downgradient side <strong>of</strong> <strong>the</strong> lake<br />
is <strong>the</strong> <strong>Scargo</strong> <strong>Lake</strong> boat ramp <strong>of</strong>f Route 6A (see Section XXX). Fur<strong>the</strong>r, staff observations<br />
during a significant storm event showed that <strong>the</strong>re was little or no flow from Route 6A on to <strong>the</strong><br />
boat ramp; <strong>the</strong> run<strong>of</strong>f was generated within <strong>the</strong> boat ramp. For this reason, <strong>the</strong> road run<strong>of</strong>f on <strong>the</strong><br />
downgradient side <strong>of</strong> <strong>Scargo</strong> <strong>Lake</strong> is excluded from <strong>the</strong> revised water budget completed for this<br />
project. The MEP streamflow information was developed following <strong>the</strong> release <strong>of</strong> <strong>the</strong> 2009<br />
budget, but is also included here.<br />
Once <strong>the</strong> water budget is completed, this information can be combined with <strong>the</strong> volume<br />
information to develop a water residence time. A residence time is <strong>the</strong> average length <strong>of</strong> time a<br />
given volume <strong>of</strong> water remains in <strong>the</strong> lake and is important for understanding <strong>the</strong> water quality<br />
data. Eichner (2009) reported a residence time <strong>of</strong> 2.2 years. With <strong>the</strong> revision in this report to<br />
<strong>the</strong> pond volume and <strong>the</strong> clarification in <strong>the</strong> streamflow, <strong>the</strong> residence time <strong>of</strong> water in <strong>Scargo</strong><br />
<strong>Lake</strong> is 2.4 years.<br />
5
III. <strong>Scargo</strong> <strong>Lake</strong> <strong>Water</strong> <strong>Quality</strong> Data and Review<br />
In 2001, <strong>Dennis</strong> volunteers were trained using <strong>the</strong> Cape Cod Pond and <strong>Lake</strong> Stewards<br />
(PALS) sampling protocol and sampled 11 <strong>Dennis</strong> ponds. This same sampling protocol,<br />
including both field data collection and water quality samples, has been used by sampling<br />
volunteers for each subsequent PALS Snapshot through 2011 with data collection in <strong>Scargo</strong><br />
<strong>Lake</strong> generally in August. Non-Snapshot sampling has sometimes followed <strong>the</strong> PALS protocol,<br />
but on occasion has been limited to only field data collection or collection <strong>of</strong> water samples as<br />
more limited number <strong>of</strong> depths. Very refined sampling <strong>of</strong> <strong>Scargo</strong> <strong>Lake</strong> was completed by<br />
SMAST staff for this project during 2010 with water samples generally collected at each meter<br />
<strong>of</strong> depth. All <strong>Scargo</strong> <strong>Lake</strong> PALS Snapshot water quality samples and non-Snapshot samples in<br />
2007, 2008, 2010, and 2011 have been analyzed by <strong>the</strong> Coastal Systems Program Laboratory,<br />
School for Marine Science and Technology (SMAST), University <strong>of</strong> Massachusetts Dartmouth.<br />
Table III-1 shows <strong>the</strong> frequency <strong>of</strong> field data collection in <strong>Scargo</strong> <strong>Lake</strong> between 2001 and 2011.<br />
Most <strong>of</strong> <strong>the</strong> water quality samples collected from <strong>Scargo</strong> <strong>Lake</strong> have been collected in August and<br />
September with most <strong>of</strong> <strong>the</strong>se related to PALS sampling.<br />
The SMAST lab analysis and sample handling procedures are described in <strong>the</strong> SMAST<br />
Coastal Systems Analytical Facility Laboratory <strong>Quality</strong> Assurance Plan (2003), which is<br />
approved by <strong>the</strong> Massachusetts Department <strong>of</strong> Environmental Protection. These procedures,<br />
which are used for all PALS Snapshot samples and <strong>Dennis</strong> samples analyzed at <strong>the</strong> SMAST lab,<br />
include <strong>the</strong> following parameters: total nitrogen, total phosphorus, chlorophyll-a, pH, and<br />
alkalinity. Detection limits for SMAST laboratory analytes and field data collection are listed in<br />
Table III-2. Two sampling runs in 2002 and six during <strong>the</strong> summer <strong>of</strong> 2003 were analyzed at<br />
<strong>the</strong> North Atlantic Coastal Laboratory at Cape Cod National Seashore (CCNS); CCNS lab<br />
procedures are listed in Table III-3. The September, October, and November 2010 water quality<br />
sampling runs completed by SMAST staff included water quality samples collected at 1 m<br />
increments.<br />
The PALS pond water sampling protocol calls for a shallow (0.5 m) sample and <strong>the</strong>n<br />
generally a deep sample 1 m <strong>of</strong>f <strong>the</strong> bottom for all ponds <strong>of</strong> 9 m total depth or less; ponds less<br />
than 1.5 m should have two samples from <strong>the</strong> surface collected. Ponds that are deeper than 5 m<br />
will have a third sample collected at 3 m (i.e., 0.5 m, 3 m, and one meter <strong>of</strong>f <strong>the</strong> bottom) and<br />
ponds greater than 10 m will have a fourth sample collected at 9 m (i.e., 0.5 m, 3 m, 9 m, and<br />
one meter <strong>of</strong>f <strong>the</strong> bottom). Samples are collected as whole water, stored at 4°C, and transferred<br />
to <strong>the</strong> SMAST lab within 24 hours. Field sampling procedures under <strong>the</strong> PALS Snapshot<br />
protocol include water column pr<strong>of</strong>ile measurements (every meter) <strong>of</strong> dissolved oxygen and<br />
temperature, Secchi disk transparency, and a measure <strong>of</strong> station depth. The PALS Snapshots<br />
have been supported by free laboratory analyses from <strong>the</strong> SMAST Coastal Systems Analytical<br />
Facility Laboratory for 11 years and are coordinated in conjunction with <strong>the</strong> Cape Cod<br />
Commission.<br />
6
Table III-1. Data collection frequency for <strong>Scargo</strong> <strong>Lake</strong> (2001-2011)<br />
Year Jan Feb Mar Apr May Jun Jul Aug Sep Oct Nov Dec<br />
2001 X<br />
2002 X X<br />
2003 X X X X X X X<br />
2004 X X X X X X<br />
2005 X X X X X X<br />
2006 X X X X<br />
2007 X X X X X X X<br />
2008 X X X X X X X<br />
2009 X<br />
2010 X X X X X<br />
2011 X X<br />
KEY<br />
X<br />
X<br />
X<br />
Complete PALS protocol followed, including water quality samples collected at<br />
surface (0.5 m, 3 m, 9 m, and 1 m <strong>of</strong>f <strong>the</strong> bottom), field data collection <strong>of</strong> dissolved<br />
oxygen and temperature pr<strong>of</strong>iles (1 m increments) and Secchi transparency, and<br />
samples analyzed for total nitrogen, total phosphorus, chlorophyll-a, pH, and<br />
alkalinity and<br />
Lab samples & field data collected (only surface and deep samples collected)<br />
Some field data collected<br />
Note: Laboratory analyses were completed by <strong>the</strong> Coastal Systems Program Laboratory, School <strong>of</strong> Marine Science<br />
and Technology (SMAST), University <strong>of</strong> Massachusetts Dartmouth or <strong>the</strong> North Atlantic Coastal Laboratory at<br />
Cape Cod National Seashore (CCNS).<br />
Table III-2. Field and laboratory reporting units and detection limits for water<br />
samples analyzed at <strong>the</strong> SMAST Coastal Systems Analytical Facility Laboratory<br />
and field data parameters for PALS Snapshots<br />
Parameter <strong>Report</strong>ing Detection<br />
Units Limit<br />
Accuracy (+\-)<br />
PALS Field Measurements<br />
Temperature ºC 0.5°C ± 0.3 ºC -5 to 45<br />
Dissolved Oxygen mg/l 0.5<br />
± 0.3 mg/l or ± 2% <strong>of</strong> reading,<br />
whichever is greater<br />
0 – 20<br />
Measurement<br />
Range<br />
Secchi Disk <strong>Water</strong><br />
Clarity<br />
meters NA 20 cm Disappearance<br />
Laboratory Measurements –<br />
School <strong>of</strong> Marine Science and Technology, University <strong>of</strong> Massachusetts Dartmouth<br />
Alkalinity mg/l as CaCO 3 0.5 80-120% Std. Value NA<br />
Chlorophyll-a µg/l 0.05 80-120% Std. Value 0-145<br />
Nitrogen, Total µM 0.05 80-120% Std. Value NA<br />
pH Standard Units NA 80-120% Std. Value 0 - 14<br />
Phosphorus, Total µM 0.1 80-120% Std. Value NA<br />
Note: All laboratory measurement information from SMAST Coastal Systems Analytical<br />
Facility Laboratory <strong>Quality</strong> Assurance Plan (January, 2003)<br />
7
Table III-3. Laboratory methods and detection limits for pond water samples<br />
analyzed by <strong>the</strong> Cape Cod National Seashore lab.<br />
Parameter Unit Range MDL Method Matrix Ref<br />
Dissolved Ammonium µg/L 4 to 400 4<br />
Dissolved<br />
Orthophosphate<br />
Dissolved<br />
Nitrate/Nitrite<br />
µg/L 0.62 to 310 0.62<br />
µg/L 1.68 to 700 1.68<br />
Lachat QC FIA+ 8000 Method #10-107-06-1-C<br />
(Diamond, D., & Switala, K., 9 October 2000<br />
Revision)<br />
Lachat QC FIA+ 8000 Method #31-115-01-1-G<br />
(Diamond, D., 30 December 1998 Revision)<br />
Lachat QC FIA+ 8000 Method #31-107-04-1-C<br />
(Diamond, D., 27 June 2000 Revision)<br />
waters<br />
(Salinity=0 to 35 ppt)<br />
(field filtered and<br />
acidified<br />
waters<br />
(Salinity=0 to 35 ppt)<br />
(field filtered and<br />
acidified<br />
waters<br />
(Salinity=0 to 35 ppt)<br />
(field filtered and<br />
acidified<br />
A<br />
B<br />
C<br />
total phosphoruspersulfate<br />
digestions µg/L 1 to 200 1 Lachat QC FIA+ 8000 Method #10-115-01-1-F<br />
(Diamond, D., 14 October 1994 Revision)<br />
TP/TN-persulfate digestions (simultaneous<br />
Total phosphorus µg/L 0.62 to 310 0.62 Lachat QC FIA+ 8000 Method #31-115-01-1-G<br />
Total nitrogen µg/L 1.68 to 700 1.68 Lachat QC FIA+ 8000 Method #31-107-04-1-C<br />
waters<br />
(Salinity=0 to 35 ppt)<br />
waters<br />
(Salinity=0 to 35 ppt)<br />
D<br />
E<br />
Particulate<br />
Carbon/Nitrogen<br />
Chlorophyll-a &<br />
Pheopigments<br />
µg/L<br />
µg/L<br />
CarloErba CHNS Elemental Analyzer (Beach,<br />
R., MERL Manual, 1986)<br />
90% Acetone Extraction (Godfrey, P., et al.<br />
1999)<br />
waters<br />
waters<br />
F<br />
G<br />
References<br />
A. US EPA, Methods for Chemical Analysis <strong>of</strong> <strong>Water</strong> and Wastes, EPA-600/4-79-020, Revised March 1983, Method 350.1<br />
B. Murphy, J. and J.P. Riley. 1962. A Modified Single Solution Method for <strong>the</strong> Determination <strong>of</strong> Phosphate in Natural <strong>Water</strong>s.<br />
Anal. Chim. Acta., 27: 31-36.<br />
C. Zimmerman, C.F. et al., EPA Method 353.4, Determination <strong>of</strong> Nitrate+Nitrite in estuarine and Coastal <strong>Water</strong>s by Automated<br />
Colorimetric Analysis in An Interim Manual <strong>of</strong> Methods for <strong>the</strong> Determination <strong>of</strong> Nutrients in Estuarine and Coastal <strong>Water</strong>s.,<br />
Revision 1.1, June 1991.<br />
D. US EPA, Methods for Chemical Analysis <strong>of</strong> <strong>Water</strong> and Wastes, EPA-600/4-79-020, Revised March 1983, Method 365.1<br />
E. Valderrama. 1981. The Simultaneous Analysis <strong>of</strong> Total Nitrogen and Total Phosphorus in Natural <strong>Water</strong>s. Marine<br />
Chemistry, 10:109-122.<br />
F. Beach. 1986. Total Carbon and Nitrogen in Filtered Particulate Matter. Manual <strong>of</strong> Biological and Geochemical Techniques<br />
in Coastal Areas, MERL Series, <strong>Report</strong> No. 1, University <strong>of</strong> Rhode Island, Kingston, R.I.<br />
G. Godfrey, P.J. and P. Kerr. 1999. A new method <strong>of</strong> preserving Chlorophyll on Glass Fiber Filters for use by Pr<strong>of</strong>essional<br />
<strong>Lake</strong> Managers and Volunteer Monitors. Submitted to <strong>Lake</strong> and Reserv. Manage. UMASS-Amherst, Massachusetts <strong>Water</strong><br />
Resources Research Center/<br />
Note: Information provided by Krista Lee, CCNS (personal communication, 2002). MDL =<br />
method detection limit.<br />
8
III.A. Dissolved Oxygen and Temperature<br />
Pond and lake ecosystems are controlled by interactions among <strong>the</strong> physical, chemical,<br />
and biological factors within a given lake. The availability <strong>of</strong> oxygen determines distributions <strong>of</strong><br />
various species living within a lake; some species require higher concentrations, while o<strong>the</strong>rs are<br />
more tolerant <strong>of</strong> occasional low oxygen concentrations. Oxygen concentrations also determine<br />
<strong>the</strong> solubility <strong>of</strong> many inorganic elements; higher concentrations <strong>of</strong> phosphorus, nitrogen, and<br />
iron, among o<strong>the</strong>r constituents, can occur in <strong>the</strong> deeper portions <strong>of</strong> ponds when anoxic conditions<br />
convert bound, solid forms in <strong>the</strong> sediments into soluble forms that are <strong>the</strong>n released into <strong>the</strong><br />
water column. Temperature is inversely related to dissolved oxygen concentrations (i.e., higher<br />
temperature water holds less dissolved oxygen).<br />
Oxygen concentrations are also related to <strong>the</strong> amount <strong>of</strong> biological activity in a pond.<br />
Since one <strong>of</strong> <strong>the</strong> main byproducts <strong>of</strong> photosyn<strong>the</strong>sis is oxygen, a vigorous algal population can<br />
produce DO concentrations that are greater than <strong>the</strong> concentrations that would be expected based<br />
simply on temperature interactions alone. These instances <strong>of</strong> “supersaturation” usually occur in<br />
lakes with high nutrient concentrations, since <strong>the</strong> algal population would need readily available<br />
nutrients in order to produce <strong>the</strong>se conditions. Conversely, as <strong>the</strong> algal populations die, <strong>the</strong>y fall<br />
to <strong>the</strong> sediments where bacterial populations consume oxygen as <strong>the</strong>y degrade <strong>the</strong> dead algae.<br />
Too much algal growth can thus lead to anoxic conditions and <strong>the</strong> release <strong>of</strong> recycled nutrients<br />
back into <strong>the</strong> pond from <strong>the</strong> sediments potentially leading to more algal growth.<br />
Shallow Cape Cod ponds, which are generally defined as less than 9 meters (29.5 ft)<br />
deep, tend to have well mixed water columns because ordinary winds blowing across <strong>the</strong> Cape<br />
have sufficient energy to circulate water within a pond and move deeper waters up to <strong>the</strong> surface.<br />
In <strong>the</strong>se ponds, both temperature and dissolved oxygen readings tend to be relatively constant<br />
from surface to bottom.<br />
In deeper Cape Cod ponds, like <strong>Scargo</strong> <strong>Lake</strong>, mixing <strong>of</strong> <strong>the</strong> water column tends to occur<br />
throughout <strong>the</strong> winter, but rising temperatures in <strong>the</strong> spring heat upper waters more rapidly than<br />
winds can mix <strong>the</strong> heat throughout <strong>the</strong> water column. This leads to stratification <strong>of</strong> <strong>the</strong> water<br />
column with warmer, upper waters continuing to be mixed and warmed throughout <strong>the</strong> summer<br />
and <strong>the</strong> isolation <strong>of</strong> cooler, deeper waters. The upper layer is called <strong>the</strong> epilimnion, while <strong>the</strong><br />
lower layer is called <strong>the</strong> hypolimnion; <strong>the</strong> transitional zone between <strong>the</strong>m is called <strong>the</strong><br />
metalimnion.<br />
Once <strong>the</strong> lower layer in a stratified pond is cut <strong>of</strong>f from <strong>the</strong> atmosphere by <strong>the</strong><br />
epilimnion, <strong>the</strong>re is no mechanism to replenish oxygen consumed by sediment bacterial<br />
populations. These populations respire (consume oxygen and produce carbon dioxide) as <strong>the</strong>y<br />
consume organic matter (e.g., algae/phytoplankton, fish) that has sunk to <strong>the</strong> bottom. If <strong>the</strong>re is<br />
extensive organic matter falling to <strong>the</strong> sediments, as one would expect with lakes with higher<br />
amounts <strong>of</strong> nutrients, <strong>the</strong> bacterial respiration can consume all <strong>of</strong> <strong>the</strong> oxygen before <strong>the</strong> lake<br />
mixes throughout <strong>the</strong> water column again in <strong>the</strong> fall. <strong>Scargo</strong> has low oxygen or anoxic<br />
conditions in its deepest layer.<br />
State surface water regulations (314 CMR 4) have numeric standards for dissolved<br />
oxygen and temperature, as well as pH, with descriptive standards for general water quality<br />
9
conditions. Under <strong>the</strong> numeric standards in <strong>the</strong>se regulations, deep ponds, like <strong>Scargo</strong> <strong>Lake</strong> that<br />
are not drinking water supplies are required to have a dissolved oxygen concentration <strong>of</strong> not less<br />
than 6.0 mg/l (or 6 ppm). These regulations also require that deep lakes have temperatures that do<br />
not exceed 68 0 F (20 0 C). Any waters failing to meet <strong>the</strong> numeric standards in <strong>the</strong> state surface<br />
water regulations are defined as “impaired” for <strong>the</strong> purposes <strong>of</strong> federal Clean <strong>Water</strong> Act<br />
compliance and all impaired waters are required by <strong>the</strong> Act to have a Total Maximum Daily<br />
Load (TMDL) established for <strong>the</strong> contaminant that is creating <strong>the</strong> impairment. TMDLs usually<br />
are expressed as a concentration limit or threshold. Under <strong>the</strong> Clean <strong>Water</strong> Act, states are<br />
required to create implementation plans to meet TMDLs; Massachusetts DEP guidance to date<br />
has focused on having community-based comprehensive wastewater management plans include<br />
provisions to ensure that waters meet TMDLs.<br />
The occurrence <strong>of</strong> dissolved oxygen concentrations less than <strong>the</strong> Massachusetts surface<br />
water regulatory thresholds can have pr<strong>of</strong>ound impacts on fish and o<strong>the</strong>r animals in a pond<br />
ecosystem if <strong>the</strong>y occur even once. Studies <strong>of</strong> fish populations have shown decreased diversity,<br />
totals, fecundity, and survival at low dissolved oxygen concentrations (e.g., Killgore and Hoover,<br />
2001; Fontenot and o<strong>the</strong>rs, 2001, Thurston and o<strong>the</strong>rs, 1981; Elliot, 2000). Dissolved oxygen<br />
concentrations <strong>of</strong> less than 1 ppm are generally lethal, even on a temporary basis, for most<br />
species (Wetzel, 1983; Mat<strong>the</strong>ws and Berg, 1997).<br />
<strong>Scargo</strong> <strong>Lake</strong> has had 44 temperature and dissolved oxygen pr<strong>of</strong>iles collected since 2001.<br />
All <strong>of</strong> <strong>the</strong>se pr<strong>of</strong>iles occurred between April and November with between 3 (November) and 8<br />
(August) monthly pr<strong>of</strong>iles. Average temperature readings show a typical seasonal pattern <strong>of</strong><br />
deep lakes with fairly consistent water column temperatures in April, increasingly warm surface<br />
temperatures as <strong>the</strong> summer progresses and a gradual return to fairly consistent water column<br />
temperatures in November (Figure III-1). July and August temperatures have <strong>the</strong> greatest<br />
differences between surface and bottom temperatures consistent with summer stratification or<br />
layering with warm surface waters covering cold bottom waters. Maximum summer surface<br />
temperature in <strong>the</strong> available data was 27.9°C (6/23/08), while <strong>the</strong> lowest summer bottom<br />
temperature was 8.6°C (6/16/06 @ 13 m). As would be expected, surface temperatures have <strong>the</strong><br />
widest range (27.9 to 9.6°C @ 0.5 m), while <strong>the</strong> range <strong>of</strong> deep temperatures is more limited (12.4<br />
to 7.4 °C @ 13.5 m).<br />
Average dissolved oxygen concentrations show an impact <strong>of</strong> sediment oxygen demand<br />
throughout <strong>the</strong> April to November timeframe with <strong>the</strong> greatest demand in August and September<br />
(Figure III-2). As <strong>the</strong> summer progresses, surface dissolved oxygen concentrations decrease as<br />
temperatures increases; average April surface dissolved oxygen concentration is 11 mg/L, while<br />
average August concentration is 7.2 mg/L. Average dissolved oxygen concentrations less than<br />
<strong>the</strong> state 6 mg/L regulatory limit are <strong>the</strong> shallowest in August (7 m depth); this depth means <strong>the</strong><br />
entire hypolimnion (or <strong>the</strong> cold water fishery) is below <strong>the</strong> state 6 mg/L standard. At this depth,<br />
it also means that low oxygen conditions and higher phosphorus concentrations that typically<br />
accompany <strong>the</strong>m are regularly bleeding through into <strong>the</strong> warmer upper layers. From May to<br />
September for <strong>the</strong> 11 year period between 2001 and 2011, 100% <strong>of</strong> <strong>the</strong> dissolved oxygen<br />
concentrations at 10 meters and deeper are less than <strong>the</strong> 6 mg/L state standard with 100% <strong>of</strong> <strong>the</strong><br />
concentrations at 8 meters, or to <strong>the</strong> top <strong>of</strong> hypolimnion, less than <strong>the</strong> standard in August.<br />
10
30<br />
25<br />
Temperature (°C)<br />
20<br />
15<br />
10<br />
Apr<br />
May<br />
Jun<br />
Jul<br />
Aug<br />
Sep<br />
Oct<br />
Nov<br />
5<br />
0<br />
0 1 2 3 4 5 6 7 8 9 10 11 12 13 14 15<br />
Depth (m)<br />
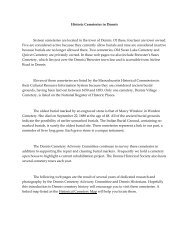
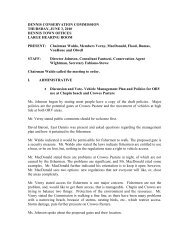
Figure III-1. <strong>Scargo</strong> <strong>Lake</strong> Average Monthly Temperature Pr<strong>of</strong>iles<br />
Pr<strong>of</strong>iles are based on readings collected between 2001 and 2011. Average April readings show initial warming <strong>of</strong> upper waters<br />
followed by more warming in each subsequent month until September when temperatures cool from August eventually returning to<br />
<strong>the</strong> same temperature throughout <strong>the</strong> water column in November. Surface temperatures vary from 11 to 25°C, while bottom<br />
temperatures vary from 7.7 to 12.2°C.<br />
11
15<br />
14<br />
13<br />
12<br />
11<br />
Dissolved Oxygen (mg/l)<br />
10<br />
9<br />
8<br />
7<br />
6<br />
5<br />
4<br />
3<br />
2<br />
DEP Limit for<br />
Cold <strong>Water</strong><br />
<strong>Lake</strong>s<br />
Apr<br />
May<br />
Jun<br />
Jul<br />
Aug<br />
Sep<br />
Oct<br />
Nov<br />
1<br />
0<br />
0 1 2 3 4 5 6 7 8 9 10 11 12 13 14 15<br />
Depth (m)<br />
Figure III-2. <strong>Scargo</strong> <strong>Lake</strong> Average Monthly Dissolved Oxygen Pr<strong>of</strong>iles<br />
Pr<strong>of</strong>iles are based on readings collected between 2001 and 2011. Average April readings show initial sediment oxygen demand<br />
reducing oxygen concentrations in <strong>the</strong> near-sediment waters. These conditions worsen and rise higher in <strong>the</strong> water column in each<br />
subsequent month, leading to anoxia in bottom waters beginning in June and persisting through September. The breakdown <strong>of</strong><br />
stratification in October gradually resupplies oxygen to <strong>the</strong> deeper waters and leads to well-mixed conditions in November.<br />
12
The majority <strong>of</strong> phosphorus release from sediments occurs when anoxic conditions are<br />
establish (DO
0.0<br />
Apr May Jun Jul Aug Sep Oct Nov<br />
50%<br />
1.0<br />
2.0<br />
45%<br />
3.0<br />
40%<br />
4.0<br />
5.0<br />
35%<br />
Average Depth (m)<br />
6.0<br />
7.0<br />
8.0<br />
9.0<br />
10.0<br />
11.0<br />
12.0<br />
13.0<br />
station depth<br />
secchi depth<br />
%<br />
30%<br />
25%<br />
20%<br />
15%<br />
10%<br />
Average % Secchi<br />
14.0<br />
5%<br />
15.0<br />
Figure III-3. <strong>Scargo</strong> <strong>Lake</strong> Average Monthly Secchi Clarity<br />
48 Secchi readings were collected between 2001 and 2011. The red line shows <strong>the</strong> average monthly Secchi depth reading, while <strong>the</strong><br />
blue line shows <strong>the</strong> average station depth. The green line shows <strong>the</strong> average % <strong>of</strong> <strong>the</strong> water column that is clear; this reading and <strong>the</strong><br />
average Secchi depth peaks in May <strong>the</strong>n declines throughout <strong>the</strong> rest <strong>of</strong> <strong>the</strong> dataset until November. Review <strong>of</strong> all Secchi readings<br />
show no trend over <strong>the</strong> dataset.<br />
0%<br />
14
Most Cape Cod lakes have relatively low phosphorus concentrations due to <strong>the</strong> lack <strong>of</strong><br />
phosphorus in <strong>the</strong> surrounding glacially-derived sands; most <strong>of</strong> <strong>the</strong> phosphorus in Cape Cod<br />
ponds is due to current additions from <strong>the</strong> watershed and regeneration <strong>of</strong> past watershed<br />
additions from <strong>the</strong> pond sediments. Since phosphorus moves very slowly in sandy aquifers<br />
(0.01-0.02 ft/d; Robertson, 2008), most <strong>of</strong> <strong>the</strong> sources <strong>of</strong> phosphorus entering Cape Cod ponds is<br />
from properties abutting <strong>the</strong> pond shoreline. Previous analysis <strong>of</strong> phosphorus loading to Cape<br />
Cod ponds have focused on properties within 250 to 300 ft <strong>of</strong> <strong>the</strong> shoreline (e.g., Eichner and<br />
o<strong>the</strong>rs, 2006; Eichner, 2007; Eichner, 2008).<br />
The median surface concentration <strong>of</strong> TP in 175 Cape Cod ponds sampled during <strong>the</strong> 2001<br />
Pond and <strong>Lake</strong> Stewards (PALS) Snapshot was 16 µg/l (Eichner and o<strong>the</strong>rs, 2003). Using <strong>the</strong><br />
US Environmental Protection Agency (2000) method for determining a nutrient threshold criteria<br />
and <strong>the</strong> 2001 PALS Snapshot data, <strong>the</strong> Cape Cod Commission determined that “healthy” pond<br />
ecosystems on Cape Cod should have a surface TP concentration no higher than 10 µg/l, while<br />
“unimpacted” ponds should have a surface TP concentration no higher than 7.5 µg/l (Eichner and<br />
o<strong>the</strong>rs, 2003). Use <strong>of</strong> this EPA method suggests that healthy freshwater pond ecosystems on<br />
Cape Cod should have average TP concentrations between 7.5 to 10 µg/l.<br />
Average late summer surface TP concentrations in <strong>Scargo</strong> <strong>Lake</strong> are 11.3 µg/l (August<br />
and September), while <strong>the</strong> deepest sampling station averages 22.9 µg/l. This difference is<br />
consistent with low dissolved oxygen creating conditions favoring phosphorus regeneration from<br />
<strong>the</strong> sediments. Average concentrations at 3 and 9 m depths are similar to <strong>the</strong> surface water<br />
averages (9.3 and 10.3 µg/l, respectively), which means that, on average, summer conditions do<br />
not allow regenerated TP from <strong>the</strong> deepest sediments to significantly impact <strong>the</strong> upper waters<br />
although low oxygen waters do occasionally reach <strong>the</strong> 9 m depth. These concentrations are<br />
consistent with <strong>the</strong> oxygen pr<strong>of</strong>ile readings, which generally show at least residual oxygen in<br />
water between <strong>the</strong> anoxic bottom waters and <strong>the</strong> warmer epilimnion. April average<br />
concentrations are not statistically different from those in summer except for <strong>the</strong> deepest<br />
samples, which are significantly higher in late summer (ρ
30<br />
Average Monthly Total Phosphorus (µg/L)<br />
25<br />
20<br />
15<br />
10<br />
5<br />
April<br />
August<br />
September<br />
October<br />
0<br />
0.5 3 9 12 12.96<br />
Station Depth (m)<br />
Figure III-4. <strong>Scargo</strong> <strong>Lake</strong> Average Monthly Total Phosphorus<br />
Readings are shown for April, August, September and October. Average concentrations at 0.5, 3, and 9 m depths are relatively<br />
consistent in all months. Deeper readings increase during August and are generally sustained through October. All summer averages<br />
are greater than <strong>the</strong> 7.5 to 10 µg/L limit recommended for Cape Cod ponds (Eichner and o<strong>the</strong>rs, 2003). Station depths are based on<br />
standard PALS protocols; <strong>the</strong> deepest reading is based on <strong>the</strong> overall average depth <strong>of</strong> one meter <strong>of</strong>f <strong>the</strong> bottom. All averages are<br />
based on a minimum <strong>of</strong> two readings. April averages are based on 2-3 readings, while August and September averages are based on<br />
3-7 readings. October readings at <strong>the</strong> 0.5 m and 12.96 m depths are based on 3 readings.<br />
16
Nitrogen is a primary pollutant associated with wastewater. Septic systems, <strong>the</strong><br />
predominant wastewater treatment technology on Cape Cod, generally introduce treated effluent<br />
to <strong>the</strong> groundwater with nitrogen concentrations between 20 and 40 ppm: Massachusetts<br />
Estuaries Project watershed nitrogen loading analyses use 26.25 ppm as an effective TN<br />
concentration for septic system wastewater (e.g., Howes and o<strong>the</strong>rs, 2004). Nitrogen also tends<br />
to move rapidly through <strong>the</strong> aquifer system, traveling in its fully oxidized nitrate form with<br />
groundwater at average rate <strong>of</strong> one foot per day.<br />
Because <strong>of</strong> <strong>the</strong>se chemical and hydrologic characteristics, as well as <strong>the</strong> predominant use<br />
<strong>of</strong> septic systems for wastewater treatment, Cape Cod ponds and lakes tend to have relatively<br />
high concentrations <strong>of</strong> nitrogen; <strong>the</strong> 184 ponds sampled during <strong>the</strong> 2001 PALS Snapshot had an<br />
average surface water TN concentration <strong>of</strong> 0.58 ppm. Review <strong>of</strong> <strong>the</strong>se sampling results<br />
established that unimpacted Cape Cod ponds have concentration limit <strong>of</strong> 0.16 ppm, while <strong>the</strong><br />
“healthy” threshold concentration is 0.31 ppm (Eichner and o<strong>the</strong>rs, 2003).<br />
August and September averages show that average summer surface TN concentrations in<br />
<strong>Scargo</strong> <strong>Lake</strong> are 0.33 mg/l, while <strong>the</strong> deepest sampling station averages 0.96 mg/l. Average<br />
concentrations at 3 and 9 m depths are similar to <strong>the</strong> surface water averages (0.36 and 0.37 mg/l,<br />
respectively). These concentration differences are consistent with low dissolved oxygen creating<br />
conditions favoring nitrogen regeneration from <strong>the</strong> sediments and are consistent with <strong>the</strong> pattern<br />
seen in <strong>the</strong> TP readings that show that <strong>the</strong> high concentrations in <strong>the</strong> deep water do not seem to<br />
be impacting <strong>the</strong> upper, shallow waters. Samples in April at not statistically different from those<br />
in August/September except for <strong>the</strong> deepest samples, which are significantly higher in<br />
August/September (ρ
1.0<br />
Average Monthly Total Nitrogen (mg/L)<br />
0.9<br />
0.8<br />
0.7<br />
0.6<br />
0.5<br />
0.4<br />
0.3<br />
0.2<br />
0.1<br />
April<br />
August<br />
September<br />
October<br />
0.0<br />
0.5 3 9 12 12.96<br />
Station Depth (m)<br />
Figure III-5. <strong>Scargo</strong> <strong>Lake</strong> Average Monthly Total Nitrogen<br />
Readings are shown for April, August, September and October. Average concentrations at 0.5, 3, and 9 m depths are relatively<br />
consistent in all months. Deeper readings increase during August and are generally sustained through October. All summer averages<br />
are greater than <strong>the</strong> 0.16 to 0.31 mg/L limit recommended for Cape Cod ponds (Eichner and o<strong>the</strong>rs, 2003). Station depths are based<br />
on standard PALS protocols; <strong>the</strong> deepest reading is based on <strong>the</strong> overall average depth <strong>of</strong> one meter <strong>of</strong>f <strong>the</strong> bottom. All averages are<br />
based on a minimum <strong>of</strong> two readings. April averages are based on 2-3 readings, while August and September averages are based on<br />
3-7 readings. October readings at <strong>the</strong> 0.5 m and 12.96 m depths are based on 3 readings.<br />
18
shows pH between 6 and 6.5; Frimpter and Gay (1979) sampled groundwater from 202 wells on<br />
Cape Cod and found a median pH <strong>of</strong> 6.1. As might be expected because <strong>of</strong> <strong>the</strong>ir interconnection<br />
with <strong>the</strong> surrounding aquifer, Cape Cod ponds tend to have pH readings close to <strong>the</strong> groundwater<br />
average with ponds least impacted by development having pH’s closest to <strong>the</strong> low rain pH. The<br />
average surface pH <strong>of</strong> 193 ponds sampled in <strong>the</strong> 2001 PALS Snapshot is 6.16 with a range <strong>of</strong><br />
4.38 to 8.92, while <strong>the</strong> average alkalinity is 7.21 mg/L as CaCO 3 with a range <strong>of</strong> 0 to 92.1 mg/L<br />
(Eichner and o<strong>the</strong>rs, 2003). The lower 25 th percentile among pH readings from <strong>the</strong> 2001<br />
Snapshot, or <strong>the</strong> least impacted ponds, is 5.62.<br />
<strong>Scargo</strong> <strong>Lake</strong> has average summer pH readings generally around 6 with lower pH readings<br />
in April and <strong>the</strong> highest generally in August, when <strong>the</strong> phytoplankton population would be most<br />
active. During a given month, pH readings are generally higher in shallower waters than in <strong>the</strong><br />
deeper ones, again consistent with where most <strong>of</strong> <strong>the</strong> phytoplankton populations would be<br />
concentrated. <strong>Scargo</strong> had <strong>the</strong> highest average surface pH concentrations among <strong>the</strong> 11 pond<br />
regularly sampled by <strong>the</strong> <strong>Town</strong> <strong>of</strong> <strong>Dennis</strong> (Eichner, 2009). The pH readings are generally below<br />
<strong>the</strong> state water quality standard limit <strong>of</strong> 6.5 (310CMR4.05(3)(b.)3), but <strong>the</strong>se are mostly natural<br />
conditions except for <strong>the</strong> summer increases due to phosphorus additions. Alkalinity<br />
concentrations were only generally done with PALS Snapshot samples, so most <strong>of</strong> <strong>the</strong> readings<br />
occurred in August or September. Average August/September surface alkalinity in <strong>Scargo</strong> <strong>Lake</strong><br />
was 10.4 mg/L CaCO 3 with an increase to 20.5 mg/L in <strong>the</strong> deepest station. These alkalinity<br />
readings are also consistent with <strong>the</strong> low oxygen conditions and sediment regeneration <strong>of</strong><br />
chemical constituents.<br />
III.F. Chlorophyll-a and Phaeophytin<br />
Chlorophyll is a family <strong>of</strong> <strong>the</strong> primary photosyn<strong>the</strong>tic pigments in plants, both<br />
phytoplankton (or algae) and macrophytes (i.e., any aquatic plants larger than microscopic algae,<br />
including rooted aquatic plants). Because <strong>of</strong> its prevalence, measurement <strong>of</strong> chlorophyll can be<br />
used to estimate how many planktonic algae, or floating microscopic plants, are present in<br />
collected pond water samples. Chlorophyll-a is a specific pigment in <strong>the</strong> chlorophyll family and<br />
plays a primary role in photosyn<strong>the</strong>sis (USEPA, 2000). Phaeophytin is a breakdown product <strong>of</strong><br />
<strong>the</strong> chlorophyll molecule, which is usually indicative <strong>of</strong> phytoplankton degradation.<br />
Because phosphorus, <strong>the</strong> limiting nutrient in most Cape Cod ponds, is needed for growth<br />
by both microscopic algae and macrophytes, <strong>the</strong> available phosphorus pool can be divided<br />
unequally between <strong>the</strong>se two groups <strong>of</strong> plants. Because <strong>of</strong> this relationship, <strong>the</strong> relationship<br />
between chlorophyll-a and phosphorus measurements can sometimes be slightly askew,<br />
especially in ponds where macrophytes are <strong>the</strong> dominant plant community. Anecdotal evidence<br />
from Cape Cod ponds with undeveloped land around <strong>the</strong>m suggests that “natural” Cape ponds<br />
are algal-dominated and, <strong>the</strong>refore, should have a strong relationship between chlorophyll-a and<br />
total phosphorus concentrations. Cape ponds, such as Long Pond in Centerville, where extensive<br />
rooted macrophyte growth exists (IEP and KVA, 1989), appear to be <strong>the</strong> product <strong>of</strong> excessive<br />
nutrient loads and largely unrepresentative <strong>of</strong> <strong>the</strong> ecology in most Cape Cod ponds.<br />
During <strong>the</strong> 2001 PALS Snapshot sampling, 191 ponds were sampled and had surface<br />
chlorophyll-a concentrations determined (Eichner, et al., 2003). The average concentration <strong>of</strong><br />
<strong>the</strong>se samples was 8.44 ppb with a range from 0.01 to 102.9 ppb. Using <strong>the</strong> US Environmental<br />
19
Protection Agency (2000) method for determining nutrient threshold criteria and <strong>the</strong> PALS 2001<br />
sampling results, Eichner and o<strong>the</strong>rs (2003) determined that unimpacted Cape Cod ponds have a<br />
chlorophyll-a threshold concentration <strong>of</strong> 1.0 ppb and “healthy” Cape Cod ponds would have a<br />
threshold concentration <strong>of</strong> 1.7 ppb. Review <strong>of</strong> <strong>the</strong> 11 <strong>Dennis</strong> ponds monitoring data found that<br />
only one pond (Bakers) had average surface chlorophyll-a concentrations less than <strong>the</strong> 1.7 ppb<br />
regional limit (Eichner, 2009).<br />
<strong>Scargo</strong> <strong>Lake</strong> has an average summer surface chlorophyll-a concentration <strong>of</strong> 3.6 ppb<br />
(Figure III-6). Chlorophyll-a concentrations were only generally done with PALS Snapshot<br />
samples, so most <strong>of</strong> <strong>the</strong> readings occurred during <strong>the</strong> most biologically active period in August or<br />
September. However, <strong>the</strong> <strong>Town</strong> has collected April samplings since 2008 and <strong>the</strong>se show<br />
statistically significant increase in surface summer chlorophyll-a concentrations; average<br />
concentrations at 0.5 m, 3 m, and 9 m are all significantly higher in August/September compared<br />
to April. The deep station, however, as expected by <strong>the</strong> light limitations at that depth, do not<br />
show a significant increase. These concentrations are consistent with an addition <strong>of</strong> phosphorus<br />
during <strong>the</strong> summer, but <strong>the</strong> depth pr<strong>of</strong>ile and <strong>the</strong> TP, TN, and DO readings suggest that <strong>the</strong><br />
addition is not from <strong>the</strong> hypolimnion. All summer averages are greater than <strong>the</strong> 1.0 to 1.7 µg/L<br />
limit recommended for Cape Cod ponds (Eichner and o<strong>the</strong>rs, 2003).<br />
The average summer chlorophyll concentrations also show a maximum average<br />
concentration at 9 m (7.4 ppb). This concentration is more than twice <strong>the</strong> average<br />
concentrations at 0.5 and 3 m and is consistent with phytoplankton utilizing higher phosphorus<br />
concentrations in <strong>the</strong> deeper, hypoxic waters.<br />
Phaeophytin concentrations are generally low in upper waters; <strong>the</strong>y average 23%, 29%,<br />
and 33% <strong>of</strong> August/September chlorophyll concentrations at 0.5 m, 3 m, and 9 m, respectively.<br />
But at <strong>the</strong> deepest station, nearest <strong>the</strong> sediments, <strong>the</strong> relationship reverses and <strong>the</strong> average<br />
summer phaeophytin is nearly 8X <strong>the</strong> chlorophyll concentration (see Figure III-6). These<br />
readings would be consistent with degrading phytoplankton settling to <strong>the</strong> bottom sediments; it is<br />
also an expression <strong>of</strong> how lakes capture and retain nutrients and carbon.<br />
Comparison <strong>of</strong> <strong>the</strong> two pigment concentrations is also notable for differences in seasonal<br />
ratios. In April, average chlorophyll concentrations are 25X phaeophytin concentrations in <strong>the</strong><br />
surface waters (0.5 m and 3 m), 5X concentrations at 9 m, and approximately <strong>the</strong> same at <strong>the</strong><br />
deepest station (1.2X). In August/September, <strong>the</strong> average chlorophyll-a concentration at 9 m is<br />
34X <strong>the</strong> phaeophytin concentration and <strong>the</strong> deepest station has decreased to 0.1X. These<br />
readings reinforce <strong>the</strong> seasonal stratification structure <strong>of</strong> <strong>the</strong> lake water column and how <strong>the</strong><br />
deepest waters are capturing <strong>the</strong> nutrients and carbon in dying phytoplankton.<br />
20
100<br />
90<br />
pigment (µg/L)<br />
80<br />
70<br />
60<br />
50<br />
40<br />
30<br />
Chlorophyll-a<br />
Phaeophytin<br />
20<br />
10<br />
0<br />
0 1 2 3 4 5 6 7 8 9 10 11 12 13 14 15<br />
Depth (meters)<br />
Figure III-6. <strong>Scargo</strong> <strong>Lake</strong> Average August/September Pigment Concentrations<br />
Average chlorophyll-a and phaeophytin concentrations are shown at each <strong>of</strong> <strong>the</strong> depths based on standard PALS protocols; <strong>the</strong> deepest<br />
reading is based on <strong>the</strong> overall average depth <strong>of</strong> one meter <strong>of</strong>f <strong>the</strong> bottom. Chlorophyll-a concentrations average 3.6 µg/L, 3.1 µg/L,<br />
7.4 µg/L, 5.1 µg/L, and 4.7 µg/L at <strong>the</strong> respective depths. The doubling <strong>of</strong> <strong>the</strong> average at 9 m is thought to be due to phytoplankton<br />
utilizing higher phosphorus concentrations near <strong>the</strong> top <strong>of</strong> <strong>the</strong> hypolimnion; however, no accompanying indication <strong>of</strong> higher TP<br />
concentrations is seen in <strong>the</strong> phosphorus data. The increase with phaeophytin is likely due to settling <strong>of</strong> degrading phytoplankton. All<br />
summer chlorophyll-a averages are greater than <strong>the</strong> 1.0 to 1.7 µg/L limit recommended for Cape Cod ponds (Eichner and o<strong>the</strong>rs,<br />
2003).<br />
21
IV. O<strong>the</strong>r Key Ecosystem Functions/Measures<br />
IV.A. <strong>Scargo</strong> <strong>Lake</strong> Bird Population Survey<br />
As part <strong>of</strong> <strong>the</strong> overall project to clarify and prioritize future water quality management<br />
strategies for <strong>Scargo</strong> <strong>Lake</strong>, CSP/SMAST staff developed a <strong>Scargo</strong> <strong>Lake</strong> Bird Population Survey.<br />
This effort included developing a survey strategy, conducting <strong>the</strong> survey for approximately one<br />
year, and using <strong>the</strong> survey results to develop a <strong>Scargo</strong> <strong>Lake</strong>-specific phosphorus load for birds<br />
(Eichner and Howes, 2012). The survey was completed using volunteer bird counters and was<br />
undertaken based on <strong>the</strong> recommendation in Eichner (2009) that direct measurement <strong>of</strong> <strong>Scargo</strong><br />
<strong>Lake</strong>-specific factors would help to target strategies in ways that would actually benefit <strong>Scargo</strong><br />
<strong>Lake</strong>.<br />
In order to complete <strong>the</strong> <strong>Scargo</strong> <strong>Lake</strong> Bird Population Survey, project staff divided <strong>the</strong><br />
lake into quadrants. Volunteers were asked identify <strong>the</strong> bird species (by common name) within<br />
each quadrant, count <strong>the</strong> number <strong>of</strong> birds for each species, and note whe<strong>the</strong>r <strong>the</strong>y were greater<br />
than or less than 20 feet from <strong>the</strong> shore. Counts were to occur at least every two weeks. The<br />
volunteer team <strong>of</strong> John Harper and Cliff Adams began counting on October 10, 2010 and<br />
conducted 54 counts before completing <strong>the</strong> counting on September 30, 2011.<br />
The average number <strong>of</strong> birds on <strong>the</strong> lake was 34 with a range <strong>of</strong> 0 to 167 birds. October<br />
and January averaged <strong>the</strong> highest number <strong>of</strong> birds (~70), while February to June generally<br />
averaged between 5 and 26 (Figure IV-1). Overall, Mallards (Anas platyrhynchos) are <strong>the</strong> most<br />
frequent birds (55%) on <strong>the</strong> lake with Herring Gulls (Larus smithsonianus) as <strong>the</strong> next most<br />
frequent (33%). Mallards and Herring Gulls collectively average 85% <strong>of</strong> <strong>the</strong> counted birds on a<br />
monthly basis. Review <strong>of</strong> <strong>the</strong> spatial distribution shows that most <strong>of</strong> <strong>the</strong> birds (65%) are in<br />
Quadrants 3 and 4, which is <strong>the</strong> shallower end <strong>of</strong> <strong>the</strong> lake. Birds also preferred staying away<br />
from <strong>the</strong> shoreline, with 58% being more than 20 feet from <strong>the</strong> lake shore. Generally, Mallards<br />
were within 20 feet <strong>of</strong> <strong>the</strong> shore, while Herring Gulls were more than 20 ft from <strong>the</strong> shore, but<br />
<strong>the</strong>re are a couple <strong>of</strong> occasions where large Mallard counts were recorded in deeper waters.<br />
Scherer and o<strong>the</strong>rs (1995) conducted a highly detailed bird count and phosphorus loading<br />
estimate for a large lake in <strong>the</strong> state <strong>of</strong> Washington. This study also provides a review <strong>of</strong> net<br />
phosphorus contributions by a number species including Mallards and Gulls. In <strong>the</strong> study, <strong>the</strong><br />
authors detail <strong>the</strong> weight <strong>of</strong> species-specific bird droppings, <strong>the</strong>ir total phosphorus content, <strong>the</strong><br />
likely probability that droppings will enter <strong>the</strong> lake, and <strong>the</strong> percentage <strong>of</strong> phosphorus that is new<br />
phosphorus ra<strong>the</strong>r than recycled phosphorus already in <strong>the</strong> lake for 11 species or functional<br />
groups <strong>of</strong> species. Using <strong>the</strong>se factors, SMAST staff determined <strong>the</strong> bird phosphorus load on<br />
each day birds were counted. These loads were <strong>the</strong>n averaged and a net annual <strong>Scargo</strong> <strong>Lake</strong>specific<br />
phosphorus load <strong>of</strong> 0.57 kg from birds was determined.<br />
IV.B. <strong>Scargo</strong> <strong>Lake</strong> Stormwater Survey<br />
As part <strong>of</strong> <strong>the</strong> overall project to clarify and prioritize future water quality management<br />
strategies, CSP/SMAST staff completed a <strong>Scargo</strong> <strong>Lake</strong> Stormwater Survey. This effort<br />
identified <strong>the</strong> primary direct stormwater discharge locations around <strong>the</strong> lake and sampled <strong>the</strong><br />
four locations during three storm events (Eichner and Howes, 2012). This effort was undertaken<br />
based on <strong>the</strong> recommendation in Eichner (2009) that direct stormwater run<strong>of</strong>f to <strong>the</strong> lake was<br />
largely unquantified and detailing <strong>Scargo</strong> <strong>Lake</strong>-specific measurements would help to target<br />
22
80<br />
70<br />
70.0<br />
72.8<br />
60<br />
55.5<br />
Great Blue Heron<br />
Eider Duck<br />
Diving Duck<br />
Average Monthly Count<br />
50<br />
40<br />
30<br />
26.0<br />
41.7<br />
48.0<br />
Canada Goose<br />
White Duck<br />
Egret<br />
Loon<br />
Cormorant<br />
Buffelhead<br />
Hooded Merganser<br />
Black Duck<br />
20<br />
10<br />
14.6<br />
5.0<br />
4.7<br />
9.8 10.0<br />
NO COUNT<br />
Swan<br />
Mallard<br />
Herring Gull<br />
0<br />
Oct-10 Nov-10 Dec-10 Jan-11 Feb-11 Mar-11 Apr-11 May-11 Jun-11 Jul-11 Aug-11 Sep-11<br />
Figure IV-1. Average Monthly Bird Counts on <strong>Scargo</strong> <strong>Lake</strong> (October 10, 2010 and September 30, 2011).<br />
Surveys per month ranged between 3 and 7. No readings were collected in August 2011. Overall average is 34 birds per month with a<br />
total count <strong>of</strong> 1,848 birds. Mallards and herring gulls are <strong>the</strong> most common birds observed.<br />
23
strategies in ways that would actually benefit <strong>Scargo</strong> <strong>Lake</strong>. Unlike groundwater inflows,<br />
stormwater discharges can contain high concentrations <strong>of</strong> phosphorus and can have a<br />
disproportionate effect on <strong>the</strong> lake phosphorus balance.<br />
In order to complete <strong>the</strong> <strong>Scargo</strong> <strong>Lake</strong> Stormwater Survey, project staff completed an area<br />
reconnaissance survey, traveling to locations around <strong>the</strong> lake during two storms to assess where<br />
run<strong>of</strong>f discharged into <strong>the</strong> lake. This survey found stormwater run<strong>of</strong>f into <strong>the</strong> lake from <strong>the</strong><br />
parking lot at <strong>Scargo</strong> Beach (Figure IV-2) and at <strong>the</strong> boat ramp on <strong>the</strong> north side <strong>of</strong> <strong>the</strong> lake<br />
(Figure IV-3). This survey also identified historic run<strong>of</strong>f channels from Gretchen’s Way/Erb<br />
Drive to Princess Beach; catch basins at <strong>the</strong> eastern end <strong>of</strong> Gretchen’s Way have relatively new<br />
berms approximately two feet tall on <strong>the</strong>ir downstream side that appear to have only recently<br />
prevented run<strong>of</strong>f to <strong>the</strong> lake (Figure IV-4). Run<strong>of</strong>f channels through <strong>the</strong> woods to Princess<br />
Beach have debris from some <strong>of</strong> <strong>the</strong> materials currently around <strong>the</strong> catch basin indicating past<br />
flows from <strong>the</strong> road to <strong>the</strong> beach. The run<strong>of</strong>f channels also show evidence <strong>of</strong> past flows to <strong>the</strong><br />
beach to within a few feet <strong>of</strong> <strong>the</strong> shoreline, but no evidence <strong>of</strong> direct discharge to <strong>the</strong> lake. It is<br />
possible that direct discharge channels have been obscured by regular water level fluctuations in<br />
<strong>the</strong> lake. Collectively for <strong>the</strong> survey, two run<strong>of</strong>f sampling locations were established at <strong>Scargo</strong><br />
Beach, one at <strong>the</strong> boat ramp, and one just upstream <strong>of</strong> <strong>the</strong> catch basin on Gretchen’s Way.<br />
Project staff collected stormwater samples on <strong>the</strong> following dates during 2011: April 13,<br />
June 22, and August 15. Rain events <strong>of</strong> less than 0.25 inches in 24 hours do not typically<br />
generate sufficient stormwater flows for run<strong>of</strong>f, so staff attempted to sample only during large<br />
forecasted storms. The run<strong>of</strong>f generated by <strong>the</strong> April 13 storm was significantly larger than<br />
ei<strong>the</strong>r <strong>of</strong> <strong>the</strong> o<strong>the</strong>r two storm events (Figure IV-5); recorded precipitation at Hyannis Airport on<br />
April 13 was 2.66 inches, while June 22 was 0.74 inches and August 15 was 1.4 inches. Due to<br />
<strong>the</strong> lack <strong>of</strong> specific discharge pipes, sample collection and volume measurements were made by<br />
channeling <strong>the</strong> run<strong>of</strong>f using sand bags to create a central point to collect water samples. Flow<br />
rates were also measured at <strong>the</strong>se points Flow readings and water quality samples were collected<br />
a minimum <strong>of</strong> three times during each storm event in order to gauge intensity and provide a<br />
reliable basis for event-mean concentrations (EMC). Timing <strong>of</strong> sampling strived to capture <strong>the</strong><br />
initial “first flush” and peak <strong>of</strong> each stormwater event, as well as a reasonable sampling <strong>of</strong> <strong>the</strong><br />
whole event. <strong>Water</strong> samples for chemical analysis were collected into one liter polypropylene<br />
bottles using a Geo Pump, with analysis by <strong>the</strong> Coastal Systems Analytical Facility at <strong>the</strong> School<br />
<strong>of</strong> Marine Science and Technology (SMAST), University <strong>of</strong> Massachusetts Dartmouth in New<br />
Bedford. Samples were analyzed for <strong>the</strong> following constituents: total phosphorus (TP), orthophosphorus,<br />
total nitrogen (TN), nitrogen component species (NH4, NO3+NO2, TDN, and<br />
PON), POC, and alkalinity. Flow and EMC data were used to determine loads <strong>of</strong> TP and TN<br />
during each storm (Figure IV-6). The load information showed that although <strong>the</strong> April 13 storm<br />
was much larger than <strong>the</strong> o<strong>the</strong>r two measured storms and <strong>the</strong> loads typically followed this same<br />
pattern, <strong>the</strong>re were sampling locations where greater loads were measured during <strong>the</strong> o<strong>the</strong>r two<br />
storms.<br />
24
Figure IV-2. <strong>Scargo</strong> Beach: <strong>Scargo</strong> <strong>Lake</strong> Stormwater Sampling.<br />
The parking lot at <strong>Scargo</strong> Beach and <strong>the</strong> driveway to <strong>the</strong> south generate stormwater that discharges directly into <strong>Scargo</strong> <strong>Lake</strong> through<br />
run<strong>of</strong>f channels eroded through <strong>the</strong> buffer strip (right-hand picture). CSP/SMAST staff temporarily focused <strong>the</strong>se channels into two<br />
discharge points for sampling.<br />
25
Figure IV-3. <strong>Scargo</strong> Boat Ramp: <strong>Scargo</strong> <strong>Lake</strong> Stormwater Sampling.<br />
The boat ramp on <strong>the</strong> north side <strong>of</strong> <strong>Scargo</strong> <strong>Lake</strong> receives run<strong>of</strong>f from <strong>the</strong> upgradient roadway as well as generating stormwater from<br />
its semi-pervious surface. The combined stormwater flow creates diffuse run<strong>of</strong>f channels that discharge directly into <strong>Scargo</strong> <strong>Lake</strong>.<br />
The aerial photo from Google Earth on <strong>the</strong> left-side shows a sediment deposition delta in <strong>the</strong> lake that is likely predominantly due to<br />
boats being removed from <strong>the</strong> lake, but is also likely partially due to fine sediments deposited by stormwater run<strong>of</strong>f. CSP/SMAST<br />
staff temporarily focused <strong>the</strong> run<strong>of</strong>f channels into one discharge point for sampling.<br />
26
A<br />
B<br />
Figure IV-4. Gretchen Way/Erb Drive/Princess Beach: <strong>Scargo</strong> <strong>Lake</strong> Stormwater Sampling.<br />
Gretchen Way/Erb Drive slopes steeply toward <strong>Scargo</strong> <strong>Lake</strong> and <strong>the</strong> catchbasin shown in A (and by <strong>the</strong> yellow dot) collects a large<br />
portion <strong>of</strong> <strong>the</strong> road’s stormwater run<strong>of</strong>f. The berms around <strong>the</strong> catchbasin appear to be relatively new (right photo with flat black<br />
stones) and adjacent woods show evidence <strong>of</strong> erosion channels that extend onto Princess Beach (blue dot and lower right photo).<br />
These run<strong>of</strong>f channels indicate that stormwater run<strong>of</strong>f historically has discharged to within feet <strong>of</strong> <strong>the</strong> <strong>Scargo</strong> <strong>Lake</strong> shoreline and<br />
likely discharged directly to lake waters. Note, shoreline channels are not visible, most likely due to reworking by waves and lake<br />
water level fluctuates, CSP/SMAST staff collected stormwater samples prior to <strong>the</strong> catch basin to assess potential past discharges to<br />
<strong>Scargo</strong> <strong>Lake</strong> from this area.<br />
27
20<br />
18<br />
Stormwater Run<strong>of</strong>f Volume (m3)<br />
16<br />
14<br />
12<br />
10<br />
8<br />
6<br />
4<br />
<strong>Scargo</strong> Beach1<br />
<strong>Scargo</strong> Beach2<br />
Erb Dr/Gretchen Way<br />
Boat Ramp<br />
2<br />
0<br />
4/13/11 6/22/11 8/15/11<br />
Figure IV-5. Measured 2011 Stormwater Run<strong>of</strong>f Volumes: <strong>Scargo</strong> <strong>Lake</strong>.<br />
Run<strong>of</strong>f volumes are sum totals <strong>of</strong> each storm event. The April 13, 2011 storm generated much larger stormwater run<strong>of</strong>f volumes than<br />
ei<strong>the</strong>r <strong>the</strong> 6/22 or 8/15 storms. According to precipitation recordings at Hyannis Airport (<strong>the</strong> closest gauge), precipitation on each <strong>of</strong><br />
<strong>the</strong> dates was 2.66, 0.74, and 1.4 inches, respectively. Run<strong>of</strong>f volumes are based on a minimum <strong>of</strong> three readings during <strong>the</strong> course <strong>of</strong><br />
<strong>the</strong> storm. Differences in generated volumes can be based on <strong>the</strong> catchment areas and surface materials (e.g., blacktop vs. stone), as<br />
well as timing <strong>of</strong> measurements. Erb Drive flows do not reach <strong>Scargo</strong> <strong>Lake</strong>, but may have in <strong>the</strong> past.<br />
28
16<br />
14<br />
12<br />
Nutrient mass (g)<br />
10<br />
8<br />
6<br />
4<br />
<strong>Scargo</strong> Beach1<br />
<strong>Scargo</strong> Beach2<br />
Erb Dr/Gretchen Way<br />
Boat Ramp<br />
2<br />
0<br />
4/13/11 6/22/11 8/15/11 4/13/11 6/22/11 8/15/11<br />
Total Phosphorus Load (g)<br />
Total Nitrogen Load (g)<br />
Figure IV-6. Measured Stormwater Nutrient Loads (Total Phosphorus and Total Nitrogen): 2011 <strong>Scargo</strong> <strong>Lake</strong>.<br />
Nutrient loads are sum totals <strong>of</strong> each storm event. The April 13, 2011 storm cumulatively generated more nutrient inputs to <strong>Scargo</strong><br />
<strong>Lake</strong> than ei<strong>the</strong>r <strong>of</strong> <strong>the</strong> o<strong>the</strong>r two storms, but at selected locations higher nutrient loads were measured during <strong>the</strong> o<strong>the</strong>r two storms.<br />
For example, a total phosphorus load <strong>of</strong> 2.3 g was measured at <strong>the</strong> <strong>Scargo</strong> Boat Ramp during <strong>the</strong> 6/22 storm, while a load <strong>of</strong> 1.6 g was<br />
recorded during <strong>the</strong> 4/13 storm. More extensive review <strong>of</strong> <strong>the</strong> stormwater data and its relationship to water quality management<br />
strategies will occur during <strong>the</strong> subsequent <strong>Scargo</strong> <strong>Lake</strong> <strong>Water</strong> <strong>Quality</strong> <strong>Management</strong> <strong>Report</strong>. Erb Drive loads do not reach <strong>Scargo</strong><br />
<strong>Lake</strong>, but may have in <strong>the</strong> past.<br />
29
In order to develop a <strong>Scargo</strong> <strong>Lake</strong>-specific annual stormwater phosphorus load, project<br />
staff used <strong>the</strong> measured data from <strong>the</strong> three storms and extrapolated <strong>the</strong>ir sums up to <strong>the</strong> average<br />
run<strong>of</strong>f <strong>of</strong> 40 inches per year, which is <strong>the</strong> conventional run<strong>of</strong>f used on Cape Cod (Eichner and<br />
Cambareri, 1992). Although <strong>the</strong> three storms are in April, June, and August, <strong>the</strong> April storm was<br />
exceptionally large; between 1993 and 2006, 40% <strong>of</strong> <strong>the</strong> monthly precipitation totals at Hyannis<br />
were less than <strong>the</strong> precipitation measured during this one storm. Given <strong>the</strong> statistical balance<br />
<strong>of</strong>fered by this storm, extrapolation is reasonable and may be slightly conservative. Using this<br />
approach <strong>the</strong> annual total phosphorus load from stormwater run<strong>of</strong>f from <strong>the</strong> existing roads<br />
around <strong>Scargo</strong> <strong>Lake</strong> is 0.0135 kg. Based on <strong>the</strong> readings at Erb Drive, <strong>the</strong> past potential annual<br />
stormwater load from all sites is 0.0141 kg.<br />
IV.C. <strong>Scargo</strong> <strong>Lake</strong> Sediment Survey<br />
Prior evaluation <strong>of</strong> <strong>Scargo</strong> <strong>Lake</strong> water quality data suggested that <strong>the</strong> sediments<br />
occasionally impact phosphorus concentrations in <strong>Scargo</strong> <strong>Lake</strong> (Eichner, 2009). In order to<br />
assess this impact and potential future impacts, CSP/SMAST staff collected and incubated<br />
sediment cores at various depths around <strong>the</strong> lake to evaluate nutrient regeneration from <strong>the</strong><br />
sediments under oxidizing and reducing conditions.<br />
Eight sediment cores were collected on August 20, 2010 and ano<strong>the</strong>r eight cores were<br />
collected on January 10, 2012 (Figure IV-7). The initial cores were analyzed for aerobic<br />
phosphorus regeneration, while <strong>the</strong> second set <strong>of</strong> cores was analyzed for both aerobic and anoxic<br />
regeneration. During both summer and winter coring events standard handling, incubation, and<br />
sampling procedures were followed based on <strong>the</strong> methods <strong>of</strong> Jorgensen (1977), Klump and<br />
Martens (1983), and Howes (1998). During <strong>the</strong> incubations, water samples were withdrawn<br />
periodically and chemical constituents were determined. Rates <strong>of</strong> sediment nutrient release were<br />
determined from linear regression <strong>of</strong> analyte concentrations through time. All analyses were<br />
completed at <strong>the</strong> Coastal Systems Program Laboratory, School for Marine Science and<br />
Technology (SMAST), University <strong>of</strong> Massachusetts Dartmouth using standard methods for<br />
analysis and sediment geochemistry.<br />
There are a number <strong>of</strong> factors that control <strong>the</strong> release <strong>of</strong> phosphorus from lake sediments<br />
aside from redox and temperature relationships (e.g., aluminum and/or iron content), but<br />
transition from aerobic to anaerobic conditions generally liberates significant phosphorus.<br />
Release <strong>of</strong> phosphorus during this transition generally follows a sigmoidal curve with three<br />
phases: 1) initial hypoxic and anaerobic decomposition attenuated by sediment iron; 2) chemical<br />
release <strong>of</strong> bound phosphate and anaerobic decomposition; and 3) anaerobic decomposition in <strong>the</strong><br />
absence <strong>of</strong> significant sediment iron. The second phase typically involves <strong>the</strong> rapid reduction and<br />
solubilizing <strong>of</strong> iron, which breaks iron/phosphorus bonds and liberates phosphorus. This phase<br />
is typically very rapid with a pulse-like release <strong>of</strong> phosphorus and is followed by a relative<br />
constant release in <strong>the</strong> third phase that ends when <strong>the</strong> anaerobic conditions cease. The key phase<br />
2 and 3 anaerobic releases in <strong>Scargo</strong> <strong>Lake</strong> would be <strong>the</strong> deepest cores (1, 2, 3) since <strong>the</strong>se would<br />
be <strong>the</strong> depths where anaerobic conditions would occur.<br />
30
8/10/2010<br />
1/10/2012<br />
<strong>Town</strong> Location Site ID Latitude Longitude Latitude Longitude<br />
DENNIS SCARGO LAKE SGO1 41 44.465 70 11.022 41 44.466 70 11.019<br />
DENNIS SCARGO LAKE SGO2 41 44.535 70 11.064 41 44.531 70 11.052<br />
DENNIS SCARGO LAKE SGO3 41 44.566 70 10.998 41 44.565 70 10.991<br />
DENNIS SCARGO LAKE SGO4 41 44.618 70 11.006 41 44.618 70 11.002<br />
DENNIS SCARGO LAKE SGO5 41 44.567 70 10.936 41 44.568 70 10.919<br />
DENNIS SCARGO LAKE SGO6 41 44.565 70 10.875 41 44.566 70 10.865<br />
DENNIS SCARGO LAKE SGO7 41 44.656 70 10.912 41 44.659 70 10.911<br />
DENNIS SCARGO LAKE SGO8 41 44.472 70 10.834<br />
DENNIS SCARGO LAKE SGO9 41 44.626 70 10.868<br />
Figure IV-7. <strong>Scargo</strong> <strong>Lake</strong> Sediment Core Locations.<br />
Sediment cores were collected in both summer and winter from <strong>the</strong> locations indicated by <strong>the</strong> red<br />
dots. August cores were incubated under aerobic conditions, while <strong>the</strong> January cores were<br />
incubated under both aerobic and anoxic conditions. Core locations are shown in <strong>the</strong> associated<br />
table. Location SGO-9 replaced SGO-8 in <strong>the</strong> winter survey.<br />
31
Table IV-1 indicates <strong>the</strong> core incubation results. The summer aerobic core incubations<br />
generally show uptake <strong>of</strong> phosphorus by shallow (0-4 m) sediments, release <strong>of</strong> phosphorus in <strong>the</strong><br />
middle depth (4-8 m) sediments and slight release <strong>of</strong> total phosphorus and slight uptake <strong>of</strong> ortho-<br />
P in <strong>the</strong> deep (8-14 m) sediments. This pattern is typical <strong>of</strong> lakes where <strong>the</strong> shallow waters tend<br />
to have more sandy nutrient-poor sediments because fine organic materials (plankton and<br />
detritus) are resuspended by wave action and winnowed toward deeper waters by in-lake<br />
circulation. The middle depths accumulate both <strong>the</strong> finer sediments (potentially enhanced by <strong>the</strong><br />
mussel population) and some <strong>of</strong> <strong>the</strong> phosphorus released from <strong>the</strong> deep basins by anoxia, and<br />
<strong>the</strong>refore show <strong>the</strong> highest rates <strong>of</strong> release. Inorganic nitrogen (NO3-N and NH3-N) and total N<br />
both show increasing release with increasing depth. The temperature and dissolved oxygen<br />
pr<strong>of</strong>iles when <strong>the</strong>se cores were collected generally showed cold deep temperatures (~10°C),<br />
lower dissolved oxygen throughout most <strong>of</strong> <strong>the</strong> water column, and shallower anoxia than average<br />
(up to 9 m).<br />
In January 2012, ano<strong>the</strong>r set <strong>of</strong> cores was collected and incubated for both aerobic and<br />
anaerobic conditions. As would be expected by <strong>the</strong> colder temperatures, <strong>the</strong> sediment oxygen<br />
demand is significantly reduced from summer conditions (10X less) and similar at all depth<br />
ranges during <strong>the</strong> winter. Shallowest sediments release inorganic nitrogen, total nitrogen, orthophosphorus,<br />
and total phosphorus at much higher aerobic rates during <strong>the</strong> winter than during <strong>the</strong><br />
summer. Total nitrogen is released at roughly <strong>the</strong> same rate at intermediate depths between<br />
summer and winter, while twice as much is released from <strong>the</strong> deepest water sediments during <strong>the</strong><br />
summer. Total and ortho-phosphorus are released at more than 10X higher rates in <strong>the</strong><br />
intermediate depths during <strong>the</strong> summer than in <strong>the</strong> winter. In <strong>the</strong> deeper water sediments where<br />
water temperatures are more consistent between summer and winter, inorganic nitrogen release<br />
is similar between summer and winter conditions.<br />
The results in Table IV-1 are <strong>the</strong> gross sediment releases. In order to assess <strong>the</strong> true<br />
impact <strong>of</strong> <strong>the</strong> sediments, <strong>the</strong>se gross releases must be adjusted to consider simultaneous<br />
deposition <strong>of</strong> nutrients from <strong>the</strong> overlying water column, as well as <strong>the</strong> area <strong>of</strong> <strong>the</strong> sediments.<br />
Adjusting <strong>the</strong> summer aerobic releases shows that <strong>the</strong> larger area <strong>of</strong> <strong>the</strong> 0-4 m sediments have a<br />
net uptake <strong>of</strong> total phosphorus (-0.10 kg/d), while <strong>the</strong> 4-8 m sediments have a net release <strong>of</strong> 0.14<br />
kg/d. The net combination <strong>of</strong> <strong>the</strong>se aerobic sediments in August 2010 is a 0.04 kg/d addition <strong>of</strong><br />
total phosphorus from <strong>the</strong> water column to <strong>the</strong> sediments. This rate would equal an addition <strong>of</strong><br />
approximately 4.6 kg over a four month summer period (June to September). Based on<br />
consideration <strong>of</strong> <strong>the</strong> watershed phosphorus loads and <strong>the</strong> average measured mass <strong>of</strong> phosphorus<br />
in <strong>the</strong> pond, this result appears to be reasonable.<br />
During <strong>the</strong> winter, <strong>the</strong>se shallower, aerobic sediments take up more phosphorus. The 0-4<br />
m sediments roughly balance release and settling, while <strong>the</strong> 4-8 m sediments have a net uptake <strong>of</strong><br />
0.03 kg/d. The deep sediments (>8 m) more than double this uptake rate (0.08 kg/d). The<br />
overall net result is that <strong>the</strong> lake sediments are removing 0.1 kg <strong>of</strong> total phosphorus each day or<br />
12 kg over a 4 month winter period (November to February).<br />
32
Table IV-1. <strong>Scargo</strong> <strong>Lake</strong> Sediment Core Analysis.<br />
Sediment cores collected at sites indicated in Figure IV-7 at depths noted below. All values indicated as sediment release in<br />
milligrams per square meter per day under <strong>the</strong> specified redox conditions. Negative nutrient values indicate uptake from <strong>the</strong> water<br />
column by <strong>the</strong> sediments. Cores were incubated at water temperatures at <strong>the</strong> time <strong>of</strong> collection.<br />
A. August 10, 2010 Aerobic<br />
Depth Sediment O2 Inorganic<br />
Range Uptake<br />
Nitrogen<br />
Ortho-Phosphate Total Nitrogen Total Phosphorus<br />
(mg O2 m-2d-1) (mg N m-2d-1) (mg P m-2d-1) (mg N m-2d-1) (mg P m-2d-1)<br />
(meters) Mean s.e. Mean s.e. Mean s.e. Mean s.e. Mean s.e.<br />
4,8 0 - 4 1039 49 1.84 0.57 -1.04 0.01 1.88 1.34 -0.41 0.33<br />
5,6,7 4 - 8 1283 219 4.52 1.09 2.17 1.62 28.94 0.55 3.79 0.53<br />
1,2,3 8 - 14 1817 228 7.45 2.79 -0.31 0.39 36.27 7.59 0.15 0.37<br />
Core Sites<br />
B. January 11, 2012 Aerobic<br />
Depth Sediment O2 Inorganic<br />
Ortho-Phosphate Total Nitrogen Total Phosphorus<br />
Range Uptake<br />
Nitrogen<br />
Core Sites<br />
(mg O2 m-2d-1) (mg N m-2d-1) (mg P m-2d-1) (mg N m-2d-1) (mg P m-2d-1)<br />
(meters) Mean s.e. Mean s.e. Mean s.e. Mean s.e. Mean s.e.<br />
4 0 - 4 17.53 1.13 9.92 0.48 0.34 0.27 26.62 4.46 0.90 0.40<br />
5,6,7,9 4 - 8 18.06 3.90 12.17 4.28 0.07 0.22 30.95 4.11 0.22 0.15<br />
1,2,3 8 - 14 13.70 1.33 8.73 2.07 0.16 0.08 15.51 1.43 0.41 0.10<br />
C. January 17, 2012 Anaerobic<br />
Depth<br />
Range<br />
Sediment O2 Uptake<br />
Ammonium<br />
Phase 2 P Release<br />
(chemical +<br />
anaerobic)<br />
Anaerobic P Release<br />
Chemical P Release<br />
Core Sites<br />
(mg O2 m-2d-1) (mg N m-2d-1) (mg P m-2d-1) (mg P m-2d-1) (mg P m - 2y-1)<br />
(meters) Mean s.e. Mean s.e. Mean s.e. Mean s.e. Mean s.e. Days<br />
4 0 - 4 17.53 1.13 12.16 0.34 0.95 0.02 0.24 0.07 39.79 2.61 27<br />
5,6,7,9 4 - 8 18.06 3.90 6.44 0.49 1.00 0.09 0.17 0.04 37.43 1.90 45.0<br />
1,2,3 8 - 14 13.70 1.33 4.64 0.52 0.82 0.24 0.09 0.03 24.48 4.57 33.7<br />
33
The net result <strong>of</strong> <strong>the</strong>se aerobic sediment interactions would be annual retention <strong>of</strong> 7.5 kg<br />
<strong>of</strong> phosphorus in <strong>Scargo</strong> <strong>Lake</strong> in <strong>the</strong> upper portion <strong>of</strong> <strong>the</strong> lake. This calculation would assume<br />
that <strong>the</strong> two “shoulder” seasons (October and March/April) would essentially balance each o<strong>the</strong>r.<br />
This calculation would <strong>the</strong>n need to adjusted to account for o<strong>the</strong>r factors removing phosphorus<br />
from <strong>the</strong> lake (e.g., stream outflow and movement <strong>of</strong> phosphorus to deeper waters).<br />
One way to begin to understanding <strong>the</strong> deeper waters is to look at summer anaerobic<br />
conditions. During <strong>the</strong> summer, anaerobic (or reducing) redox conditions develop in <strong>the</strong><br />
sediments and <strong>the</strong> overlying water, which lead to <strong>the</strong> release <strong>of</strong> iron-bound phosphorus from <strong>the</strong><br />
sediments (and <strong>the</strong> higher TP concentrations observed in <strong>the</strong> deepest water quality samples).<br />
The winter 2012 cores were collected when bottom temperatures were approximately 2 to 3°C<br />
cooler than during typical August temperatures. A rough rule <strong>of</strong> thumb is that sediment nutrient<br />
release rates double for every 10°C increase. During anaerobic conditions, iron-bound<br />
phosphorus is released first with anaerobic releases following until oxygen is reintroduced. In<br />
Table 1, <strong>the</strong> chemical release columns are <strong>the</strong> iron-bound release rates and <strong>the</strong> length <strong>of</strong> time (in<br />
days) that <strong>the</strong> release occurred during <strong>the</strong> incubation <strong>of</strong> <strong>the</strong> cores. It is noteworthy that <strong>the</strong><br />
chemical release rate is 3-7X <strong>the</strong> anaerobic release rate <strong>of</strong> phosphorus and that <strong>the</strong>se types <strong>of</strong><br />
conditions would only typically be experienced in <strong>the</strong> deepest sediments (>9 m). Complete<br />
multiple dissolved oxygen pr<strong>of</strong>iles from <strong>the</strong> same summer are limited in <strong>the</strong> dataset, but <strong>the</strong> few<br />
available show that anaerobic conditions in deep <strong>Scargo</strong> <strong>Lake</strong> waters typically extended beyond<br />
<strong>the</strong> length <strong>of</strong> <strong>the</strong> chemical release phase indicated in <strong>the</strong> core incubation (34 days) meaning that<br />
all iron-bound phosphorus would be released and subsequent phosphorus release would occur at<br />
<strong>the</strong> anaerobic rate. Review <strong>of</strong> <strong>the</strong> estimated summer release information based on <strong>the</strong> core<br />
incubation shows that 1.1 to 1.3 kg is released from <strong>the</strong> sediments during <strong>the</strong> summer.<br />
<strong>Water</strong> quality data provides an additional comparison for <strong>the</strong>se estimates. Available data<br />
is typically limited to an August and September pr<strong>of</strong>iles; <strong>the</strong>se show deep water additions <strong>of</strong> TP<br />
ranging between -1.1 and 1.9 kg. 2003 is <strong>the</strong> only year with June through September phosphorus<br />
concentrations at depth and <strong>the</strong> mass in <strong>the</strong> deep portion <strong>of</strong> <strong>the</strong> pond did not show an increase<br />
during <strong>the</strong> 2003 summer. Comparison <strong>of</strong> average TP water concentrations at 9 m and deeper<br />
show increases <strong>of</strong> 1.5 and 2.7 kg between April and August and April and September,<br />
respectively. These concentrations would also include settling phytoplankton, so <strong>the</strong>se results<br />
generally agree with <strong>the</strong> sediment data.<br />
Overall, <strong>the</strong> sediment core data shows that <strong>the</strong> sediments act as a source and sink for<br />
nutrients depending on <strong>the</strong> time <strong>of</strong> year. In August and September, <strong>the</strong> primary sediment source<br />
<strong>of</strong> phosphorus to <strong>Scargo</strong> <strong>Lake</strong> is not <strong>the</strong> deep sediments, but <strong>the</strong> intermediate sediments (4-8 m<br />
in depth). The deep sediments contribute 1.1 to 1.3 kg <strong>of</strong> TP during <strong>the</strong> summer, while <strong>the</strong><br />
shallower sediments (primarily from <strong>the</strong> 4-8 m depths) contribute 4.6 kg <strong>of</strong> TP. Given that <strong>the</strong><br />
deeper releases are generally prevented from impacting <strong>the</strong> shallower epilimnion waters, <strong>the</strong><br />
mid-depth sediment TP releases play more <strong>of</strong> a role in <strong>the</strong> overall water quality <strong>of</strong> <strong>the</strong> lake.<br />
These sediment results are generally consistent with <strong>the</strong> average TP concentrations in <strong>the</strong> pond<br />
water. Compared to o<strong>the</strong>r ponds with low dissolved oxygen concentrations, <strong>the</strong> <strong>Scargo</strong> <strong>Lake</strong><br />
deep sediments do not seem to be an overwhelming source <strong>of</strong> phosphorus; <strong>the</strong> annual phosphorus<br />
mass regenerated from <strong>the</strong> sediments is less than <strong>the</strong> annual contribution from wastewater or<br />
direct atmospheric contributions on <strong>the</strong> surface <strong>of</strong> <strong>the</strong> lake. The sediment data also collectively<br />
34
shows that <strong>the</strong> <strong>Scargo</strong> <strong>Lake</strong> system is, as would be expected, retaining phosphorus. The natural<br />
retention <strong>of</strong> phosphorus means that more will be available as <strong>the</strong> lake ages. The rate <strong>of</strong> this<br />
retention and rate <strong>of</strong> its release during <strong>the</strong> summer will play an important role in determining <strong>the</strong><br />
water quality and ecosystem status <strong>of</strong> <strong>Scargo</strong> <strong>Lake</strong>.<br />
IV.D. <strong>Scargo</strong> <strong>Lake</strong> Mussel Survey<br />
During July 2011, CSP/SMAST staff completed a visual mussel survey to determine <strong>the</strong><br />
distribution <strong>of</strong> freshwater mussel habitat. Many <strong>of</strong> <strong>the</strong> freshwater mussel species on Cape Cod<br />
are listed by <strong>the</strong> Massachusetts Natural Heritage Program as endangered species or species <strong>of</strong><br />
special concern, including <strong>the</strong> Tidewater Mucket (Leptodea ochracea) and Eastern Pondmussel<br />
(Ligumia nasuta) (www.mass.gov/dfwele/dfw/nhesp/species_info/mesa_list/mesa_list.htm).<br />
Staff recommended that a visual survey be completed due to experience in <strong>the</strong> <strong>Town</strong> <strong>of</strong><br />
Barnstable, where an alum treatment was delayed for over a year in order to address issues<br />
associated with Massachusetts Endangered Species Act (WRS, 2011). Staff recommended <strong>the</strong><br />
visual survey as a relatively lost cost approach to assess whe<strong>the</strong>r mussels would have to be a<br />
consideration in development <strong>of</strong> management strategies for <strong>Scargo</strong> <strong>Lake</strong>.<br />
Staff completed <strong>the</strong> mussel survey by collecting underwater video recordings <strong>of</strong> <strong>the</strong><br />
bottom sediments. The collected video was reviewed frame-by-frame for mussel valves and<br />
densities within each frame (Figure IV-8). Video tracks were not collected in depths greater<br />
than 12 m since mussels do not survive in <strong>the</strong>se areas due to <strong>the</strong>ir regular seasonal anoxia. It is<br />
clear from this survey that <strong>the</strong>re is an extensive freshwater mussel population in <strong>Scargo</strong> <strong>Lake</strong>. If<br />
management strategies are identified that involve disturbance <strong>of</strong> <strong>the</strong> bottom sediments, it is likely<br />
that a task to identify <strong>the</strong> freshwater mussel species will be needed.<br />
V. Ecological and Regulatory Status: Data Syn<strong>the</strong>sis and Nutrient Assessment<br />
V.A. Limiting nutrient: Phosphorus <strong>Management</strong> is Key<br />
<strong>Management</strong> <strong>of</strong> nutrients in freshwater lakes typically targets management <strong>of</strong><br />
phosphorus. Phosphorus is targeted because it is typically <strong>the</strong> most limited <strong>of</strong> <strong>the</strong> key plant<br />
nutrients; nitrogen and potassium being <strong>the</strong> o<strong>the</strong>r two nutrients. If this key nutrient increases, <strong>the</strong><br />
biomass in <strong>the</strong> lake will increase. This means that <strong>the</strong> key nutrient will spur plant population<br />
(typically phytoplankton) increases, clarity will drop, and more carbon will be retained in <strong>the</strong><br />
lake. This latter step generally leads to greater sediment bacteria growth and increased sediment<br />
oxygen demand. Of course this general description <strong>of</strong>ten becomes more complex as <strong>the</strong> pondspecific<br />
details are considered, especially in deep lakes where conditions on <strong>the</strong> surface may be<br />
acceptable while deep water conditions are anoxic and degraded. In order to assess whe<strong>the</strong>r<br />
phosphorus is <strong>the</strong> key management nutrient, <strong>the</strong> balance between phosphorus and nitrogen in <strong>the</strong><br />
pond water is reviewed. As a rule <strong>of</strong> thumb, if <strong>the</strong> ratio between nitrogen and phosphorus is<br />
greater than 16, phosphorus is <strong>the</strong> limiting nutrient (Redfield and o<strong>the</strong>rs, 1963).<br />
35
Figure IV-8. <strong>Scargo</strong> <strong>Lake</strong> Freshwater Mussel Survey.<br />
The distribution <strong>of</strong> freshwater mussels throughout <strong>Scargo</strong> <strong>Lake</strong> was determined by video survey<br />
along transect lines (black lines). The video record was reviewed frame-by-frame and mussel<br />
numbers recorded. The sizes <strong>of</strong> <strong>the</strong> red circles indicate number <strong>of</strong> mussel valves per frame (1, 2,<br />
or 3). Bathymetric contours (colors) are 2 m increments. Speciation <strong>of</strong> mussels was not<br />
included in <strong>the</strong> project tasks as it would have required special permits given that most freshwater<br />
mussels in Massachusetts are listed as endangered species or species <strong>of</strong> special concern by<br />
Massachusetts Natural Heritage. Sediments deeper than 8 m were not assayed as seasonal<br />
anoxia excludes <strong>the</strong>se areas as mussel habitat.<br />
36
The average summer (August/September) N:P ratio in <strong>the</strong> upper waters (0.5 m, 3 m, and<br />
9 m sampling depths) <strong>of</strong> <strong>Scargo</strong> <strong>Lake</strong> is 64. This is a slight drop from <strong>the</strong> limited (n=3) April<br />
readings where <strong>the</strong> average is 86 (Figure V-1). The change in <strong>the</strong> ratio is mostly due to a 18%<br />
decrease in total nitrogen (TN) concentrations, but is also accompanied by an slight (4%)<br />
increase in total phosphorus (TP). Deep readings also show phosphorus limitation (average<br />
summer N:P ratio is 71), but <strong>the</strong> relationships are slightly different. Deep summer TP<br />
concentrations increase by 67% compared to April reading and an 84% increase in TN<br />
concentrations. These changes suggest that TN in <strong>the</strong> upper waters is being transferred to <strong>the</strong><br />
deeper waters, which would also be consistent with <strong>the</strong> high phaeophytin concentrations<br />
measured deep in <strong>the</strong> lake (see Figure III-6). The review <strong>of</strong> <strong>the</strong>se ratios confirms that<br />
phosphorus is more limited than nitrogen in <strong>Scargo</strong> <strong>Lake</strong> and that management <strong>of</strong> phosphorus<br />
will directly impact water quality conditions.<br />
V.B. Phosphorus Sources: Budget <strong>of</strong> <strong>Water</strong>shed, External, and Internal P inputs<br />
Just as a water budget accounts for all <strong>the</strong> water coming into and leaving a pond, a<br />
phosphorus budget does <strong>the</strong> same for phosphorus and can be used to determine where<br />
management activities will have <strong>the</strong> most benefit to water quality and ecosystem function. As<br />
groundwater flows into Cape Cod ponds along <strong>the</strong> upgradient shoreline, it brings with it<br />
contaminants from <strong>the</strong> pond watershed, including phosphorus. Phosphorus is chemically more<br />
stable and biologically unavailable in well-oxygenated waters if it is bound with iron (Stumm<br />
and Morgan, 1981). Because <strong>of</strong> this, sandy aquifer systems (like <strong>the</strong> Cape), where iron coats <strong>the</strong><br />
sand particles within <strong>the</strong> aquifer, groundwater phosphorus from small sources, like septic<br />
systems, move very slowly (1.1-2.6 m/yr) (Robertson, 2008). In contrast, nitrogen, which is<br />
generally present in <strong>the</strong> Cape’s groundwater system in its fully-oxidized, nitrate form and is not<br />
attenuated once it is in <strong>the</strong> groundwater system, flows with <strong>the</strong> groundwater, which generally<br />
moves 1 ft/d (or 111 m/yr). Because <strong>of</strong> <strong>the</strong> comparatively slow movement <strong>of</strong> phosphorus, most<br />
<strong>of</strong> <strong>the</strong> sources <strong>of</strong> phosphorus entering Cape Cod ponds is from properties abutting <strong>the</strong> pond<br />
shoreline; previous analysis <strong>of</strong> Cape Cod ponds have focused on properties within 250 to 300 ft<br />
<strong>of</strong> <strong>the</strong> shoreline (e.g., Eichner and o<strong>the</strong>rs, 2006; Eichner, 2007; Eichner, 2008).<br />
The phosphorus loading assessment included in this report is an update <strong>of</strong> <strong>the</strong> assessment<br />
detailed in Eichner (2009) and benefits from <strong>the</strong> refinements completed by <strong>the</strong> <strong>Town</strong> (Eichner<br />
and Howes, 2012), as well as work in progress on <strong>the</strong> Massachusetts Estuaries Project<br />
assessment <strong>of</strong> Sesuit Harbor. This refined <strong>Scargo</strong> <strong>Lake</strong>-specific information allowed for a more<br />
refined understanding <strong>of</strong> phosphorus loads from <strong>the</strong>se sources and, directly, a better set <strong>of</strong> water<br />
quality management options.<br />
V.B.1. External Sources: Wastewater/Septic Systems Phosphorus<br />
The Eichner (2009) loading assessment was completed with <strong>the</strong> assistance <strong>Dennis</strong><br />
volunteers who reviewed town Board <strong>of</strong> Health records <strong>of</strong> properties within 300 ft <strong>of</strong> <strong>the</strong> pond<br />
shoreline to determine <strong>the</strong> distance from <strong>the</strong> pond shoreline to septic system leachfields, pits and<br />
cesspools. During this review, information on <strong>the</strong> age <strong>of</strong> <strong>the</strong> wastewater systems and <strong>the</strong> age <strong>of</strong><br />
<strong>the</strong> buildings connected to <strong>the</strong>se systems were also collected. SMAST and <strong>Town</strong> staff assisted<br />
<strong>the</strong> volunteers during <strong>the</strong> review <strong>of</strong> <strong>the</strong> records by preparing maps and accompanying<br />
spreadsheets listing all parcels within or partially within <strong>the</strong> 300 ft buffer. Project staff also<br />
encouraged volunteers to note large potential nutrient sources outside <strong>of</strong> <strong>the</strong> 300 ft buffer area, as<br />
37
180<br />
160<br />
155<br />
140<br />
120<br />
N:P ratio<br />
100<br />
80<br />
86<br />
85<br />
74<br />
81<br />
65 64<br />
97<br />
67<br />
0.5/3/9 m<br />
DEEP<br />
60<br />
40<br />
42<br />
20<br />
0<br />
April July August September October<br />
Figure V-1. Average Monthly Nitrogen to Phosphorus Ratios in <strong>Scargo</strong> <strong>Lake</strong>.<br />
Readings are shown for April, July, August, September and October. All averages are based on at least two readings; August and<br />
September averages are based on 6-8 readings. All averages are multiples greater than <strong>the</strong> Redfield ratio <strong>of</strong> 16, indicating that <strong>the</strong> lake<br />
is consistently phosphorus limited and that control <strong>of</strong> phosphorus will restore water quality.<br />
38
well as seeking out historic information on past land uses that might still have some impacts on<br />
<strong>the</strong> currently observed water quality in <strong>the</strong> six selected ponds.<br />
Phosphorus loads were developed for each <strong>of</strong> <strong>the</strong> properties within 300 ft <strong>of</strong> <strong>the</strong> shoreline<br />
and located on <strong>the</strong> upgradient side <strong>of</strong> <strong>Scargo</strong> <strong>Lake</strong>. Aerial photographs <strong>of</strong> <strong>the</strong> properties were<br />
reviewed and non-wastewater loads were only assigned to developed properties with houses or<br />
o<strong>the</strong>r structures. For <strong>the</strong> purposes <strong>of</strong> reviewing wastewater sources, all septic system discharge<br />
structures on upgradient properties within <strong>the</strong> 300 ft buffer were included in <strong>the</strong> calculations.<br />
The wastewater phosphorus loading factors used in <strong>the</strong> assessment are listed in Table V-1 and<br />
details <strong>of</strong> <strong>the</strong> development <strong>of</strong> <strong>the</strong> factors are discussed in Eichner (2009).<br />
Based on this land use review, <strong>the</strong>re are 21 properties within <strong>the</strong> watershed and along <strong>the</strong><br />
upgradient shoreline <strong>of</strong> <strong>Scargo</strong> <strong>Lake</strong> (Figure V-2). Of <strong>the</strong> 21 properties, 12 <strong>of</strong> <strong>the</strong>m are single<br />
family residences, one is a multi-family residence, three are undeveloped, and four are owned by<br />
<strong>the</strong> <strong>Town</strong> <strong>of</strong> <strong>Dennis</strong>. Three <strong>of</strong> <strong>the</strong> town owned properties are owned by <strong>the</strong> Conservation<br />
Commission and two <strong>of</strong> <strong>the</strong>m have beaches: <strong>Scargo</strong> Beach and Princess Beach. Nine <strong>of</strong> <strong>the</strong> 12<br />
single family residences are connected to <strong>the</strong> municipal water supply and have 2007 water use<br />
from <strong>the</strong> <strong>Dennis</strong> <strong>Water</strong> District.<br />
Table V-1. <strong>Water</strong>shed/External Phosphorus Loading Factors<br />
Listed below are factors used in <strong>the</strong> development <strong>of</strong> <strong>the</strong> phosphorus budget for watershed and<br />
external phosphorus loading sources to <strong>Scargo</strong> <strong>Lake</strong>.<br />
Factor Value Units Source<br />
Wastewater P load 1 lb P/septic system MEDEP, 1989 load<br />
Groundwater P<br />
velocity/solute<br />
25 - 37<br />
Robertson, 2008<br />
retardation factor<br />
velocity<br />
Road surface P load 0.02 kg TP/yr<br />
Ro<strong>of</strong> surface P load 0.6 - 1.5 kg/ha<br />
Pond surface P load 0.05 - 0.14 kg/ha<br />
<strong>Scargo</strong> <strong>Lake</strong> measured (Eichner<br />
and Howes, 2012)<br />
Waschbusch, et al. (1999); CSN<br />
(2011)<br />
Literature review detailed in<br />
Eichner (2009)<br />
Recharge Rate 27.25 in/yr Walter and Whealan, 2005<br />
Precipitation Rate 44.8 in/yr Walter and Whealan, 2005<br />
Building Area 2,000 ft2 Eichner and Cambareri, 1992<br />
Lawn area 5,000 ft2 per residence Eichner and Cambareri, 1992<br />
Lawn fertilizer lawn<br />
load<br />
0.02 - 0.3 lb P/ac<br />
<strong>Water</strong>fowl net P load 0.57 kg/yr<br />
Literature review detailed in<br />
Eichner (2009)<br />
<strong>Scargo</strong> <strong>Lake</strong> bird counts and<br />
Scherer, et al., 1995<br />
39
<strong>Town</strong> boat<br />
ramp<br />
300 ft<br />
buffer<br />
<strong>Water</strong>shed<br />
Figure V-2. <strong>Scargo</strong> <strong>Lake</strong> Parcels within 300 ft Buffer.<br />
The 300 ft buffer around <strong>Scargo</strong> <strong>Lake</strong> is shown in orange with parcel outlines also shown in<br />
orange. Based on phosphorus travel time, only parcels within <strong>the</strong> 300 ft buffer and within <strong>the</strong><br />
sou<strong>the</strong>rn purple lines are contributing phosphorus to <strong>the</strong> lake. These parcels were included in <strong>the</strong><br />
<strong>Scargo</strong> <strong>Lake</strong> watershed phosphorus budget, which also includes a review <strong>of</strong> ages <strong>of</strong> house, ages<br />
<strong>of</strong> septic system, and distances <strong>of</strong> septic system leachfields to <strong>the</strong> pond shoreline. The only<br />
parcel on <strong>the</strong> nor<strong>the</strong>rn side <strong>of</strong> <strong>the</strong> pond that is estimated to contribute measurable phosphorus is<br />
<strong>the</strong> town boat ramp <strong>of</strong>f Route 6A (indicated by red circle).<br />
40
Five <strong>of</strong> <strong>the</strong> single family residences have septic system leachfields within 300 ft <strong>of</strong> <strong>the</strong><br />
pond shoreline, while six do not have enough detail in <strong>the</strong>ir Board <strong>of</strong> Health records to determine<br />
<strong>the</strong> distance. Of <strong>the</strong> systems with estimated distances, <strong>the</strong> average distance for <strong>the</strong>se leachfields<br />
is 222 feet from <strong>the</strong> pond shore and <strong>the</strong> average age <strong>of</strong> <strong>the</strong> leachfields is 25 years old. In<br />
contrast, <strong>the</strong> average age <strong>of</strong> <strong>the</strong> houses is 54 years old. Average Title 5 design for <strong>the</strong> all 12<br />
single family residential systems is 440 gallons per day (gpd) (or four bedrooms), which equates<br />
to a total design flow <strong>of</strong> 5,280 gpd. In contrast, <strong>the</strong> total 2007 water use for <strong>the</strong> nine single<br />
family residences with water use is 1,868 gpd.<br />
Based on <strong>the</strong> age <strong>of</strong> <strong>the</strong> septic systems, distance to <strong>the</strong> pond, and <strong>the</strong> range <strong>of</strong> retention<br />
factors discussed above, six to ten <strong>of</strong> <strong>the</strong> single family residences are likely currently<br />
contributing phosphorus to <strong>the</strong> pond, but based on <strong>the</strong> age <strong>of</strong> <strong>the</strong> houses ten <strong>of</strong> <strong>the</strong> 12 would be<br />
contributing. An additional consideration in this assessment is whe<strong>the</strong>r <strong>the</strong> newer septic systems<br />
are in different groundwater flowpaths than <strong>the</strong> ones <strong>the</strong>y replaced; if <strong>the</strong>y are <strong>the</strong> age <strong>of</strong> <strong>the</strong><br />
septic systems is more important than <strong>the</strong> age <strong>of</strong> <strong>the</strong> houses in determine <strong>the</strong> wastewater<br />
component <strong>of</strong> <strong>the</strong> phosphorus load. Wastewater loading from all properties is estimated at<br />
between 3.6 and 5.4 kg/y. At steady-state or assuming all septic systems are contributing<br />
phosphorus to <strong>the</strong> lake, septic systems are estimated to contribute 5.9 kg <strong>of</strong> phosphorus per year.<br />
V.B.2. External Sources: Lawn Fertilizer Phosphorus<br />
Reviews <strong>of</strong> fertilizer application rates on Cape Cod have generally found that<br />
homeowners do not fertilize lawns as frequently as recommended by lawn care guidelines unless<br />
commercial companies tend <strong>the</strong> lawns [see Howes and o<strong>the</strong>rs (2007) for summary]. A multitown<br />
survey also found that approximately half <strong>of</strong> Cape Codders do not use lawn fertilizers at all<br />
(White, 2003). MEDEP (1989) uses a fertilizer load from residences <strong>of</strong> 0.3 pounds per acre and<br />
this rate has been used in o<strong>the</strong>r Cape Cod pond phosphorus budgets (e.g., Eichner, 2007).<br />
Available research shows a wide range <strong>of</strong> phosphorus loads assigned to residential lawns.<br />
For example, Erickson and o<strong>the</strong>rs (2005) tested phosphorus application rates on mixed turf and<br />
monoculture lawns for nearly four years. These studies found that leaching rates stabilized<br />
around 35% with average loading rates 33.7 and 20.3 lbs/ac, respectively. Conversely, Sharma<br />
and o<strong>the</strong>rs (1996) evaluated phosphorus concentrations in recharge under urban lawn areas and<br />
found concentrations equivalent to loading rates between 0.02 and 0.2 lbs/ac. Rhode Island<br />
DEM has developed a phosphorus loading model based on various land uses (Kellogg and<br />
o<strong>the</strong>rs, 2006). This model uses a range <strong>of</strong> 0 to 4.5 lbs/ac depending on <strong>the</strong> land use and <strong>the</strong> soil<br />
types and assigns a range <strong>of</strong> 0.6 to 0.7 lb/ac to <strong>the</strong> cumulative phosphorus load <strong>of</strong> low density<br />
residential development. Given that residential fertilization practices appear to favor low annual<br />
application rates, project staff completed <strong>the</strong> phosphorus budgets for <strong>Scargo</strong> <strong>Lake</strong> using a range<br />
<strong>of</strong> rates: 0.02 to 0.3 lbs/ac. Using <strong>the</strong>se rates, lawns within 300 ft <strong>of</strong> <strong>Scargo</strong> <strong>Lake</strong> annually add<br />
between 0.01 and 0.2 kg <strong>of</strong> phosphorus to <strong>the</strong> lake.<br />
V.B.3. O<strong>the</strong>r External Phosphorus Sources: Ro<strong>of</strong>s, Precipitation, Birds, Roads<br />
As detailed in Eichner and Howes (2012), part <strong>of</strong> <strong>the</strong> recent <strong>Town</strong> assessment activities<br />
have directly measured <strong>the</strong> <strong>Scargo</strong> <strong>Lake</strong>-specific phosphorus inputs from birds (Section IV.A)<br />
and stormwater road run<strong>of</strong>f (Section IV.B). The direct measurement <strong>of</strong> <strong>the</strong>se sources indicates<br />
that <strong>the</strong>y contribute 0.57 kg/yr and 0.02 kg/yr <strong>of</strong> phosphorus, respectively, to <strong>Scargo</strong> <strong>Lake</strong>.<br />
41
Two o<strong>the</strong>r sources that must rely on available research are ro<strong>of</strong> run<strong>of</strong>f and precipitation<br />
directly on <strong>the</strong> surface <strong>of</strong> <strong>the</strong> lake. These two sources are related because both are capturing<br />
precipitation, although <strong>the</strong> ro<strong>of</strong> area is somewhat more complicated by whe<strong>the</strong>r <strong>the</strong> ro<strong>of</strong> run<strong>of</strong>f is<br />
subject to any treatment, whe<strong>the</strong>r <strong>the</strong>re is leach <strong>of</strong> phosphorus from <strong>the</strong> ro<strong>of</strong>ing material, and<br />
whe<strong>the</strong>r any additional phosphorus is deposited on <strong>the</strong> ro<strong>of</strong> from birds or dry deposition.<br />
Previous pond phosphorus budgets on Cape Cod (e.g., Eichner, 2008) have used a 0.14 kilogram<br />
per hectare (kg/ha) phosphorus load on <strong>the</strong> pond surfaces and 3.9 kg/ha based on MEDEP (1989)<br />
phosphorus loading guidance. The precipitation rate is largely based on a 0.14 mg/l TP<br />
concentration assigned to precipitation in <strong>the</strong> diagnostic/feasibility study <strong>of</strong> Hamblin Pond in<br />
Barnstable (BEC, 1993). Subsequent reviews <strong>of</strong> phosphorus in precipitation have resulted in<br />
loads ranging from 0.05 kg/ha (Cadmus, 2007) to 0.35 kg/ha (Hendry and Brezonik, 1980). In<br />
Cape Cod ponds with little or no development around <strong>the</strong>m, where surface precipitation would<br />
be expected to be <strong>the</strong> predominant source <strong>of</strong> phosphorus, review <strong>of</strong> <strong>the</strong>ir TP concentrations<br />
suggest that <strong>the</strong> lower surface loading rates are more appropriate for Cape Cod ponds. Based on<br />
this, <strong>the</strong> <strong>Scargo</strong> <strong>Lake</strong> phosphorus budget uses a phosphorus load <strong>of</strong> between 0.05 and 0.14 kg/ha<br />
for phosphorus loading on <strong>the</strong> surface <strong>of</strong> <strong>the</strong> lake. Given <strong>the</strong> area <strong>of</strong> <strong>the</strong> lake, this range <strong>of</strong> loads<br />
results in an annual load on <strong>the</strong> surface <strong>of</strong> <strong>Scargo</strong> <strong>Lake</strong> <strong>of</strong> between 1.2 and 3.4 kg <strong>of</strong> TP.<br />
Measurements <strong>of</strong> total phosphorus in ro<strong>of</strong> run<strong>of</strong>f generally show very large ranges, which<br />
tends to confirm <strong>the</strong> role <strong>of</strong> a number <strong>of</strong> factors. However, more recent literature searches have<br />
indicated that <strong>the</strong> MEDEP (1989) guidance is likely too high. Waschbusch and o<strong>the</strong>rs (1999)<br />
found median TP concentrations <strong>of</strong>f pitched ro<strong>of</strong>s varied between 0.06 mg/l and 0.15 mg/l.<br />
Chesapeake Bay draft guidance suggests that 0.12 mg/l TP is an appropriate concentration for<br />
ro<strong>of</strong> run<strong>of</strong>f (Chesapeake Stormwater Network, 2011). In <strong>the</strong> development <strong>of</strong> <strong>the</strong> <strong>Scargo</strong> <strong>Lake</strong><br />
phosphorus loading in this report, staff used <strong>the</strong> Waschbusch and o<strong>the</strong>rs (1999) range since it<br />
seemed to include most <strong>of</strong> <strong>the</strong> reported concentrations that were reviewed; <strong>the</strong>se translate to 0.61<br />
to 1.52 kg/ha TP. Given <strong>the</strong> ro<strong>of</strong> area <strong>of</strong> <strong>the</strong> houses within 300 feet <strong>of</strong> <strong>the</strong> lake and within its<br />
watershed, this range <strong>of</strong> loads results in an annual ro<strong>of</strong> run<strong>of</strong>f load to <strong>Scargo</strong> <strong>Lake</strong> <strong>of</strong> between<br />
0.07 and 0.17 kg <strong>of</strong> TP.<br />
V.B.4. External Sources: <strong>Water</strong>shed Phosphorus Budget<br />
Using <strong>the</strong> directly measured phosphorus data, watershed-specific information for <strong>Scargo</strong><br />
<strong>Lake</strong>, and <strong>the</strong> factors in Table V-1, <strong>the</strong> total watershed/external phosphorus load to <strong>Scargo</strong> <strong>Lake</strong><br />
is between 5.5 and 9.8 kg/yr (Figure V-3). Wastewater is <strong>the</strong> majority <strong>of</strong> this load, varying<br />
between 55% and 66% <strong>of</strong> <strong>the</strong> total load depending largely on <strong>the</strong> travel time <strong>of</strong> phosphorus from<br />
leachfields to <strong>the</strong> lake. The second largest load is from atmospheric deposition, which is largely<br />
uncontrollable for local management purposes.<br />
These estimates agree very well with average measured phosphorus mass in <strong>the</strong> lake.<br />
Average late summer (August and September) phosphorus mass in <strong>the</strong> upper 9 m <strong>of</strong> <strong>Scargo</strong> <strong>Lake</strong><br />
is 16 kg (±5 sd). In order to compare this number to <strong>the</strong> estimated watershed/external<br />
phosphorus load, <strong>the</strong> estimated load should be adjusted by <strong>the</strong> 2.4 year average residence time.<br />
This adjustment results in an estimated annual watershed load <strong>of</strong> 7 kg or roughly <strong>the</strong> mid-point<br />
<strong>of</strong> <strong>the</strong> external load. This comparison shows that, on average, <strong>the</strong> summer phosphorus<br />
concentrations are largely determined by watershed contributions, although some <strong>of</strong> <strong>the</strong> higher<br />
42
low = 5.5 kg/y<br />
high = 9.8 kg/y<br />
wastewater<br />
fertilizer<br />
ro<strong>of</strong> run<strong>of</strong>f<br />
22%<br />
35%<br />
road run<strong>of</strong>f<br />
birds<br />
surface precip<br />
10%<br />
67%<br />
55%<br />
0%<br />
1%<br />
0%<br />
6%<br />
0%<br />
2%<br />
2%<br />
Figure V-3. <strong>Scargo</strong> <strong>Lake</strong> External/<strong>Water</strong>shed Phosphorus Budget.<br />
The above pie diagrams show <strong>the</strong> high and low watershed estimates <strong>of</strong> external sources <strong>of</strong> phosphorus entering <strong>Scargo</strong> <strong>Lake</strong>. These<br />
estimates include <strong>the</strong> lake-specific measurements <strong>of</strong> road run<strong>of</strong>f and bird counts. Wastewater is <strong>the</strong> primary source <strong>of</strong> watershed<br />
phosphorus; wastewater loading estimates vary between 3.6 and 5.4 kg annually. Variations are based on age <strong>of</strong> leachfields and<br />
houses, as well as velocity <strong>of</strong> phosphorus travel in <strong>the</strong> groundwater system. Most <strong>of</strong> <strong>the</strong> rest <strong>of</strong> <strong>the</strong> variability is due to <strong>the</strong> range <strong>of</strong><br />
phosphorus concentrations assigned to <strong>the</strong> surface precipitation.<br />
43
masses <strong>of</strong> TP measured in <strong>the</strong> water column suggest that deep sediment regeneration<br />
occasionally impacts <strong>the</strong> surface waters.<br />
V.C. Internal Phosphorus Inputs and Discharges: Sediment Nutrient Regeneration and Stream<br />
Outflow<br />
As noted in Section IV.C., CSP/SMAST staff collected and incubated sediment cores to<br />
evaluate nutrient regeneration from <strong>the</strong> sediments under oxidizing and reducing conditions.<br />
Evaluations <strong>of</strong> <strong>the</strong> summer aerobic incubation results noted that shallow sediments have a net<br />
uptake <strong>of</strong> TP and intermediate sediments have a net release <strong>of</strong> TP, which cumulatively result in<br />
4.6 kg addition to <strong>the</strong> pond during a four month summer. This rate fits within <strong>the</strong> observed<br />
variability <strong>of</strong> <strong>the</strong> summer phosphorus mass measured in <strong>the</strong> pond. Review <strong>of</strong> <strong>the</strong> anaerobic<br />
incubations, which would correspond to <strong>the</strong> deep water, low oxygen conditions, show that 1.1 to<br />
1.3 kg is released from <strong>the</strong> deep sediments during <strong>the</strong> summer, but review <strong>of</strong> <strong>the</strong> DO and TP<br />
readings suggest that this release does not impact <strong>the</strong> upper waters during <strong>the</strong> summer. During<br />
<strong>the</strong> winter, <strong>the</strong> intermediate and deep sediments have a net uptake <strong>of</strong> TP, while <strong>the</strong> shallow<br />
sediments are in balance. Based on <strong>the</strong> core incubations, <strong>the</strong>se sediments collectively adsorb 12<br />
kg TP over a four month winter.<br />
Based on <strong>the</strong> measured streamflow and average summer surface TP concentrations, 1.3<br />
kg (±0.4 kg) leaves <strong>Scargo</strong> <strong>Lake</strong> during a four month summer. The streamflow information was<br />
ga<strong>the</strong>red as part <strong>of</strong> <strong>the</strong> Massachusetts Estuaries Project (Howes and o<strong>the</strong>rs, in preparation). The<br />
gauge is located on <strong>the</strong> east side <strong>of</strong> Route 6A, approximately 0.2 miles downstream <strong>of</strong> <strong>Scargo</strong><br />
<strong>Lake</strong>. Flow corrections were made to determine <strong>the</strong> watershed between <strong>the</strong> gauge and <strong>the</strong> lake,<br />
so that outflow calculations account for only <strong>the</strong> flow leaving <strong>the</strong> lake. Winter water quality<br />
samples are very limited in <strong>the</strong> water quality dataset (i.e., two November readings), so<br />
calculation <strong>of</strong> a year-round outflow is somewhat speculative. Average surface TP concentrations<br />
over <strong>the</strong> whole available dataset slightly increase a four month outflow mass to 1.4 kg.<br />
V.D. Overall Phosphorus Budget<br />
Collectively, <strong>the</strong> summer phosphorus loads appears to balance. Annual watershed inputs<br />
are estimated to be 5.5 to 9.8 kg, which are 1.8 to 3.3 kg for a four month summer. The stream<br />
outflow is 1.1 to 1.3 kg and <strong>the</strong> intermediate sediments are adding 4.6 kg (±14%). The sum <strong>of</strong><br />
<strong>the</strong>se loads range from 4.5 to 7.4, which balances with <strong>the</strong> range <strong>of</strong> masses in <strong>the</strong> epilimnion <strong>of</strong><br />
<strong>the</strong> lake. Winter sediment core results suggest that phosphorus concentrations during <strong>the</strong> winter<br />
should be lower as <strong>the</strong> intermediate sediments adsorb phosphorus, but winter water quality data<br />
is not available to assess this. Absorption <strong>of</strong> phosphorus would be consistent <strong>the</strong> general idea<br />
that wetlands, including lakes, retain nutrients and, over time, gradually collect more<br />
phosphorus.<br />
The phosphorus budget also establishes that <strong>the</strong> summer low oxygen conditions and<br />
phosphorus regeneration in <strong>the</strong> hypolimnion are somewhat separate from <strong>the</strong> upper epilimnion.<br />
However, <strong>the</strong> regular and pervasive deep anoxia establishes conditions where, if <strong>the</strong>y worsen<br />
even slightly and begin to interact with <strong>the</strong> upper warm layer, <strong>the</strong>y will provide a new source <strong>of</strong><br />
phosphorus to <strong>the</strong> phytoplankton in that layer leading to decrease clarity and higher chlorophyll<br />
and total phosphorus concentrations.<br />
44
V.E. Overall <strong>Scargo</strong> <strong>Lake</strong> Status and Discussion<br />
Review <strong>of</strong> surface water conditions in <strong>Scargo</strong> <strong>Lake</strong> show conditions that are acceptable<br />
for swimming and o<strong>the</strong>r contact recreation. There has been no evidence <strong>of</strong> extensive algal<br />
blooms, blue-green algal blooms or fish kills; conditions that have impacted o<strong>the</strong>r Cape Cod<br />
ponds such as Hinckleys Pond in Harwich, Mystic <strong>Lake</strong> in Barnstable, and Long Pond in<br />
Brewster/Harwich. Total phosphorus and chlorophyll concentrations are a bit elevated, but not<br />
exceptionally high.<br />
However, deeper in <strong>Scargo</strong> <strong>Lake</strong> are conditions that raise concerns about its quality and<br />
its future surface water quality. April data, <strong>the</strong> earliest in <strong>the</strong> year that is available, shows that<br />
sediment oxygen demand has already begun to consume oxygen from overlying waters. These<br />
conditions persist and slowly worsen throughout <strong>the</strong> summer, eventually reaching up to <strong>the</strong><br />
bottom <strong>of</strong> <strong>the</strong> warm surface water layer and, on occasion, into <strong>the</strong> surface water layer. Review <strong>of</strong><br />
collected water quality data shows that <strong>the</strong>se low oxygen conditions release phosphorus, but that<br />
residual oxygen concentrations generally persist between <strong>the</strong> warm epilimnion and <strong>the</strong> cold<br />
hypolimnion. These DO concentrations are high enough in <strong>the</strong> upper portions <strong>of</strong> <strong>the</strong> cold layer<br />
that extensive algal blooms are not initiated. Sediments are a significant source <strong>of</strong> phosphorus to<br />
<strong>the</strong> pond, but <strong>the</strong>re is no indication that deep low oxygen conditions and <strong>the</strong> deepest sediments<br />
seeping into <strong>the</strong> upper waters in a significant mass. Chlorophyll readings show that<br />
phytoplankton are growing more extensively at <strong>the</strong> low oxygen boundary, but <strong>the</strong>se do not seem<br />
to be impacting concentrations in <strong>the</strong> waters above <strong>the</strong>m. Review <strong>of</strong> sediment data shows that<br />
<strong>the</strong> pond is collecting more phosphorus each year and it is likely that this will gradually worsen<br />
dissolved oxygen conditions over time. There is, however, no discernible trend <strong>of</strong> worsening<br />
dissolved oxygen conditions over <strong>the</strong> past 10 years.<br />
Review <strong>of</strong> potential next steps for <strong>the</strong> management <strong>of</strong> <strong>Scargo</strong> <strong>Lake</strong> largely depends on <strong>the</strong><br />
regulatory criteria that are used to judge its water quality conditions and <strong>the</strong> advocacy to act<br />
proactively. Massachusetts regulatory standards for surface waters require dissolved oxygen<br />
concentrations in lakes with cold water fisheries to have dissolved oxygen (DO) concentrations<br />
<strong>of</strong> 6 ppm or above (314 CMR 4.05(3)(b)1). These waters are “designated as a habitat for fish,<br />
o<strong>the</strong>r aquatic life, and wildlife, including for <strong>the</strong>ir reproduction, migration, growth and o<strong>the</strong>r<br />
critical functions, and for primary and secondary contact recreation.” As shown in <strong>the</strong> DO<br />
pr<strong>of</strong>iles, <strong>the</strong> cold water fishery in <strong>Scargo</strong> <strong>Lake</strong> (i.e., <strong>the</strong> hypolimnion) regularly has DO<br />
concentrations below 6 ppm throughout <strong>the</strong> summer. <strong>Water</strong> quality conditions in <strong>Scargo</strong> <strong>Lake</strong><br />
meet all <strong>of</strong> <strong>the</strong> o<strong>the</strong>r provisions <strong>of</strong> <strong>the</strong> surface water regulations, including: temperature, pH,<br />
bacteria, solids, color and turbidity, oil and grease, and taste and color. Review <strong>of</strong> <strong>the</strong> Secchi<br />
readings show that <strong>the</strong> minimum recorded clarity is safe for swimming.<br />
Based on <strong>the</strong> regulatory DO criterion, it is likely that MassDEP would require a TMDL<br />
for <strong>Scargo</strong> <strong>Lake</strong> under <strong>the</strong> Clean <strong>Water</strong> Act and, eventually, some sort <strong>of</strong> management actions to<br />
attain <strong>the</strong> TMDL. The oxygen demand in <strong>the</strong> sediments is driven by carbon loading, which is<br />
ultimately controlled by phosphorus loading. Given that phosphorus is <strong>the</strong> nutrient controlling<br />
water quality in <strong>the</strong> lake, <strong>the</strong> TMDL would likely be targeted at total phosphorus. What <strong>the</strong><br />
target would be, however, would likely require some negotiations with MassDEP.<br />
45
No TP TMDLs have been developed by MassDEP for deep water lakes within <strong>the</strong> <strong>Scargo</strong><br />
<strong>Lake</strong> Ecoregion (i.e., sou<strong>the</strong>rn Plymouth, Cape Cod, Martha’s Vineyard and Nantucket). The<br />
review <strong>of</strong> <strong>the</strong> 2001 PALS Snapshot data by <strong>the</strong> Cape Cod Commission (Eichner and o<strong>the</strong>rs,<br />
2003) suggested that a target TP concentration range for Cape Cod ponds should be between 7.5<br />
and 10 ppb. Average late summer surface TP concentrations in <strong>Scargo</strong> <strong>Lake</strong> in <strong>the</strong> waters less<br />
than 9 m are 10.3 ppb, while <strong>the</strong> deepest waters average 22.9 ppb. The shallow concentration<br />
suggests that <strong>the</strong> TP should be lower than 10 ppb, but only one pond is listed by MassDEP as<br />
having a TMDL less than 10 ppb TP and that is based on a modeling exercise where MassDEP<br />
approved 28 TMDLs in <strong>the</strong> Millers River watershed (MassDEP, 2003). In order to achieve 7.5<br />
ppb TP, <strong>the</strong> average mass <strong>of</strong> TP in <strong>the</strong> upper waters <strong>of</strong> <strong>Scargo</strong> <strong>Lake</strong> would need to be reduced<br />
from 16 kg to 9.8 kg. In order to meet 9.8 kg, <strong>the</strong> annual watershed load would need to be<br />
reduced by 3 kg.<br />
The largest controllable load entering <strong>Scargo</strong> <strong>Lake</strong> from its watershed is wastewater (see<br />
Figure V-3). If wastewater alone was targeted for <strong>the</strong> potential phosphorus reduction,<br />
wastewater phosphorus loads would need to be reduced 55 to 83%. No o<strong>the</strong>r single controllable<br />
source could attain <strong>the</strong> 3 kg reduction. However, since wastewater phosphorus takes decades to<br />
reach <strong>Scargo</strong> <strong>Lake</strong>, immediate reductions in wastewater phosphorus would address <strong>the</strong> long term<br />
maintenance <strong>of</strong> appropriate TP loads, but would not address <strong>the</strong> MassDEP DO criterion.<br />
The goal in addressing <strong>the</strong> MassDEP DO criteria can likely be met by establishing some<br />
stable trout habitat; not <strong>the</strong> whole <strong>the</strong> cold water layer, but some portion. If a layer <strong>of</strong> cold water<br />
with a stable DO concentration above 6 ppm can be sustained throughout <strong>the</strong> summer, it will<br />
provide some trout habitat, as well as providing added protection for <strong>the</strong> warm, upper waters <strong>of</strong><br />
<strong>the</strong> lake from regenerated deep water phosphorus. A number <strong>of</strong> options could be deployed to<br />
attain <strong>the</strong> creation <strong>of</strong> this layer, but <strong>the</strong> ones most commonly considered and deployed are: 1)<br />
sediment removal, 2) phosphorus inactivation, and 3) injection <strong>of</strong> oxygen. Project staff reviewed<br />
each <strong>of</strong> <strong>the</strong>se for <strong>the</strong>ir applicability to <strong>Scargo</strong> <strong>Lake</strong>.<br />
Removal <strong>of</strong> <strong>the</strong> sediments would remove <strong>the</strong> sediment oxygen demand and restore <strong>the</strong><br />
lake to conditions that existed before any monitoring occurred. However, sediment removal is<br />
technically complicated and difficult to permit. Sediment removal has not been used extensively<br />
in Massachusetts and does not appear to ever have been used on Cape Cod (MassDEP/<br />
MassDCR, 2004). Removal <strong>of</strong> sediments in <strong>of</strong>f-Cape lakes typically is accompanied by a<br />
drawdown in <strong>the</strong> level <strong>of</strong> <strong>the</strong> lake, so sediments can be more easily accessed. In an unconfined<br />
aquifer system like <strong>the</strong> Cape, <strong>the</strong> water level <strong>of</strong> a lake is typically an expression <strong>of</strong> <strong>the</strong><br />
groundwater level, i.e. an open, exposed portion <strong>of</strong> <strong>the</strong> water table. As such, a drawdown <strong>of</strong> a<br />
lake on <strong>the</strong> Cape would have to be sustained by pumping large volumes <strong>of</strong> water, as <strong>the</strong> aquifer<br />
surrounding <strong>the</strong> lake would flow to <strong>the</strong> lake to try to match <strong>the</strong> surrounding water levels. For<br />
this reason, sediment removal in <strong>Scargo</strong> <strong>Lake</strong> would require dredging. Dredging is not typically<br />
considered in lakes deeper than 25 ft and development <strong>of</strong> a dredging plan would require at <strong>the</strong><br />
very least securing a dewatering area, securing a sediment disposal location, testing <strong>of</strong> <strong>the</strong><br />
sediments for metals and hydrocarbons, and accommodations to protect/restore <strong>the</strong> mussel<br />
population. This effort would also require difficult permitting with both state agencies and local<br />
boards. For <strong>the</strong>se reasons, staff would not recommend dredging <strong>of</strong> <strong>Scargo</strong> <strong>Lake</strong> sediments.<br />
46
Although phosphorus inactivation is not needed for <strong>the</strong> bottom sediments, <strong>the</strong> same<br />
techniques could be used to remove phosphorus from <strong>the</strong> water column and create a s<strong>of</strong>t barrier<br />
over <strong>the</strong> sediments to limit oxygen demand. Phosphorus inactivation is typically attained by<br />
adding salts <strong>of</strong> aluminum, iron, or calcium that chemically bind with <strong>the</strong> phosphorus and form<br />
solid precipitates that sink to <strong>the</strong> bottom <strong>of</strong> <strong>the</strong> pond. Alum precipitates/solids are not sensitive<br />
to redox conditions, so it can be used in anoxic settings. Typically, iron is not added in Cape<br />
ponds with hypoxia because <strong>the</strong>re is usually already sufficient iron present, but <strong>the</strong> low oxygen is<br />
preventing it from binding <strong>the</strong> phosphorus and forming solids; more iron will not resolve this<br />
solubility issue. Calcium is similarly not used because <strong>the</strong> low pHs naturally found in Cape<br />
ponds will prevent precipitation <strong>of</strong> calcium-phosphorus solids; calcium precipitates are more<br />
chemically favored at pH’s above 8 (Stumm and Morgan, 1981). For <strong>the</strong>se reasons, Cape Cod<br />
water conditions typically favor application <strong>of</strong> aluminum for phosphorus inactivation.<br />
Alum applications, typically a mix <strong>of</strong> aluminum sulfate and sodium aluminate, have been<br />
used at a number <strong>of</strong> Cape Cod ponds: Ashumet Pond in Mashpee/Falmouth, Hamblin Pond and<br />
Mystic <strong>Lake</strong> in Barnstable, Long Pond in Brewster/Harwich, and Lovers <strong>Lake</strong>/Stillwater Pond in<br />
Chatham. Follow-up monitoring <strong>of</strong> each <strong>of</strong> <strong>the</strong>se applications has generally showed reduced<br />
phosphorus regeneration and reduced sediment oxygen demand. The Hamblin Pond treatment,<br />
which occurred in May 1995, increased dissolved oxygen concentrations above <strong>the</strong> MassDEP 6<br />
ppm threshold for 4 meters worth <strong>of</strong> water that was anoxic prior to <strong>the</strong> treatment and this<br />
restoration was sustained through at least 2006 (Eichner, 2008).<br />
However, <strong>the</strong> characteristics <strong>of</strong> <strong>Scargo</strong> <strong>Lake</strong> and <strong>the</strong> goals <strong>of</strong> reducing phosphorus and<br />
improving dissolved oxygen do not appear to match well with an alum application. The <strong>Scargo</strong><br />
<strong>Lake</strong> phosphorus budget more or less matches <strong>the</strong> phosphorus mass in <strong>the</strong> upper volume <strong>of</strong> <strong>the</strong><br />
lake without any input <strong>of</strong> phosphorus from <strong>the</strong> colder hypolimnion. If an alum application could<br />
remove all <strong>the</strong> phosphorus in <strong>the</strong> upper volume, <strong>the</strong> phosphorus mass within <strong>the</strong>se waters would<br />
return to current levels within approximately 2 years based on <strong>the</strong> input from <strong>the</strong> watershed. The<br />
alum application would form a barrier over <strong>the</strong> sediments and likely show some improvement in<br />
dissolved oxygen levels, but <strong>the</strong>re have not been definitive forensic studies to evaluate <strong>the</strong><br />
factors that lead to successful dissolved oxygen improvement after alum treatment or <strong>the</strong> length<br />
<strong>of</strong> time that <strong>the</strong> improvement is maintained. For <strong>the</strong>se reasons, staff would not recommend an<br />
alum treatment for <strong>Scargo</strong> <strong>Lake</strong>.<br />
Given <strong>the</strong> characteristics <strong>of</strong> <strong>Scargo</strong> <strong>Lake</strong>, <strong>the</strong> best option to address <strong>the</strong> sediment oxygen<br />
demand is aeration <strong>of</strong> <strong>the</strong> hypolimnion (Figure V-4). Hypolimnetic aeration can likely be<br />
confined to <strong>the</strong> deep basin in depths below 9 m and should done in a way that preserves <strong>the</strong> cold<br />
water layer and does not mix it with <strong>the</strong> warm upper layer. Since <strong>the</strong> layers do not begin to form<br />
until April, <strong>the</strong> system could be turned on in May and run through September. Deep dissolved<br />
oxygen concentrations naturally begin to recover in October, as rapid cooling <strong>of</strong> <strong>the</strong> lake begins<br />
to breakdown <strong>the</strong> layers.<br />
Use <strong>of</strong> hypolimnetic aeration would be a long term solution that would need to be<br />
initiated and maintained each summer. If this is combined with reductions in watershed<br />
phosphorus inputs, <strong>the</strong> lake will gradually (over decades) reduce <strong>the</strong> mass <strong>of</strong> phosphorus in <strong>the</strong><br />
sediments and <strong>the</strong> sources from <strong>the</strong> watershed will not replenish this mass. Performance <strong>of</strong><br />
47
Figure V-4. Potential Hypolimnetic Aeration Options.<br />
This figure, which is modified from Figure 3-1 in MassDEP/MassDCR (2004), shows <strong>the</strong> variety <strong>of</strong> general design options that have<br />
been developed to complete hypolimnetic aeration. This goal <strong>of</strong> this type <strong>of</strong> aeration is to maintain <strong>the</strong> <strong>the</strong>rmal layers, keeping <strong>the</strong><br />
warm water above <strong>the</strong> cold water, while adding oxygen to <strong>the</strong> cold water to address <strong>the</strong> sediment oxygen demand. Details to consider<br />
include <strong>the</strong> volume <strong>of</strong> water to be aerated, <strong>the</strong> shape <strong>of</strong> <strong>the</strong> basin, <strong>the</strong> amount <strong>of</strong> sediment oxygen demand, <strong>the</strong> siting and size <strong>of</strong> <strong>the</strong><br />
compressor, and <strong>the</strong> amount <strong>of</strong> time that <strong>the</strong> aerator would operate. Preliminary recommendations are that <strong>the</strong> town target <strong>the</strong><br />
sediment area deeper than 9 m in <strong>the</strong> large basin <strong>of</strong> <strong>Scargo</strong> <strong>Lake</strong> and that <strong>the</strong> aeration occurs from May through September. This area<br />
is 16 acres and has an average depth <strong>of</strong> 2 m. Sediment oxygen demand in <strong>the</strong>se sediments is 1,817 mg/m2/d. Use <strong>of</strong> hypolimnetic<br />
aeration would be a long term solution that would need to be initiated and maintained each summer. If <strong>the</strong> town can accomplish<br />
reductions in wastewater phosphorus sources, it may be possible that <strong>the</strong> aeration could be re-evaluated after <strong>the</strong> remaining wastewater<br />
phosphorus is flushed from <strong>the</strong> aquifer.<br />
48
aeration, both whole lake and hypolimnetic, has been somewhat mixed (MassDEP/MassDCR,<br />
2004). Proper air/oxygen flows, mixing, and adequate characterization <strong>of</strong> <strong>the</strong> treated ponds are<br />
thought to have led to <strong>the</strong> most successful installations. Successful installations have no negative<br />
impacts on fish, shellfish, or plants. Unsuccessful installations present <strong>the</strong> opportunity to<br />
increase <strong>the</strong> transfer <strong>of</strong> phosphorus from deep waters to <strong>the</strong> more productive shallow waters<br />
and/or to destabilize <strong>the</strong> <strong>the</strong>rmal layering and compromise <strong>the</strong> cold water fishery.<br />
The area <strong>of</strong> <strong>the</strong> deep basin below 9 m is 16 acres and <strong>the</strong> average depth <strong>of</strong> this layer is 2<br />
m. This volume and area is relatively small for <strong>the</strong> application <strong>of</strong> hypolimnetic aeration and<br />
great care would be necessary in <strong>the</strong> design to have an air flow that sustains <strong>the</strong> <strong>the</strong>rmal layering.<br />
Based on ranges <strong>of</strong> cost presented in <strong>the</strong> MassGEIR (MassDEP/MassDCR, 2004) and updated to<br />
2011 dollars, <strong>the</strong> likely cost range would be $10,000 to $60,000. Preliminary calculations <strong>of</strong><br />
necessary air flow are small, so capital costs should be relatively small, but costs associated with<br />
design, energy, and regulatory approval would likely push <strong>the</strong> costs toward <strong>the</strong> higher estimate.<br />
Long term maintenance would also have to be factored into <strong>the</strong> cost estimates. There are a<br />
number <strong>of</strong> design options as indicated in Figure V-4.<br />
Part <strong>of</strong> <strong>the</strong> long term success <strong>of</strong> in-lake treatment is going to be successful<br />
complementary reductions in watershed phosphorus inputs. As mentioned above, wastewater<br />
reductions would have <strong>the</strong> greatest impact. Wastewater is currently estimated to annually<br />
contribute 3.6 to 5.4 kg to <strong>Scargo</strong> <strong>Lake</strong>, which is greater than half <strong>of</strong> <strong>the</strong> watershed input.<br />
Removal <strong>of</strong> this whole load would reduce <strong>the</strong> mass in <strong>the</strong> lake to 34 to 44% <strong>of</strong> current levels and<br />
result in TP concentrations <strong>of</strong> 3.1 to 7.4 ppb without factoring in <strong>the</strong> sediment contributions.<br />
Accomplishing this type <strong>of</strong> reduction, however, would present a number <strong>of</strong> challenges.<br />
The houses on <strong>the</strong> western edge <strong>of</strong> <strong>the</strong> lake are located in areas <strong>of</strong> significant elevation changes<br />
and wastewater collection to ei<strong>the</strong>r neighborhood treatment facilities or a larger facility would<br />
have to address <strong>the</strong>se changes with pumps that would add operation and design costs. In<br />
addition to <strong>the</strong>se costs, wastewater facilities siting issues and costs would also be an issue. It<br />
might be possible to address <strong>the</strong>se comprehensively during town-wide discussions <strong>of</strong> wastewater<br />
infrastructure to meet estuary TMDLs (i.e., <strong>the</strong> comprehensive wastewater management plan<br />
(CWMP)).<br />
VI. Summary<br />
<strong>Scargo</strong> <strong>Lake</strong> is <strong>the</strong> largest (60 acres) and deepest (50 ft) freshwater pond in <strong>the</strong> <strong>Town</strong> <strong>of</strong><br />
<strong>Dennis</strong>. It is located to <strong>the</strong> north <strong>of</strong> <strong>Scargo</strong> Hill and south <strong>of</strong> Route 6A and is largely surrounded<br />
by residential development except for <strong>the</strong> two public beaches (<strong>Scargo</strong> Beach and Princess Beach)<br />
on <strong>the</strong> south side and a public boat ramp located <strong>of</strong>f Route 6A. A stream outlet in <strong>the</strong> nor<strong>the</strong>ast<br />
section connects <strong>the</strong> lake to Sesuit Harbor.<br />
Over <strong>the</strong> past 10 years or so, citizen volunteers have worked through advocacy and<br />
sampling time to develop key information about <strong>the</strong> water quality <strong>of</strong> <strong>Scargo</strong> <strong>Lake</strong>. In 2009, with<br />
<strong>the</strong> guidance <strong>of</strong> <strong>the</strong> town <strong>Water</strong> <strong>Quality</strong> Advisory Committee and <strong>the</strong> town Natural Resource<br />
Department, staff from <strong>the</strong> Coastal Systems Program, School for Marine Science and<br />
Technology (SMAST), University <strong>of</strong> Massachusetts Dartmouth completed a review <strong>of</strong> available<br />
water quality data and assessed where key targeted information was necessary to develop a water<br />
49
quality management plan (Eichner, 2009). The targeted data collection included collecting <strong>of</strong><br />
<strong>Scargo</strong> <strong>Lake</strong>-specific measures <strong>of</strong> stormwater run<strong>of</strong>f, sediment nutrient regeneration, bird<br />
populations, and an updated bathymetric map (Eichner and Howes, 2012). This report utilizes<br />
this information to provide an assessment <strong>of</strong> steps needed to restore <strong>Scargo</strong> <strong>Lake</strong>.<br />
Review <strong>of</strong> surface water conditions in <strong>Scargo</strong> <strong>Lake</strong> show conditions that are acceptable<br />
for swimming and o<strong>the</strong>r contact recreation. There has been no evidence <strong>of</strong> extensive algal<br />
blooms, blue-green algal blooms or fish kills; conditions that have impacted o<strong>the</strong>r Cape Cod<br />
ponds such as Hinckleys Pond in Harwich, Mystic <strong>Lake</strong> in Barnstable, and Long Pond in<br />
Brewster/Harwich. Total phosphorus and chlorophyll-a concentrations in this upper, warm layer,<br />
which extends down to 7-9 m, are elevated, but not exceptionally high.<br />
However, deeper in <strong>Scargo</strong> <strong>Lake</strong>, in <strong>the</strong> colder waters deeper than 9 m, are conditions<br />
that impair this portion <strong>of</strong> <strong>the</strong> lake habitat and raise concerns <strong>the</strong> future surface water quality <strong>of</strong><br />
<strong>the</strong> whole lake. During a given year, <strong>the</strong> earliest water quality data available is from April and<br />
this data shows that oxygen demand from <strong>the</strong> pond sediments has already begun to consume<br />
oxygen from overlying waters. These conditions persist and worsen throughout <strong>the</strong> summer,<br />
eventually reaching up to <strong>the</strong> bottom <strong>of</strong> <strong>the</strong> warm surface water layer and, on occasion, into <strong>the</strong><br />
surface water layer. Review <strong>of</strong> collected water quality data shows that <strong>the</strong>se low oxygen<br />
conditions release phosphorus, but close review <strong>of</strong> <strong>the</strong> dissolve oxygen readings show that <strong>the</strong>re<br />
is usually enough residual oxygen in <strong>the</strong> upper portions <strong>of</strong> <strong>the</strong> cold layer that extensive algal<br />
blooms are not initiated in <strong>the</strong> warm upper layer.<br />
These deep water diminishing oxygen concentrations are due to sediment oxygen<br />
demand, but <strong>the</strong>re is no indication that <strong>the</strong> phosphorus released from <strong>the</strong>se sediments is seeping<br />
into <strong>the</strong> upper waters in a significant mass. The sediment testing indicates that aerobic sediments<br />
in <strong>the</strong> 4-8 m depth range are <strong>the</strong> primary sediment phosphorus source during <strong>the</strong> summer.<br />
Collection <strong>of</strong> phosphorus in <strong>the</strong>se sediments may be facilitated by an extensive freshwater<br />
mussel population. Chlorophyll-a readings show that phytoplankton are growing more<br />
extensively at <strong>the</strong> boundary between cold and warm waters (7-9 m), but <strong>the</strong>se do not seem to be<br />
extensively impacting concentrations in <strong>the</strong> waters above <strong>the</strong>m. Overall review <strong>of</strong> sediment data<br />
suggests that <strong>the</strong> pond is collecting more phosphorus each year and it is likely that this will<br />
gradually worsen dissolved oxygen conditions over time without intervention. There is,<br />
however, no discernible trend <strong>of</strong> worsening dissolved oxygen conditions or Secchi clarity over<br />
<strong>the</strong> past 10 years.<br />
Review <strong>of</strong> potential next steps for <strong>the</strong> management <strong>of</strong> <strong>Scargo</strong> <strong>Lake</strong> largely depends on <strong>the</strong><br />
criteria that are used to judge its water quality conditions, as well as advocacy to address <strong>the</strong><br />
water quality problems. Massachusetts Department <strong>of</strong> Environmental Protection (MassDEP)<br />
regulatory standards for surface waters require dissolved oxygen concentrations in lakes with<br />
cold water fisheries to have dissolved oxygen (DO) concentrations <strong>of</strong> 6 ppm or above (314 CMR<br />
4.05(3)(b)1). As shown in <strong>the</strong> DO pr<strong>of</strong>iles, <strong>the</strong> cold water fishery in <strong>Scargo</strong> <strong>Lake</strong> regularly<br />
disappears during <strong>the</strong> summer as sediment oxygen demand drops DO concentrations below 6<br />
ppm throughout <strong>the</strong> whole cold water layer and with anoxic conditions (
grease, and taste and color. Based on <strong>the</strong> DO criterion, it is likely that MassDEP would require a<br />
TMDL for <strong>Scargo</strong> <strong>Lake</strong> under <strong>the</strong> Clean <strong>Water</strong> Act and, eventually, some sort <strong>of</strong> management<br />
actions to attain <strong>the</strong> TMDL. What <strong>the</strong> TMDL would be, however, would likely require some<br />
negotiations with MassDEP, since no phosphorus TMDLs have been developed by MassDEP for<br />
deep water lakes within <strong>the</strong> <strong>Scargo</strong> <strong>Lake</strong> Ecoregion (i.e., sou<strong>the</strong>rn Plymouth, Cape Cod,<br />
Martha’s Vineyard and Nantucket).<br />
The review <strong>of</strong> <strong>the</strong> 2001 PALS Snapshot data suggested that a target TP concentration<br />
range for Cape Cod ponds should be between 7.5 and 10 ppb (Eichner and o<strong>the</strong>rs, 2003).<br />
Average late summer surface TP concentrations in <strong>Scargo</strong> <strong>Lake</strong> in <strong>the</strong> waters less than 9 m are<br />
10.3 ppb, while <strong>the</strong> deepest waters average 22.9 ppb. The shallow concentration and <strong>the</strong> deep<br />
DO impairments suggest that <strong>the</strong> TP should be lower than 10 ppb. In order to achieve 7.5 ppb<br />
TP, <strong>the</strong> average mass <strong>of</strong> TP in <strong>the</strong> upper waters <strong>of</strong> <strong>Scargo</strong> <strong>Lake</strong> would need to be reduced from<br />
16 kg to 9.8 kg. In order to meet this lower mass, <strong>the</strong> annual watershed load would need to be<br />
reduced by 3 kg from <strong>the</strong> current annual load <strong>of</strong> 5.5 to 9.8 kg.<br />
The largest controllable load entering <strong>Scargo</strong> <strong>Lake</strong> from its watershed is wastewater. If<br />
wastewater alone was targeted for <strong>the</strong> potential phosphorus reduction, wastewater phosphorus<br />
loads would need to be reduced 55 to 83%. No o<strong>the</strong>r single controllable source could attain <strong>the</strong> 3<br />
kg reduction. However, since wastewater phosphorus takes decades to reach <strong>Scargo</strong> <strong>Lake</strong>,<br />
immediate reductions in wastewater phosphorus would address <strong>the</strong> long term maintenance <strong>of</strong><br />
appropriate TP loads, but would not address <strong>the</strong> MassDEP dissolved oxygen criterion.<br />
The goal in addressing <strong>the</strong> MassDEP DO criterion can likely be met by establishing some<br />
stable trout habitat; not <strong>the</strong> whole <strong>the</strong> cold water layer, but some portion. If a layer <strong>of</strong> high DO<br />
(>6 ppm), cold water can be sustained, it will provide some trout habitat, as well as protecting<br />
<strong>the</strong> warm, upper waters <strong>of</strong> <strong>the</strong> lake from regenerated deep water phosphorus. Project staff<br />
reviewed available options and recommend that <strong>the</strong> town consider implementing a hypolimnetic<br />
aeration project.<br />
Hypolimnetic aeration is a process <strong>of</strong> controlled injection <strong>of</strong> air into <strong>the</strong> deep water in<br />
such a way that <strong>the</strong> cold water layer is maintained and oxygen levels are increased. It is<br />
recommended that this process be confined to <strong>the</strong> deep basin <strong>of</strong> <strong>Scargo</strong> <strong>Lake</strong> in depths below 9<br />
m. Since <strong>the</strong> layers do not begin to form until April, <strong>the</strong> system could be turned on in May and<br />
run through September. Deep dissolved oxygen concentrations naturally begin to recover in<br />
October, as rapid cooling <strong>of</strong> <strong>the</strong> lake begins to breakdown <strong>the</strong> layers, so <strong>the</strong> system could be<br />
turned <strong>of</strong>f at that point.<br />
The area <strong>of</strong> <strong>the</strong> deep basin below 9 m is 16 acres and <strong>the</strong> average depth <strong>of</strong> this layer is 2<br />
m. This volume and area is relatively small for <strong>the</strong> application <strong>of</strong> hypolimnetic aeration and<br />
great care would be necessary in <strong>the</strong> design to have an air flow that sustains <strong>the</strong> <strong>the</strong>rmal layering.<br />
Based on ranges <strong>of</strong> cost presented in <strong>the</strong> MassGEIR (MassDEP/MassDCR, 2004) and updated to<br />
2011 dollars, <strong>the</strong> likely cost range would be $10,000 to $60,000. Preliminary calculations <strong>of</strong><br />
necessary air flow are small, so capital costs should be relatively small, but costs such as design,<br />
energy, and regulatory approval would likely push <strong>the</strong> costs toward <strong>the</strong> higher estimate. Long<br />
51
term maintenance would also have to be factored into <strong>the</strong> cost estimates. There are a number <strong>of</strong><br />
design options.<br />
Use <strong>of</strong> hypolimnetic aeration would be a long term solution that would need to be<br />
initiated and maintained each summer. Proper air/oxygen flows, mixing, and adequate<br />
characterization <strong>of</strong> <strong>the</strong> treated ponds are key factors in <strong>the</strong> most successful installations.<br />
Successful installations have no negative impacts on fish, shellfish, or plants. Unsuccessful<br />
installations present <strong>the</strong> opportunity to increase <strong>the</strong> transfer <strong>of</strong> phosphorus from deep waters to<br />
<strong>the</strong> more productive shallow waters and/or to destabilize <strong>the</strong> <strong>the</strong>rmal layering and compromise<br />
<strong>the</strong> cold water fishery. If this is combined with reductions in watershed phosphorus inputs, <strong>the</strong><br />
lake will gradually (over decades) reduce <strong>the</strong> mass <strong>of</strong> phosphorus in <strong>the</strong> sediments and <strong>the</strong><br />
sources from <strong>the</strong> watershed will not replenish this mass.<br />
Part <strong>of</strong> <strong>the</strong> long term success <strong>of</strong> <strong>the</strong> proposed in-lake treatment is going to be successful<br />
complementary reductions in watershed phosphorus inputs. As mentioned above, wastewater<br />
reductions would have <strong>the</strong> greatest impact. Wastewater is currently estimated to annually<br />
contribute 3.6 to 5.4 kg to <strong>Scargo</strong> <strong>Lake</strong>, which is greater than half <strong>of</strong> <strong>the</strong> watershed input.<br />
Removal <strong>of</strong> this whole load would reduce <strong>the</strong> mass in <strong>the</strong> lake to 34 to 44% <strong>of</strong> current levels and<br />
result in TP concentrations <strong>of</strong> 3.1 to 7.4 ppb without factoring in <strong>the</strong> sediment contributions.<br />
Accomplishing this type <strong>of</strong> reduction, however, would present a number <strong>of</strong> challenges.<br />
The houses on <strong>the</strong> western edge <strong>of</strong> <strong>the</strong> lake are located in areas <strong>of</strong> significant elevation changes<br />
and wastewater collection to ei<strong>the</strong>r neighborhood treatment facilities or a larger facility would<br />
have to address <strong>the</strong>se changes with pumps that would add operation and design costs. In<br />
addition to <strong>the</strong>se costs, wastewater facilities siting issues and costs would also be an issue. It<br />
might be possible to address <strong>the</strong>se comprehensively during town-wide discussions <strong>of</strong> wastewater<br />
infrastructure to meet estuary TMDLs.<br />
52
VII. Recommended Next Steps<br />
VII.1. Begin Review <strong>of</strong> Design Discussions for Hypolimnetic Aeration<br />
Designing <strong>the</strong> hypolimnetic aeration system will require public discussions <strong>of</strong> design options. It<br />
is recommended that <strong>the</strong>se discussions be facilitated through <strong>the</strong> <strong>Water</strong> <strong>Quality</strong> Advisory<br />
Committee and that <strong>the</strong> town consider development <strong>of</strong> a Request for Proposals to review options.<br />
SMAST staff could assist <strong>the</strong> WQAC and town in <strong>the</strong> development <strong>of</strong> <strong>the</strong> RFP, review <strong>of</strong><br />
submittals and implementation <strong>of</strong> <strong>the</strong> selected proposal.<br />
VII.2. Review Potential Options to Reduce Wastewater Phosphorus Sources<br />
The above evaluation indicated that wastewater from sources within 300 ft <strong>of</strong> <strong>the</strong> pond shoreline<br />
and within <strong>the</strong> watershed is <strong>the</strong> primary watershed source <strong>of</strong> phosphorus to <strong>Scargo</strong> <strong>Lake</strong>. If<br />
some <strong>of</strong> <strong>the</strong>se sources can be removed or reduced, <strong>the</strong> impacts <strong>of</strong> sediment phosphorus will be<br />
diminished and <strong>the</strong> need for hypolimnetic aeration will be diminished over time. It is<br />
recommended that existing work with <strong>the</strong> <strong>Town</strong>’s comprehensive wastewater management plan<br />
(CWMP) be reviewed and updated based on <strong>the</strong> findings in this report.<br />
VII.3. Continue Future Citizen Monitoring<br />
The available dataset for all <strong>the</strong> ponds considered under this project is primarily due to <strong>Dennis</strong><br />
citizens volunteering to collect water quality data. The current approach to sample once in April<br />
and once in August/September using PALS sampling protocols is invaluable in gauging <strong>the</strong><br />
annual and long-term impact <strong>of</strong> sediment oxygen demand on <strong>the</strong> lake’s water quality. It is<br />
recommended that this sampling continue and be adjusted as phosphorus mitigation options or<br />
sediment treatments are implemented.<br />
VII.4. Initiate Discussions with MassDEP regarding TMDL guidance<br />
As mentioned above, a total phosphorus TMDL has not been developed by MassDEP for deep<br />
water lakes within <strong>the</strong> Cape Cod ecoregion. A TMDL will provide <strong>the</strong> target criterion for any<br />
cleanup <strong>of</strong> <strong>Scargo</strong> <strong>Lake</strong>. It is recommended that <strong>the</strong> town proactively ask MassDEP for guidance<br />
regarding a TMDL to ensure that <strong>the</strong>re is regulatory certainty regarding <strong>the</strong> target criteria and<br />
any follow-up compliance that may arise for implementation <strong>of</strong> phosphorus management<br />
activities.<br />
53
VIII. References<br />
Cadmus Group, Inc. 2007. Total Maximum Daily Load (TMDL) for Phosphorus in Little Sodus<br />
Bay, Cayuga County, New York. Prepared for: U.S. Environmental Protection Agency, Region<br />
2 and New York State Department <strong>of</strong> Environmental Conservation.<br />
Carlson, R.E. 1977. A trophic state index for lakes. Limnology and Oceanography. 22: 361-<br />
369.<br />
Eichner, E. 2008. Barnstable Ponds: Current Status, Available Data, and Recommendations for<br />
Future Activities. School for Marine Science and Technology, University <strong>of</strong> Massachusetts<br />
Dartmouth and Cape Cod Commission. New Bedford and Barnstable, MA.<br />
Eichner, E. 2009. <strong>Dennis</strong> Freshwater Ponds: <strong>Water</strong> <strong>Quality</strong> Status and Recommendations for<br />
Future Activities. Coastal Systems Program, School for Marine Science and Technology,<br />
University <strong>of</strong> Massachusetts Dartmouth and Cape Cod Commission. New Bedford and<br />
Barnstable, MA. 106 pp.<br />
Eichner, E.M. and T.C. Cambareri. 1992. Nitrogen Loading. Cape Cod Commission Technical<br />
Bulletin 91-001. Cape Cod Commission. Barnstable, MA.<br />
Eichner, E. and B. Howes. February 23, 2012. <strong>Scargo</strong> <strong>Lake</strong> Technical Support Project<br />
Technical Memorandum. To: Virginia Esau and Karen Johnson. Coastal Systems Group,<br />
School for Marine Science and Technology, University <strong>of</strong> Massachusetts Dartmouth.<br />
Eichner, E.M., T.C. Cambareri, G. Belfit, D. McCaffery, S. Michaud, and B. Smith. 2003. Cape<br />
Cod Pond and <strong>Lake</strong> Atlas. Cape Cod Commission. Barnstable, MA.<br />
Eichner, E.M., T.C. Cambareri, V. Morrill, and B. Smith. 1998. <strong>Lake</strong> Wequaquet <strong>Water</strong> Level<br />
Study. Cape Cod Commission. Barnstable, MA.<br />
Elliot, J.M. 2000. Pools as refugia for brown trout during two summer droughts: trout<br />
responses to <strong>the</strong>rmal and oxygen stress. Journal <strong>of</strong> Fish Biology. 56(4): 938.<br />
Erickson, J.E., J.L. Cisar, G.H. Snyder, and J.C. Volin. 2005. Phosphorus and Potassium<br />
Leaching under Contrasting Residential Landscape Models Established on a Sandy Soil. Crop<br />
Science. 45: 546–552.<br />
Frimpter, M.H. and F.B. Gay. 1979. Chemical <strong>Quality</strong> <strong>of</strong> Ground <strong>Water</strong> on Cape Cod,<br />
Massachusetts. <strong>Water</strong> Resources Investigations 79-65. US Geological Survey. Boston, MA.<br />
Fontenot, Q.C., D.A. Ru<strong>the</strong>rford, and W.E. Kelso. 2001. Effects <strong>of</strong> Environmental Hypoxia<br />
Associated with <strong>the</strong> Annual Flood Pulse on <strong>the</strong> Distribution <strong>of</strong> Larval Sunfish and Shad in <strong>the</strong><br />
Atchafalaya River Basin, Louisiana. Transactions <strong>of</strong> <strong>the</strong> American Fisheries Society. 130: 107-<br />
116.<br />
54
Hendry, C.D. and P.L. Brezonik. 1980. Chemistry <strong>of</strong> precipitation at Gainesville, Florida.<br />
Environmental Science and Technology. 14:843–849.<br />
Howes B., S.W. Kelley, J.S. Ramsey, R. Samimy, D. Schlezinger, E. Eichner (2006).<br />
Linked <strong>Water</strong>shed-Embayment Model to Determine Critical Nitrogen Loading Thresholds for<br />
Pleasant Bay, Chatham, Massachusetts. Massachusetts Estuaries Project, Massachusetts<br />
Department <strong>of</strong> Environmental Protection. Boston, MA.<br />
IEP, Inc. and K-V Associates. 1989. Diagnostic/Feasibility Study <strong>of</strong> Wequaquet <strong>Lake</strong>, Bearses,<br />
and Long Pond. Prepared for <strong>Town</strong> <strong>of</strong> Barnstable, Conservation Commission. Sandwich and<br />
Falmouth, MA.<br />
Kellogg, D., M.E. Evans Esten, L. Joubert, and A. Gold. 2006. Database Development,<br />
Hydrologic Budget and Nutrient Loading Assumptions for <strong>the</strong> “Method <strong>of</strong> Assessment, Nutrientloading,<br />
and Geographic Evaluation <strong>of</strong> Nonpoint Pollution” (MANAGE) including GIS-based<br />
Pollution Risk Assessment Method. 2006 update <strong>of</strong> 1996 original. Rhode Island Department <strong>of</strong><br />
Environmental <strong>Management</strong>. University <strong>of</strong> Rhode Island Cooperative Extension. Kingston, RI.<br />
Killgore, K.J. and J.J. Hoover. 2001. Effects <strong>of</strong> Hypoxia on Fish Assemblages in a Vegetated<br />
<strong>Water</strong>body. Journal <strong>of</strong> Aquatic Plant <strong>Management</strong>. 39: 40-44.<br />
Maine Department <strong>of</strong> Environmental Protection. 1989. Phosphorus Control in <strong>Lake</strong><br />
<strong>Water</strong>sheds: A Technical Guide to Evaluating New Development.<br />
Massachusetts Department <strong>of</strong> Environmental Protection. 2003. Total Maximum Daily Loads <strong>of</strong><br />
Phosphorus for Selected Millers Basin <strong>Lake</strong>s. DEP, DWM TMDL FINAL <strong>Report</strong> MA35005-<br />
2002-1 CN123.2. available at: http://www.mass.gov/dep/water/resources/millers.pdf<br />
(downloaded 8/27/12).<br />
Massachusetts Department <strong>of</strong> Environmental Protection and Department <strong>of</strong> Conservation and<br />
Recreation. 2004. Eutrophication and Aquatic Plant <strong>Management</strong> in Massachusetts, Final<br />
Generic Environmental Impact <strong>Report</strong>. Executive Office <strong>of</strong> Environmental Affairs,<br />
Commonwealth <strong>of</strong> Massachusetts.<br />
Mat<strong>the</strong>ws, K.R. and N.H. Berg. 1997. Rainbow trout responses to water temperature and<br />
dissolved oxygen stress in two sou<strong>the</strong>rn California stream pools. Journal <strong>of</strong> Fish Biology. 50:<br />
50-67.<br />
Oldale, R.N. 1992. Cape Cod and <strong>the</strong> Islands: The Geologic Story. Parnassus Imprints, East<br />
Orleans, MA.<br />
Redfield, A.C., B.H. Ketchum, and F.A. Richards. 1963. The influence <strong>of</strong> organisms on <strong>the</strong><br />
composition <strong>of</strong> sea-water, in The Sea, (M.N. Hill (ed.). New York, Wiley, pp. 26-77.<br />
Robertson, W.D. 2008. Irreversible Phosphorus Sorption in Septic System Plumes? Ground<br />
<strong>Water</strong>. 46(1): 51-60.<br />
55
Scherer, N.M., H.L. Gibbons, K.B. Stoops, and M. Muller. 1995. Phosphorus loading <strong>of</strong> an<br />
urban lake by bird droppings. <strong>Lake</strong> and Reservoir <strong>Management</strong>. 11(4): 317 - 327.<br />
School <strong>of</strong> Marine Science and Technology, University <strong>of</strong> Massachusetts Dartmouth. 2003.<br />
Coastal Systems Program, Analytical Facility, Laboratory <strong>Quality</strong> Assurance Plan. New<br />
Bedford, MA.<br />
Stumm, W. and J.J. Morgan. 1981. Aquatic Chemistry. John Wiley & Sons, Inc., New York,<br />
NY.<br />
Thurston, R.V., G.R. Phillips, R.C. Russo, and S.M. Hinkins. 1981. Increased Toxicity <strong>of</strong><br />
Ammonia to Rainbow Trout (Salmo Gairdneri) Resulting from Reduced Concentrations <strong>of</strong><br />
Dissolved Oxygen. Canadian Journal <strong>of</strong> Fisheries and Aquatic Sciences. 38(8): 983-988.<br />
Vollenweider, R.A. 1968. Scientific Fundamentals <strong>of</strong> <strong>the</strong> Eutrophication <strong>of</strong> <strong>Lake</strong>s and Flowing<br />
<strong>Water</strong>s, with Particular Reference to Nitrogen and Phosphorus as Factors in Eutrophication.<br />
Paris, Rep. OECD, DAS/CSI/68.27.<br />
United States Environmental Protection Agency. 2000. Nutrient Criteria Technical Guidance<br />
Manual: <strong>Lake</strong>s and Reservoirs. First Edition. EPA-822-B00-001. US Environmental<br />
Protection Agency, Office <strong>of</strong> <strong>Water</strong>, Office <strong>of</strong> Science and Technology. Washington, DC.<br />
Walter, D.A. and A.T. Whealan. 2005. Simulated <strong>Water</strong> Sources and Effects <strong>of</strong> Pumping on<br />
Surface and Ground <strong>Water</strong>, Sagamore and Monomoy Flow Lenses, Cape Cod, Massachusetts.<br />
U.S. Geological Survey Scientific Investigations <strong>Report</strong> 2004-5181.<br />
Walter, D.A., J.P. Masterson, and D.R. Leblanc. 2002. Simulated Pond-Aquifer Interactions<br />
under Natural and Stressed Conditions near Snake Pond, Cape Cod, Massachusetts. U.S.<br />
Geological Survey <strong>Water</strong>-Resources Investigations <strong>Report</strong> 99-4174. Northborough, MA.<br />
Wetzel, R. G. 1983. Limnology. Second Edition. CBS College Publishing, New York.<br />
White, L.M. 2003. The Contribution <strong>of</strong> Lawn Fertilizer to <strong>the</strong> Nitrogen Loading <strong>of</strong> Cape Cod<br />
Embayments. A Thesis submitted in <strong>the</strong> partial fulfillment <strong>of</strong> <strong>the</strong> requirements for <strong>the</strong> degree <strong>of</strong><br />
Master <strong>of</strong> Arts in Marine Affairs, University <strong>of</strong> Rhode Island.<br />
<strong>Water</strong> Resources Services, Inc. March, 2011. Internal Phosphorus Load Inactivation in Mystic<br />
<strong>Lake</strong>, Barnstable, Massachusetts.<br />
56