Chi, H., and H. Liu. 1985. Two new methods for the study of insect ...
Chi, H., and H. Liu. 1985. Two new methods for the study of insect ...
Chi, H., and H. Liu. 1985. Two new methods for the study of insect ...

You also want an ePaper? Increase the reach of your titles
YUMPU automatically turns print PDFs into web optimized ePapers that Google loves.
236 HSIN CHI AND HSI LIU<br />
makes <strong>the</strong> change more comprehensible <strong>and</strong><br />
is especially helpful in teaching entomology.<br />
GLASSHOUSE RELEASE EXPERIMENT<br />
AND COMPUTER SIMULATION<br />
(1) Material <strong>and</strong> method<br />
Fifteen pairs <strong>of</strong> adults <strong>of</strong> diamondback<br />
moth, <strong>new</strong>ly emerged from pupae, were<br />
released into <strong>the</strong> glasshouse. In <strong>the</strong> glasshouse,<br />
100 pots <strong>of</strong> ca. 60 days-old Brassica oleracea L.<br />
var. acephala DC were arranged into three<br />
blocks, each with 33, 34 <strong>and</strong> 33 pots. The number<br />
<strong>of</strong> larvae ( 2nd-4th instars ) <strong>and</strong> pupae were<br />
investigated every 3-5 days. The temperature<br />
<strong>and</strong> humidity were recorded every day. The<br />
results were compared with <strong>the</strong> simulation<br />
results by running program FDMSLBH. The<br />
released fifteen pairs <strong>of</strong> adults were assumed<br />
to be r<strong>and</strong>omly distributed.<br />
(2) Comparison between population growth in<br />
glasshouse <strong>and</strong> in computer simulation<br />
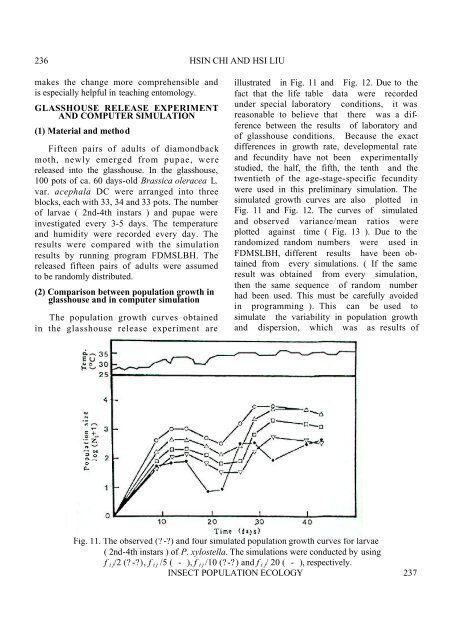
The population growth curves obtained<br />
in <strong>the</strong> glasshouse release experiment are<br />
illustrated in Fig. 11 <strong>and</strong> Fig. 12. Due to <strong>the</strong><br />
fact that <strong>the</strong> life table data were recorded<br />
under special laboratory conditions, it was<br />
reasonable to believe that <strong>the</strong>re was a difference<br />
between <strong>the</strong> results <strong>of</strong> laboratory <strong>and</strong><br />
<strong>of</strong> glasshouse conditions. Because <strong>the</strong> exact<br />
differences in growth rate, developmental rate<br />
<strong>and</strong> fecundity have not been experimentally<br />
studied, <strong>the</strong> half, <strong>the</strong> fifth, <strong>the</strong> tenth <strong>and</strong> <strong>the</strong><br />
twentieth <strong>of</strong> <strong>the</strong> age-stage-specific fecundity<br />
were used in this preliminary simulation. The<br />
simulated growth curves are also plotted in<br />
Fig. 11 <strong>and</strong> Fig. 12. The curves <strong>of</strong> simulated<br />
<strong>and</strong> observed variance/mean ratios were<br />
plotted against time ( Fig. 13 ). Due to <strong>the</strong><br />
r<strong>and</strong>omized r<strong>and</strong>om numbers were used in<br />
FDMSLBH, different results have been obtained<br />
from every simulations. ( If <strong>the</strong> same<br />
result was obtained from every simulation,<br />
<strong>the</strong>n <strong>the</strong> same sequence <strong>of</strong> r<strong>and</strong>om number<br />
had been used. This must be carefully avoided<br />
in programming ). This can be used to<br />
simulate <strong>the</strong> variability in population growth<br />
<strong>and</strong> dispersion, which was as results <strong>of</strong><br />
Fig. 11. The observed (? -?) <strong>and</strong> four simulated population growth curves <strong>for</strong> larvae<br />
( 2nd-4th instars ) <strong>of</strong> P. xylostella. The simulations were conducted by using<br />
f i j /2 (? -?), f i j /5 ( - ), f i j /10 (?-?) <strong>and</strong> f i j/ 20 ( - ), respectively.<br />
INSECT POPULATION ECOLOGY 237