Chi, H., and H. Liu. 1985. Two new methods for the study of insect ...
Chi, H., and H. Liu. 1985. Two new methods for the study of insect ...
Chi, H., and H. Liu. 1985. Two new methods for the study of insect ...

You also want an ePaper? Increase the reach of your titles
YUMPU automatically turns print PDFs into web optimized ePapers that Google loves.
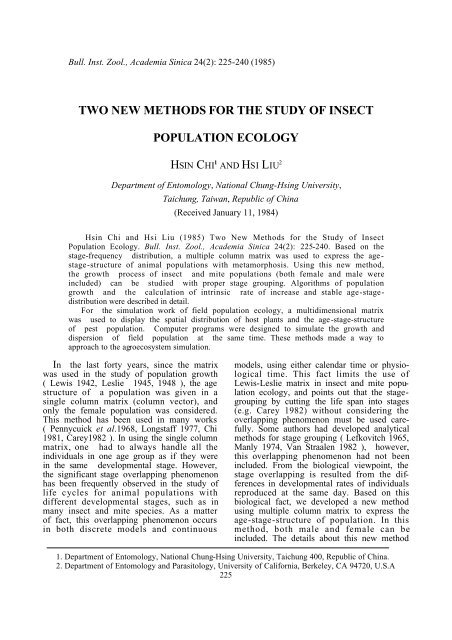
Bull. Inst. Zool., Academia Sinica 24(2): 225-240 (1985)<br />
TWO NEW METHODS FOR THE STUDY OF INSECT<br />
POPULATION ECOLOGY<br />
HSIN CHI 1 AND HSI LIU 2<br />
Department <strong>of</strong> Entomology, National Chung-Hsing University,<br />
Taichung, Taiwan, Republic <strong>of</strong> <strong>Chi</strong>na<br />
(Received January 11, 1984)<br />
Hsin <strong>Chi</strong> <strong>and</strong> Hsi <strong>Liu</strong> (1985) <strong>Two</strong> New Methods <strong>for</strong> <strong>the</strong> Study <strong>of</strong> Insect<br />
Population Ecology. Bull. Inst. Zool., Academia Sinica 24(2): 225-240. Based on <strong>the</strong><br />
stage-frequency distribution, a multiple column matrix was used to express <strong>the</strong> agestage-structure<br />
<strong>of</strong> animal populations with metamorphosis. Using this <strong>new</strong> method,<br />
<strong>the</strong> growth process <strong>of</strong> <strong>insect</strong> <strong>and</strong> mite populations (both female <strong>and</strong> male were<br />
included) can be studied with proper stage grouping. Algorithms <strong>of</strong> population<br />
growth <strong>and</strong> <strong>the</strong> calculation <strong>of</strong> intrinsic rate <strong>of</strong> increase <strong>and</strong> stable age-stagedistribution<br />
were described in detail.<br />
For <strong>the</strong> simulation work <strong>of</strong> field population ecology, a multidimensional matrix<br />
was used to display <strong>the</strong> spatial distribution <strong>of</strong> host plants <strong>and</strong> <strong>the</strong> age-stage-structure<br />
<strong>of</strong> pest population. Computer programs were designed to simulate <strong>the</strong> growth <strong>and</strong><br />
dispersion <strong>of</strong> field population at <strong>the</strong> same time. These <strong>methods</strong> made a way to<br />
approach to <strong>the</strong> agroecosystem simulation.<br />
In <strong>the</strong> last <strong>for</strong>ty years, since <strong>the</strong> matrix<br />
was used in <strong>the</strong> <strong>study</strong> <strong>of</strong> population growth<br />
( Lewis 1942, Leslie 1945, 1948 ), <strong>the</strong> age<br />
structure <strong>of</strong> a population was given in a<br />
single column matrix (column vector), <strong>and</strong><br />
only <strong>the</strong> female population was considered.<br />
This method has been used in many works<br />
( Pennycuick et al.1968, Longstaff 1977, <strong>Chi</strong><br />
1981, Carey1982 ). In using <strong>the</strong> single column<br />
matrix, one had to always h<strong>and</strong>le all <strong>the</strong><br />
individuals in one age group as if <strong>the</strong>y were<br />
in <strong>the</strong> same developmental stage. However,<br />
<strong>the</strong> significant stage overlapping phenomenon<br />
has been frequently observed in <strong>the</strong> <strong>study</strong> <strong>of</strong><br />
life cycles <strong>for</strong> animal populations with<br />
different developmental stages, such as in<br />
many <strong>insect</strong> <strong>and</strong> mite species. As a matter<br />
<strong>of</strong> fact, this overlapping phenomenon occurs<br />
in both discrete models <strong>and</strong> continuous<br />
models, using ei<strong>the</strong>r calendar time or physiological<br />
time. This fact limits <strong>the</strong> use <strong>of</strong><br />
Lewis-Leslie matrix in <strong>insect</strong> <strong>and</strong> mite population<br />
ecology, <strong>and</strong> points out that <strong>the</strong> stagegrouping<br />
by cutting <strong>the</strong> life span into stages<br />
(e.g. Carey 1982) without considering <strong>the</strong><br />
overlapping phenomenon must be used carefully.<br />
Some authors had developed analytical<br />
<strong>methods</strong> <strong>for</strong> stage grouping ( Lefkovitch 1965,<br />
Manly 1974, Van Straalen 1982 ), however,<br />
this overlapping phenomenon had not been<br />
included. From <strong>the</strong> biological viewpoint, <strong>the</strong><br />
stage overlapping is resulted from <strong>the</strong> differences<br />
in developmental rates <strong>of</strong> individuals<br />
reproduced at <strong>the</strong> same day. Based on this<br />
biological fact, we developed a <strong>new</strong> method<br />
using multiple column matrix to express <strong>the</strong><br />
age-stage-structure <strong>of</strong> population. In this<br />
method, both male <strong>and</strong> female can be<br />
included. The details about this <strong>new</strong> method<br />
1. Department <strong>of</strong> Entomology, National Chung-Hsing University, Taichung 400, Republic <strong>of</strong> <strong>Chi</strong>na.<br />
2. Department <strong>of</strong> Entomology <strong>and</strong> Parasitology, University <strong>of</strong> Cali<strong>for</strong>nia, Berkeley, CA 94720, U.S.A<br />
225
226 HSIN CHI AND HSI LIU<br />
are discussed in this paper.<br />
The ano<strong>the</strong>r problem in population<br />
ecology is that <strong>the</strong> growth <strong>and</strong> dispersion <strong>of</strong><br />
population had been almost always separately<br />
studied. This can be seen in many simulation<br />
models, where only <strong>the</strong> relative density<br />
(<strong>insect</strong>/plant) had been used to represent <strong>the</strong><br />
population. They gave <strong>the</strong> false impression<br />
that <strong>the</strong> individuals were uni<strong>for</strong>mly distributed<br />
in space <strong>and</strong> <strong>the</strong> spatial distribution had no<br />
relation to population growth. Many authors<br />
had tried to <strong>study</strong> <strong>the</strong> growth <strong>of</strong> population<br />
with respect to distribution or used computer<br />
mapping to show <strong>the</strong> spatial distribution<br />
(Ashley1976, Fulton <strong>and</strong> Haynes 1975, Haynes<br />
<strong>and</strong> Tummala 1978, Wellington et al. 1975,<br />
Taylor <strong>and</strong> Taylor 1977). Among <strong>the</strong>m,<br />
Taylor <strong>and</strong> Taylor (1977) gave a spatial<br />
concept <strong>for</strong> population <strong>and</strong> treated <strong>the</strong><br />
anatomy <strong>of</strong> a real population as being in<br />
three dimensions, latitude×longitude through<br />
time. This concept is helpful in underst<strong>and</strong>ing<br />
<strong>the</strong> real population. For <strong>the</strong> <strong>study</strong> on this<br />
problem, we used a multidimensional matrix<br />
to express <strong>the</strong> spatial distribution <strong>and</strong> <strong>the</strong><br />
age-stage-structure <strong>of</strong> population, <strong>and</strong> tried to<br />
simulate <strong>the</strong> growth <strong>and</strong> dispersion <strong>of</strong> population<br />
at <strong>the</strong> same time. The basic concept<br />
<strong>of</strong> this method is also discussed in this paper.<br />
THE MULTIPLE COLUMN<br />
MATRIX MODEL<br />
(1) The age-stage-structure matrix<br />
The basic idea <strong>of</strong> <strong>the</strong> multiple column<br />
matrix model is displayed in Fig. 1. In this<br />
method, <strong>the</strong> population structure is given in<br />
matrix N withkrows <strong>and</strong> m columns-k is<br />
<strong>the</strong> number <strong>of</strong> age groups, m is <strong>the</strong> number<br />
<strong>of</strong> stages. In explanation <strong>of</strong> this <strong>new</strong> method<br />
an assumed matrix N with ten rows <strong>and</strong> five<br />
columns is used. Each column <strong>of</strong> matrix N<br />
represents one stage, e.g. egg, larva, pupa,<br />
female <strong>and</strong> male. Then, n i j gives <strong>the</strong> number<br />
<strong>of</strong> individuals in age i <strong>and</strong> stage j. After one<br />
age interval, individuals in age i <strong>and</strong> stage j<br />
may grow to age i+1 but still be in <strong>the</strong> same<br />
Fig. 1. The age-stage-structure matrix (N) <strong>of</strong><br />
a population. Elements out <strong>of</strong> <strong>the</strong><br />
range <strong>of</strong> stage distribution are denoted<br />
by “— ”. (E-egg stage, L-larval stage,<br />
P-pupal stage, F-female, M-male).<br />
stage j, or develop to stage j+1 <strong>and</strong> <strong>the</strong>n be<br />
in age i+1. The last two columns, female<br />
<strong>and</strong> male, are both developed from <strong>the</strong> last<br />
preimaginal stage-<strong>the</strong> pupa. A dash “— ”<br />
is used where an element is nonexistent (out<br />
<strong>of</strong> <strong>the</strong> range <strong>of</strong> stage distribution), this also<br />
make <strong>the</strong> stage distribution more clear. All<br />
such elements will be set to zero in <strong>the</strong><br />
calculation <strong>of</strong> <strong>the</strong> following sections.<br />
(2) Age-stage-specific growth rate, developmental<br />
rate <strong>and</strong> fecundity<br />
In The Lewis-Leslie matrix only agespecific<br />
survival rates <strong>and</strong> fecundity will be<br />
considered. In <strong>the</strong> present paper, we take <strong>the</strong><br />
stage differentiation into consideration. There<strong>for</strong>e,<br />
<strong>the</strong>re are three factors which relate to<br />
all individuals, namely: age-stage-specific<br />
growth rate, developmental rate <strong>and</strong> fecundity.<br />
In order to make this method more comprehensible<br />
<strong>and</strong> to facilitate computer programming,<br />
we set <strong>the</strong>se three factors into<br />
three matrices <strong>of</strong> <strong>the</strong> same dimension (Fig. 2).
INSECT POPULATION ECOLOGY 227<br />
Fig. 2. The age-stage-specific growth rate matrix (G), developmental rate matrix<br />
(D) <strong>and</strong> fecundity matrix (F). In matrix G, g i j is <strong>the</strong> probability that an<br />
individual from ( i, j ) will grow to ( i1, j ) after one age interval. In matrix<br />
D, d i j is <strong>the</strong> probability that an individual from ( i, j) will develop to ( i1,<br />
j1 ) after one age interval; in column PM, d i j is <strong>the</strong> probability that an<br />
individual from ( i, j1 ) will develop to ( i1, j1 ) ( from pupa to male ).<br />
In matrix F, f i j is <strong>the</strong> number <strong>of</strong> <strong>of</strong>fsprings that will be reproduced by<br />
every individual in age i <strong>and</strong> stage j.<br />
In matrix G, <strong>the</strong> element g ij (<strong>the</strong> age-stagespecific<br />
growth rate) is <strong>the</strong> probability that<br />
an individual in age i <strong>and</strong> stage j will grow<br />
to age i1 but still be in stage j after one<br />
age interval. In matrix D, d ij (<strong>the</strong> age-stagespecific<br />
developmental rate) is <strong>the</strong> probability<br />
that an individual in age i <strong>and</strong> stage j will<br />
develop to stage j1 <strong>and</strong> be in age i1 after<br />
one age interval. Because female <strong>and</strong> male<br />
will not develop to fur<strong>the</strong>r stages, <strong>the</strong>re are<br />
no d ij <strong>for</strong> <strong>the</strong>m. But <strong>the</strong> pupae can ei<strong>the</strong>r<br />
develop into a female or male. We set <strong>the</strong><br />
probability that a pupa will develop into a<br />
female in column PF <strong>and</strong> <strong>the</strong> probability <strong>for</strong><br />
a male in column PM, thus <strong>the</strong> column m— 1<br />
(PM) contains <strong>the</strong> values <strong>for</strong> pupa to male,<br />
i. e. from n i(m-2) to n (i+1)m (Fig. 2). In matrix,<br />
F, f i j (<strong>the</strong> age-stage-specific fecundity) are <strong>the</strong><br />
number <strong>of</strong> <strong>of</strong>fsprings that will be reproduced<br />
by every individual <strong>of</strong> n ij. In general, only<br />
female have a f i j 0, <strong>and</strong> <strong>the</strong> o<strong>the</strong>r f i j have<br />
<strong>the</strong> value zero. All elements <strong>of</strong> <strong>the</strong>se three<br />
matrices (G, D <strong>and</strong> F) can be obtained in <strong>the</strong><br />
basic life table <strong>study</strong>.<br />
(3) Population growth<br />
When <strong>the</strong> age-stage-structure <strong>of</strong> a population<br />
at time t is known, <strong>the</strong> age-stagestructure<br />
<strong>for</strong> time t+1 can be obtained through<br />
<strong>the</strong> combined operation <strong>of</strong> G , D <strong>and</strong> F:<br />
G, D, F<br />
N t N t+1<br />
The detail calculation procedures are:<br />
k m<br />
n 11 ( t + 1 ) ( ∑ ∑ n i j t f i j )<br />
i = 1 j = 1<br />
n i j ( t + 1 ) n ( i – 1 ) j t g ( i – 1 ) j<br />
<strong>for</strong> j 1 <strong>and</strong> i 1,<br />
n i j ( t + 1 ) n ( i -1 ) j t g ( i – 1 ) j <br />
n ( i - 1) ( j – 1 ) t d ( i – 1 ) ( j – 1 )<br />
<strong>for</strong> 1jm,<br />
n i j ( t + 1 ) n ( i – 1 ) j t g ( i – 1 ) j<br />
n ( i – 1 ) ( j – 2 ) t d ( i – 1 ) ( j – 1 )<br />
<strong>for</strong> jm ( <strong>the</strong> male ).<br />
We need only sum <strong>the</strong> elements in each<br />
row to get <strong>the</strong> age-structure, <strong>and</strong> sum <strong>the</strong>
228 HSIN CHI AND HSI LIU<br />
elements in each column to get <strong>the</strong> stagestructure<br />
(Fig. 1). The total population size<br />
k m<br />
is given by ( n i j ).<br />
With <strong>the</strong> total population size, <strong>the</strong> agestructure<br />
<strong>and</strong> stage-structure, it is easy<br />
to calculate <strong>the</strong> percent age distribution <strong>and</strong><br />
percent stage distribution.<br />
(4) Intrinsic rate <strong>of</strong> increase<br />
The intrinsic rate <strong>of</strong> increase can be<br />
calculated indirectly with <strong>the</strong>se G , D <strong>and</strong> F<br />
matrices. At first, <strong>the</strong> age-specific survival<br />
rate (l x ) <strong>and</strong> <strong>the</strong> age-specific fecundity (m x)<br />
must be derived from matrices G , D <strong>and</strong> F.<br />
For this, <strong>the</strong> age-stage-specific survival rate<br />
(matrix S) must be obtained according to <strong>the</strong><br />
following procedures:<br />
let<br />
s 11=1 <strong>the</strong>n<br />
s ij= s (i-1) j g (i-1) j<br />
<strong>for</strong> j=1 <strong>and</strong> i1,<br />
s ij= s (i-1)j g (i-1)j s (i-1) (j-1) d (i-1) (j-1)<br />
<strong>for</strong> 1j m ,<br />
s ij= s (i-1)j g (i-1)j s (i-1) (j-2) d (i-1) (j-1)<br />
<strong>for</strong> j=m (<strong>the</strong> male).<br />
This s ij gives <strong>the</strong> survivorship <strong>for</strong> <strong>the</strong> <strong>new</strong>born<br />
individual to age i <strong>and</strong> stage j.<br />
To obtain <strong>the</strong> age-specific survival rate<br />
(l x ) , <strong>the</strong> sum <strong>of</strong> each row <strong>of</strong> matrix S is <strong>the</strong>n<br />
calculated from<br />
m<br />
∑<br />
l x = s x j .<br />
j=<br />
1<br />
∑<br />
i=<br />
1<br />
∑<br />
j=<br />
1<br />
The age-specific fecundity (m x) can be<br />
calculated <strong>for</strong> each age group as follows:<br />
m<br />
∑<br />
∑<br />
m x = ( s x j f xj ) / s x j.<br />
j=<br />
1<br />
m<br />
j=<br />
1<br />
By using <strong>the</strong> well-known <strong>for</strong>mula:<br />
∑ e -rx l x m x =1 (Lotka 1913), <strong>the</strong> intrinsic rate<br />
<strong>of</strong> increase (r) can be obtained, <strong>the</strong>n <strong>the</strong> finite<br />
rate <strong>of</strong> increase ) <strong>and</strong> <strong>the</strong> mean length <strong>of</strong><br />
a generation (T ).<br />
It is easy to verify tha <br />
k<br />
∑<br />
x = 1<br />
k<br />
∑<br />
e -rx l x m x = ( e -rx f xj s x j ) =1.<br />
x = 1<br />
m<br />
∑<br />
j=<br />
1<br />
There<strong>for</strong>e, <strong>the</strong> intrinsic rate (r) can be also<br />
calculated directly from<br />
k<br />
∑<br />
m<br />
∑<br />
( e -rx f xj s x j ) =1.<br />
x = 1<br />
j=<br />
1<br />
(5) Age-stage-specific mo rtality (Matrix Q)<br />
<strong>and</strong> <strong>the</strong> distribution <strong>of</strong> mortality<br />
(Matrix P)<br />
The age-stage-specific mortality (q ij) gives<br />
<strong>the</strong> probability that an individual in age i<br />
<strong>and</strong> stage j will die after one age interval<br />
however, <strong>the</strong> distribution <strong>of</strong> mortality (p ij)<br />
is <strong>the</strong> probability that a <strong>new</strong>born individual<br />
will die in age i <strong>and</strong> stage j . According to<br />
<strong>the</strong> previous sections, an individual <strong>of</strong> age i<br />
<strong>and</strong> stage j may grow to age i1 <strong>and</strong> still be<br />
in <strong>the</strong> same stage, or may develop to stage<br />
j1 <strong>and</strong> <strong>the</strong>n be in age i1. The age-stagespecific<br />
mortality can be calculated as follows<br />
q ij =1g ijd ij<br />
<strong>for</strong> jm2,<br />
q ij =1g ijd ijd i(j+1) <strong>for</strong> j=m2,<br />
q ij =1g ij<br />
<strong>for</strong> m2,<br />
The distribution <strong>of</strong> mortality over all<br />
ages <strong>and</strong> stages can be easily obtained by<br />
p i j=q ij s ij.<br />
Fur<strong>the</strong>rmore, S p i 1, S p i 2, …, S p i m give<br />
<strong>the</strong> probabilities that a <strong>new</strong>born individual<br />
will die in stage 1, 2, … , respectively.<br />
These stage mortalities tell us <strong>the</strong> occurrence<br />
<strong>of</strong> mortality in each stage during <strong>the</strong> life<br />
history.<br />
(6) Stable age-stage-distribution<br />
As t? 8, <strong>the</strong> age-stage-structure will settle<br />
down to a stable distribution <strong>and</strong> we have<br />
N t+1 = ? N t .<br />
The stable age-stage-distribution can be<br />
obtained from <strong>the</strong> following equation <br />
<strong>for</strong> j = 1 (<strong>the</strong> first column)<br />
? n 21 = g 11 n 11<br />
? n 31 = g 21 n 21<br />
.<br />
? n k1 = g (k-1)1 n (k-1)1 ,<br />
<strong>for</strong> 1jm [<strong>the</strong> second to (m)th column]<br />
? n ij =d (i-1) (j-1) n (i-1) (j-1) g (i-1) j n (i-1)j
INSECT POPULATION ECOLOGY 229<br />
<strong>for</strong> j=m (<strong>the</strong> last column)<br />
? n ij =d (i-1) (j-1) n (i-1) (j-2) g (i-1) j n (i-1) j<br />
To calculate <strong>the</strong> stable age-stage-distribution,<br />
we set n 11 =1, <strong>and</strong> <strong>the</strong>n derive <strong>the</strong><br />
frequencies <strong>for</strong> all o<strong>the</strong>r ages <strong>and</strong> stages colum<br />
by column using <strong>the</strong> above equations. A<br />
computer program <strong>for</strong> this tedious calculation<br />
is inevitable. As <strong>the</strong> stable age-stage-distribution<br />
is obtained, <strong>the</strong> stable age distribution.<br />
<strong>and</strong> <strong>the</strong> stable stage distribution can be easily<br />
found by summation. For populations with<br />
stage differentiation, <strong>the</strong> stable stage distribution<br />
is obviously more interesting <strong>and</strong><br />
meaningful than <strong>the</strong> stable age distribution.<br />
AN EXAMPLE WITH DIAMONDBACK<br />
MOTH<br />
(1) Material <strong>and</strong> Method<br />
A laboratory population <strong>of</strong> diamondback<br />
moth, Pultella xylostella (L.), was used in this<br />
experiment. For <strong>the</strong> <strong>study</strong> on developmental<br />
time <strong>and</strong> survivorship <strong>of</strong> each preadult stages,<br />
100 fresh leaves <strong>of</strong> Brassica oleracea L. var.<br />
acephala DC, each with one <strong>new</strong>ly laid egg, were<br />
kept separately in petri dishes (9 cm dia.) until<br />
pupation. The fresh leaves were af<strong>for</strong>ded every<br />
day <strong>and</strong> <strong>the</strong>ir stems were wrapped with wet<br />
cotton-wool to maintain <strong>the</strong> freshness <strong>of</strong> <strong>the</strong><br />
leaves. The developmental <strong>and</strong> survival rate<br />
<strong>of</strong> eggs, four larval instars <strong>and</strong> pupae were<br />
recorded daily. When <strong>the</strong> pupae appeared, each<br />
pupa was removed into a finger tube (1cm<br />
dia., 4 cm height), <strong>the</strong>n <strong>the</strong> developmental time<br />
<strong>and</strong> sex were recorded as <strong>the</strong> adults emerged.<br />
The emerged adults were released by pairs<br />
into a plastic cylinder (15 cm dia., 20cm<br />
height) with a fresh leaf <strong>for</strong> egg laying. A<br />
small glass tube (1 cm dia., 1 cm height) with<br />
30% honey solution was served as food <strong>for</strong><br />
adults. All eggs laid in <strong>the</strong> previous day<br />
were counted <strong>and</strong> <strong>the</strong> number <strong>of</strong> surviving<br />
adults were recorded.<br />
The whole life table studies were conducted<br />
in <strong>the</strong> incubators (2 ).<br />
Fig. 3. Stage-frequency distribution <strong>of</strong> P. xylostella at 25. (E-egg stage, L 1 -first<br />
larval instar, L 2-4 -second to fourth larval instars, P-pupal stage, F- female,<br />
M-male).
230 HSIN CHI AND HSI LIU<br />
(2) The stage-frequency distribution from birth to death presented a significant<br />
In order to compare <strong>the</strong> result with <strong>the</strong> overlapping phenomenon (Fig. 3). This points<br />
glasshouse experiment, <strong>the</strong> data were grouped to <strong>the</strong> fact that, when only <strong>the</strong> means are<br />
into 6 stages, namelyegg, L 1 (1st instar used to present <strong>the</strong> developmental times or<br />
larva), L 2- 4 ( 2nd-4th instar larva), pupa, a single curve (l x ) is plotted <strong>for</strong> <strong>the</strong> survivorfemale<br />
<strong>and</strong> male. The stage frequency curve ship, many important features are neglected.<br />
Matrix G<br />
E L 1 L 2-4 P F M<br />
1.00 <br />
1.00 <br />
0 <br />
1.00 <br />
.16 <br />
0 1.00 <br />
1.00 <br />
1.00 <br />
.98 <br />
.98 <br />
.87 1.00 <br />
.62 1.00 <br />
.04 1.00 <br />
1.00 1.00 <br />
0 .98 <br />
.77 1.00 <br />
.30 1.00 1.00<br />
.09 1.00 1.00<br />
1.00 1.00 1.00<br />
0 1.00 1.00<br />
1.00 .95<br />
1.00 .94<br />
1.00 1.00<br />
1.00 .94<br />
1.00 1.00<br />
1.00 1.00<br />
1.00 1.00<br />
.93 1.00<br />
.96 .94<br />
.92 .80<br />
.96 .67<br />
.91 .63<br />
.90 1.00<br />
1.00 1.00<br />
.89 1.00<br />
.94 .80<br />
.88 .75<br />
.71 1.00<br />
.80 1.00<br />
.75 .67<br />
1.00 1.00<br />
1.00 .50<br />
1.00 1.00<br />
1.00 0<br />
1.00 <br />
.83 <br />
1.00 <br />
.60 <br />
.67 <br />
0 <br />
Fig. 4. The age-stage-specific growth rate<br />
(Matrix G) <strong>of</strong> P. xylostella at 25 .<br />
(E-egg stage, L 1 -first larval instar,<br />
L 2-4 -second to fourth larval instars,<br />
P-pupal stage, F-female,M-male).<br />
Matrix D<br />
E L 1 L 2-4 PF PM<br />
0 <br />
0 <br />
.94 <br />
0 <br />
.82 <br />
1.00 0 <br />
0 <br />
0 <br />
0 <br />
.02 <br />
.12 0 0 <br />
.38 0 0 <br />
.96 0 0 <br />
0 0 0 <br />
1.00 .02 0 <br />
.10 .12 <br />
.46 .22 <br />
.45 .45 <br />
0 0 <br />
1.00 0 <br />
<br />
<br />
<br />
<br />
<br />
<br />
<br />
<br />
<br />
<br />
<br />
<br />
<br />
<br />
<br />
<br />
<br />
<br />
<br />
<br />
<br />
<br />
<br />
<br />
<br />
<br />
<br />
<br />
<br />
<br />
Fig. 5. The age-stage-specific developmental<br />
rate (Matrix D) <strong>of</strong> P. xylostella at<br />
25 . Column PF contains <strong>the</strong> de-<br />
velopmental rates from pupal stage<br />
to female, column PM contains <strong>the</strong><br />
rates from pupal stage to male.
(3) The matrices G, D, F, S <strong>and</strong> P<br />
The age-stage-specific growth rate, developmental<br />
rate, <strong>and</strong> fecundity <strong>of</strong> P. xylostella<br />
are given in Fig. 4, Fig. 5 <strong>and</strong> Fig. 6, respecttively.<br />
All <strong>of</strong> <strong>the</strong>se three matrices have 50<br />
rows <strong>and</strong> six columns. The matrix S (<strong>the</strong><br />
age-stage-specific survival rate, Fig. 7) <strong>and</strong> <strong>the</strong><br />
Matrix<br />
E L 1 L 2-4 P F M<br />
0 <br />
0 <br />
0 <br />
0 <br />
0 <br />
0 0 <br />
0 <br />
0 <br />
0 <br />
0 <br />
0 0 <br />
0 0 <br />
0 0 <br />
0 0 <br />
0 0 <br />
0 0 <br />
0 11.00 0<br />
0 15.00 0<br />
0 33.36 0<br />
0 36.96 0<br />
25.38 0<br />
26.00 0<br />
15.59 0<br />
12.48 0<br />
12.90 0<br />
10.59 0<br />
7.55 0<br />
6.21 0<br />
5.67 0<br />
5.23 0<br />
4.88 0<br />
3.83 0<br />
2.62 0<br />
2.11 0<br />
1.58 0<br />
2.53 0<br />
1.81 0<br />
1.71 0<br />
1.70 1.13 0<br />
1.50 0<br />
1.33 .67 0<br />
.67 0<br />
<br />
0 <br />
0 <br />
<br />
0 <br />
0 <br />
Fig. 6. The age-stage-specific fecundity (Matrix<br />
F) <strong>of</strong> P. xylostella at 25. (E-egg stage,<br />
L 1 -first larval instar, L 2- 4 -second to<br />
fourth larval instars, P-pupal stage, F-<br />
female, M-male).<br />
F<br />
INSECT POPULATION ECOLOGY 231<br />
matrix P (<strong>the</strong> distribution <strong>of</strong> mortality, Fig.<br />
8) are obtained according to <strong>the</strong> method <strong>of</strong><br />
<strong>the</strong> previous sections. It is interesting to<br />
point out, that if <strong>the</strong> age-stage-specific survival<br />
rate is plotted against age, it gives exactly<br />
<strong>the</strong> same curve <strong>of</strong> stage frequency distribution<br />
(Fig. 3).<br />
Matrix<br />
E L 1 L 2-4 P F M<br />
1.00 <br />
1.00 <br />
1.00 <br />
.94 <br />
.94 <br />
.15 .78 <br />
.93 <br />
.93 <br />
.93 <br />
.91 <br />
.89 .02 <br />
.78 .13 <br />
.48 .43 <br />
.02 .89 <br />
.02 .89 <br />
.89 .02 <br />
.69 .11 .11<br />
.20 .43 .26<br />
.02 .52 .35<br />
.02 .52 .35<br />
.54 .35<br />
.54 .33<br />
.54 .31<br />
.54 .31<br />
.54 .30<br />
.54 .30<br />
.54 .30<br />
.54 .30<br />
.50 .30<br />
.48 .28<br />
.44 .22<br />
.43 .15<br />
.39 .09<br />
.35 .09<br />
.35 .09<br />
.31 .09<br />
.30 .07<br />
.26 .06<br />
.19 .06<br />
.15 .06<br />
.11 .04<br />
.11 .04<br />
.11 .02<br />
.11 .02<br />
.11 <br />
.11 <br />
.09 <br />
.09 <br />
.06 <br />
.04 <br />
Fig. 7. The age-stage-specific survival rate<br />
(Matrix S) <strong>of</strong> P. xylostella at 25.<br />
(E-egg stage, L 1 -first larval instar,<br />
L 2-4 -second to furth larval instars,<br />
P-pupal stage, F-female, M-male).<br />
S
232 HSIN CHI AND HSI LIU<br />
TABLE 1<br />
The population parameters <strong>of</strong><br />
P. xylostella at 25<br />
The intrinsic rate <strong>of</strong> increase (r) 0.2229<br />
The net reproductive rate (R 0 ) 120.93<br />
The mean generation time (T) 21.51<br />
The finite rate <strong>of</strong> increase ) 1.2497<br />
e -rx l x m x=1 <strong>and</strong> (e -rx s xj f xj)=1. The<br />
same results are obtained from both <strong>for</strong>mulae.<br />
The detail data are given in Table 1.<br />
The stable age-stage-distribution <strong>of</strong> P.<br />
xylostella is calculated according to <strong>the</strong><br />
procedure <strong>of</strong> <strong>the</strong> previous section <strong>and</strong> is given<br />
in Fig. 9. In Fig. 9 <strong>the</strong> stable age distribution<br />
<strong>and</strong> stable stage distribution are also listed.<br />
(1) Basic concept<br />
THE MULTIDIMENSIONAL<br />
MATRIX MODEL<br />
Fig. 8. The distribution <strong>of</strong> mortality (Matrix<br />
P) <strong>of</strong> P. xylostella at 25. (E-egg<br />
stage, L 1 -first larval instar, L 2-4 -second<br />
to fourth larval instars, P-pupal stage,<br />
F-female, M-male). (There are round<strong>of</strong>f<br />
errors).<br />
(4) The intrinsic rate <strong>of</strong> increase <strong>and</strong> <strong>the</strong> stable<br />
age-stage-distribution <strong>of</strong> P. xylostella at<br />
25.<br />
With matrices F <strong>and</strong> S <strong>the</strong> intrinsic rate<br />
<strong>of</strong> increase are obtained by using <strong>for</strong>mulae<br />
The basic concept <strong>of</strong> <strong>the</strong> spatial distribution<br />
<strong>of</strong> host plants <strong>and</strong> <strong>the</strong> age-structure <strong>of</strong><br />
<strong>insect</strong>s on <strong>the</strong>m is displayed in Fig. 10.<br />
According to Fig. 10, if we use a three<br />
dimensional matrix N to represent this field<br />
population, <strong>the</strong>n <strong>the</strong> element n 6,3,1 gives <strong>the</strong><br />
number <strong>of</strong> individuals aged six <strong>and</strong> on <strong>the</strong><br />
host plant (or in <strong>the</strong> habitat) located at third<br />
column <strong>and</strong> first row. For example, n 6,3,1 =5<br />
denotes that <strong>the</strong>re are five individuals aged<br />
six on that host plant. Using this concept we<br />
can set <strong>the</strong> total field population into such a<br />
three dimensional matrix. Each hostplant has<br />
its own subpopulation <strong>and</strong> <strong>the</strong> spatial location<br />
is given by <strong>the</strong> subscripts.<br />
However, <strong>for</strong> those animals with metamorphosis,<br />
such as <strong>insect</strong>s <strong>and</strong> mites, <strong>the</strong><br />
inadequacy <strong>of</strong> single column matrix <strong>for</strong><br />
population structure has been discussed in<br />
previous sections. Combining this concept pf<br />
multidimensional matrix <strong>for</strong> spatial distribution<br />
<strong>and</strong> that <strong>of</strong> multiple column matrix<br />
<strong>for</strong> age-stage-structure, a four dimensional<br />
matrix is used to represent <strong>the</strong> age-stagestructure<br />
<strong>of</strong> <strong>insect</strong> population in field. Thus,
INSECT POPULATION ECOLOGY 233<br />
Fig. 9. The stable age-stage-distribution, stable age-distribution <strong>and</strong> stable<br />
stage-distribution <strong>of</strong> P. xylostella at 25. ( E-egg stage, L 1 -first<br />
larval instar, L 2-4 -second to fourth larval instars, P-pupal stage,<br />
F-female, M-male). (There are round-<strong>of</strong>f errors).
234 HSIN CHI AND HSI LIU<br />
Fig. 10. The basic concept <strong>of</strong> multidimensional matrix model <strong>for</strong> field<br />
population. n 6 ,3 ,1 =5 denotes that <strong>the</strong>re are five individuals<br />
aged six on <strong>the</strong> host plant located at third column <strong>and</strong> first<br />
row. Each “?” denotes a host plant.<br />
n 8 ,4 ,3 ,1 =5 denotes that <strong>the</strong>re are five individuals<br />
aged eight <strong>and</strong> in fourth stages on <strong>the</strong><br />
plant located at third column <strong>and</strong> first row.<br />
This four dimensional matrix can not be<br />
displayed with a figure. Due to <strong>the</strong> complexity<br />
<strong>of</strong> data, computer is an inevitable tool<br />
in this work. <strong>Two</strong> large computer programs<br />
have been designed in FORTRAN V, one <strong>for</strong><br />
three dimensional matrix model ( program<br />
TDMSLBH ) <strong>and</strong> <strong>the</strong> o<strong>the</strong>r <strong>for</strong> four dimensional<br />
matrix model ( program FDMSLBH ).<br />
In order to avoid <strong>the</strong> complicate subscripts<br />
<strong>of</strong> n 8 , 4 ,3 ,1 , <strong>the</strong> expression <strong>of</strong> FORTRAN<br />
language can be used. For example, <strong>the</strong><br />
general <strong>for</strong>m <strong>of</strong> elements in population matrix<br />
is written as POPU ( AGE,COLUMN,ROW )<br />
in TDMSLBH, or as POPU(AGE,STAGE<br />
COLUMN,ROW ) in FDMSLBH. Thus, POPU<br />
(I, J, K, L)=5 denotes that <strong>the</strong>re are five<br />
individuals in age I <strong>and</strong> stage J on <strong>the</strong> hostplant<br />
located at row L <strong>and</strong> column K. These<br />
expressions are more readable, but yet have<br />
not been generally used.<br />
In accompany with matrix POPU, ano<strong>the</strong>r<br />
matrix PLANT ( or HABITAT) is used to<br />
express <strong>the</strong> existence <strong>of</strong> a hostplant or habitat.<br />
For example, PLANT ( L, K )=0 denotes <strong>the</strong>re<br />
is no plant located at row L <strong>and</strong> column K,<br />
PLANT ( L, K )=1 denotes <strong>the</strong>n <strong>the</strong> existence<br />
<strong>of</strong> a hostplant at row L <strong>and</strong> column K.<br />
Using matrix PLANT <strong>the</strong> configuration <strong>of</strong><br />
field can be determined.<br />
In <strong>the</strong> following sections only <strong>the</strong> general<br />
features <strong>of</strong> this <strong>new</strong> method will be discussed.<br />
For different <strong>insect</strong> species <strong>and</strong> hostplant o<strong>the</strong>r<br />
relevant factors can be inserted to make it<br />
more suitable <strong>for</strong> <strong>the</strong>m.<br />
(2) Population growth<br />
If <strong>the</strong> field population structure at time t<br />
is known, <strong>the</strong>n <strong>the</strong> population structure <strong>for</strong><br />
time t1 can be obtained through proper
INSECT POPULATION ECOLOGY 235<br />
calculations. When a single column matrix<br />
is used <strong>for</strong> <strong>the</strong> age structure <strong>of</strong> each subpopulation<br />
( in program TDMSLBH ), <strong>the</strong>n <strong>the</strong><br />
simple matrix multiplication can be followed<br />
in order to find <strong>the</strong> age structure <strong>of</strong> each<br />
subpopulation at time t1. For this, a square<br />
matrix containing age-specific survival rate<br />
<strong>and</strong> fecundity is required ( Lewis 1942).<br />
However, when <strong>the</strong>re is significant stage<br />
overlapping phenomenon, e. g. in most <strong>insect</strong><br />
<strong>and</strong> mite populations, <strong>the</strong> method <strong>of</strong> multiple<br />
column matrix should be followed ( in program<br />
FDMSLBH ). For this, <strong>the</strong> age-stagespecific<br />
growth rate, developmental rate <strong>and</strong><br />
fecundity ( matrices G, D <strong>and</strong> F ) are required.<br />
(3) The carrying capacity <strong>of</strong> host plant<br />
The carrying capacity increases generally<br />
with <strong>the</strong> growth <strong>of</strong> host plant. Thus, it is<br />
necessary to know <strong>the</strong> carrying capacity<br />
( array name KVALUE(T) is used in computer<br />
program ) <strong>of</strong> host plant <strong>for</strong> each time.<br />
These time-specific KVALUE(T) can be ei<strong>the</strong>r<br />
direct input as real numbers or given with a<br />
function <strong>of</strong> time. Here, <strong>the</strong> unit <strong>of</strong> KVALUE<br />
must be properly selected. In our <strong>study</strong>, a<br />
fourth instar larva <strong>of</strong> <strong>the</strong> diamondback moth,<br />
P. xylostella, was used as a st<strong>and</strong>ard unit. A<br />
KVALUE(10)=20 means that <strong>the</strong> carrying<br />
capacity <strong>of</strong> host plant at t=10 is equivalent<br />
to twenty larvae <strong>of</strong> fourth instar. Although<br />
<strong>the</strong> carrying capacity may also depend on<br />
o<strong>the</strong>r factors, <strong>for</strong> <strong>the</strong> general introduction<br />
only <strong>the</strong> time-specific KVALUE is taken into<br />
account in this paper.<br />
(4) Dispersion<br />
The dispersion <strong>of</strong> an <strong>insect</strong> from a host<br />
plant to o<strong>the</strong>r may be density-dependent or<br />
density-independent <strong>and</strong> it may be variate<br />
from stage to stage; fur<strong>the</strong>rmore, <strong>the</strong> dispersal<br />
ability may be also different among stages.<br />
For example, <strong>the</strong> adults <strong>of</strong> flying <strong>insect</strong> may<br />
fly away from a host plant whatever <strong>the</strong><br />
density is high or low. Whereas, a larva will<br />
crawl to next plant only when <strong>the</strong> density is<br />
high ( in comparison with <strong>the</strong> time-specific<br />
KVALUE, <strong>and</strong> <strong>the</strong> o<strong>the</strong>r physical disturbances<br />
will not be considered ). Here, <strong>the</strong> density is<br />
not <strong>the</strong> sum <strong>of</strong> total population, a more convienient<br />
expression is <strong>the</strong> sum <strong>of</strong> <strong>the</strong> products<br />
<strong>of</strong> <strong>the</strong> number <strong>of</strong> individual in each stage<br />
multiplied by <strong>the</strong> respective stage-specific<br />
weighing coefficient (<strong>the</strong> array name KWEIGH<br />
is used in program). For practical use, we<br />
suggest that <strong>the</strong> stage-specific KWEIGH is to<br />
be experimentally determined <strong>and</strong> <strong>the</strong> difference<br />
among ages <strong>of</strong> <strong>the</strong> same stage can be<br />
neglected. For example, according to <strong>the</strong> leaf<br />
consumption <strong>of</strong> different larval instars, <strong>the</strong><br />
stage-specific KWEIGH <strong>for</strong> <strong>the</strong> fourth larval<br />
instar is 1, <strong>for</strong> third is 0.6, <strong>for</strong> <strong>the</strong> second is<br />
0.2 <strong>and</strong> <strong>for</strong> all o<strong>the</strong>r stages are 0. Then , <strong>the</strong><br />
density <strong>of</strong> this pest on a host plant (<strong>the</strong> array<br />
name KDENSIT is use) can be calculated<br />
from<br />
KDENSIT <br />
where STAGE(J) is <strong>the</strong> number <strong>of</strong> individuals<br />
in stage J on that host plant. The occurrence<br />
<strong>of</strong> density-dependent dispersion depends on<br />
<strong>the</strong> value <strong>of</strong> KDENSIT in comparison with<br />
KVALUE, <strong>the</strong> numerical relationship must be<br />
experimentally determined.<br />
The dispersal distance depends on <strong>the</strong><br />
behavior ability. For example, an adult <strong>of</strong><br />
diamondback moth can fly to anywhere in a<br />
field, but a larva may only crawl to one <strong>of</strong><br />
<strong>the</strong> surrounding plants. To each stage J a<br />
code can be assigned, this code is used to<br />
represent <strong>the</strong> stage-specific dispersal ability<br />
( <strong>the</strong> array name DISPAB(J) is used ). The<br />
direction <strong>of</strong> dispersal will be determined by<br />
r<strong>and</strong>om number. If an individual fails to find<br />
a <strong>new</strong> host plant or <strong>the</strong> <strong>new</strong> plant has already<br />
a high KDENSIT, it will die. As a matter<br />
<strong>of</strong> fact, <strong>the</strong> spatial distribution <strong>of</strong> a population<br />
changes with time. In TDMSLBH <strong>and</strong><br />
FDMSLBH, <strong>the</strong> means <strong>and</strong> variances will be<br />
calculated <strong>and</strong> <strong>the</strong> variance/mean ratios will<br />
be plotted against time. This gives a preliminary<br />
description <strong>of</strong> <strong>the</strong> dynamical change<br />
<strong>of</strong> distribution pattern. A mapping subroutine<br />
can be called at any time when a detail field<br />
distribution <strong>of</strong> pest population is needed, this
236 HSIN CHI AND HSI LIU<br />
makes <strong>the</strong> change more comprehensible <strong>and</strong><br />
is especially helpful in teaching entomology.<br />
GLASSHOUSE RELEASE EXPERIMENT<br />
AND COMPUTER SIMULATION<br />
(1) Material <strong>and</strong> method<br />
Fifteen pairs <strong>of</strong> adults <strong>of</strong> diamondback<br />
moth, <strong>new</strong>ly emerged from pupae, were<br />
released into <strong>the</strong> glasshouse. In <strong>the</strong> glasshouse,<br />
100 pots <strong>of</strong> ca. 60 days-old Brassica oleracea L.<br />
var. acephala DC were arranged into three<br />
blocks, each with 33, 34 <strong>and</strong> 33 pots. The number<br />
<strong>of</strong> larvae ( 2nd-4th instars ) <strong>and</strong> pupae were<br />
investigated every 3-5 days. The temperature<br />
<strong>and</strong> humidity were recorded every day. The<br />
results were compared with <strong>the</strong> simulation<br />
results by running program FDMSLBH. The<br />
released fifteen pairs <strong>of</strong> adults were assumed<br />
to be r<strong>and</strong>omly distributed.<br />
(2) Comparison between population growth in<br />
glasshouse <strong>and</strong> in computer simulation<br />
The population growth curves obtained<br />
in <strong>the</strong> glasshouse release experiment are<br />
illustrated in Fig. 11 <strong>and</strong> Fig. 12. Due to <strong>the</strong><br />
fact that <strong>the</strong> life table data were recorded<br />
under special laboratory conditions, it was<br />
reasonable to believe that <strong>the</strong>re was a difference<br />
between <strong>the</strong> results <strong>of</strong> laboratory <strong>and</strong><br />
<strong>of</strong> glasshouse conditions. Because <strong>the</strong> exact<br />
differences in growth rate, developmental rate<br />
<strong>and</strong> fecundity have not been experimentally<br />
studied, <strong>the</strong> half, <strong>the</strong> fifth, <strong>the</strong> tenth <strong>and</strong> <strong>the</strong><br />
twentieth <strong>of</strong> <strong>the</strong> age-stage-specific fecundity<br />
were used in this preliminary simulation. The<br />
simulated growth curves are also plotted in<br />
Fig. 11 <strong>and</strong> Fig. 12. The curves <strong>of</strong> simulated<br />
<strong>and</strong> observed variance/mean ratios were<br />
plotted against time ( Fig. 13 ). Due to <strong>the</strong><br />
r<strong>and</strong>omized r<strong>and</strong>om numbers were used in<br />
FDMSLBH, different results have been obtained<br />
from every simulations. ( If <strong>the</strong> same<br />
result was obtained from every simulation,<br />
<strong>the</strong>n <strong>the</strong> same sequence <strong>of</strong> r<strong>and</strong>om number<br />
had been used. This must be carefully avoided<br />
in programming ). This can be used to<br />
simulate <strong>the</strong> variability in population growth<br />
<strong>and</strong> dispersion, which was as results <strong>of</strong><br />
Fig. 11. The observed (? -?) <strong>and</strong> four simulated population growth curves <strong>for</strong> larvae<br />
( 2nd-4th instars ) <strong>of</strong> P. xylostella. The simulations were conducted by using<br />
f i j /2 (? -?), f i j /5 ( - ), f i j /10 (?-?) <strong>and</strong> f i j/ 20 ( - ), respectively.<br />
INSECT POPULATION ECOLOGY 237
Fig. 12. The observed (? -?) <strong>and</strong> four simulated population growth curves <strong>for</strong><br />
pupal stage <strong>of</strong> P. xylostella. The simulations were conducted by using<br />
f i j /2 (? -?), f i j /5 ( - ), f i j /10 (?-?) <strong>and</strong> f i j/ 20 ( - ), respectively.<br />
Fig. 13. The observed (? -?) <strong>and</strong> three simulated (? -?, - , ?-?) curves <strong>of</strong><br />
variance / mean ratios <strong>for</strong> diamondback moth ( P. xylostella )( 2nd-4th<br />
instar larvae <strong>and</strong> pupae toge<strong>the</strong>r). The three simulations were conducted<br />
by using <strong>the</strong> same f i j /10.<br />
238 HSIN CHI AND HSI LIU
Fig. 14. Examples <strong>of</strong> computer mapping <strong>for</strong> <strong>the</strong> field distribution <strong>of</strong> P. xylostella<br />
at different time. The symbols are “ -egg, ” “-”-larva, “i”-female<br />
<strong>and</strong> “/”-male. Overprinting allowed all stages to be printed in a single<br />
map. Due to reductions, <strong>the</strong> symbols cannot be distinguished.<br />
dispersion in different directions or due to <strong>the</strong><br />
occurrence <strong>of</strong> mortality, when movement<br />
ended in a hostile plant ( i. e. already with a<br />
high pest density ). This kind <strong>of</strong> variability<br />
has not been noted in o<strong>the</strong>r stochastic models,<br />
but it does play an important role in <strong>the</strong> true<br />
ecosystem ( e. g. Jennings et al., 1983 ). Although<br />
<strong>the</strong>re were differences among simulated<br />
<strong>and</strong> observed curves, but <strong>the</strong> tendencies were<br />
alike. For this preliminary simulation, fur<strong>the</strong>r<br />
explanations to <strong>the</strong>se differences were not<br />
given.<br />
Examples <strong>of</strong> computer mapping are<br />
displayed in Fig. 14. Different symbols were<br />
used to represent individuals <strong>of</strong> different stages<br />
<strong>and</strong> <strong>the</strong> overprinting allowed all stages to be<br />
printed in a single map. However, due to<br />
several reductions, <strong>the</strong> symbols cannot be<br />
distinguished. The mapping results <strong>of</strong> each<br />
simulation were also different from one<br />
ano<strong>the</strong>r. This can be used to <strong>study</strong> <strong>the</strong><br />
variability <strong>of</strong> field distribution.<br />
DISCUSSION<br />
In this paper, two <strong>new</strong> <strong>methods</strong> with<br />
respect to population growth <strong>of</strong> <strong>insect</strong>s <strong>and</strong><br />
mites have been introduced. The first method<br />
is concerned with stage overlapping. Here,<br />
<strong>the</strong> stage overlapping does not mean simply<br />
<strong>the</strong> occurrence <strong>of</strong> different stages in field at<br />
<strong>the</strong> same time. It means <strong>the</strong> overlapping <strong>of</strong><br />
different stages during <strong>the</strong> development process<br />
<strong>of</strong> individuals reproduced at <strong>the</strong> same day.<br />
For a more precise <strong>and</strong> reasonable <strong>study</strong> <strong>of</strong><br />
population growth, such stage overlapping<br />
phenomenon should never be neglected ei<strong>the</strong>r<br />
in <strong>the</strong>oretical or applied ecology. In this<br />
paper, we have developed a straight<strong>for</strong>ward<br />
<strong>and</strong> biologically realistic method, in which<br />
<strong>the</strong> survival rate is taken as a composition <strong>of</strong><br />
growth rate <strong>and</strong> developmental rate <strong>and</strong> <strong>the</strong><br />
age-stage-structure <strong>of</strong> population is given in a<br />
multiple column matrix. The detail algorithms<br />
<strong>for</strong> this <strong>new</strong> method have been described in<br />
respective sections.
INSECT POPULATION ECOLOGY 239<br />
However, <strong>the</strong> population growth is not<br />
merely an event <strong>of</strong> numerical change with<br />
time. As a matter <strong>of</strong> fact, individuals <strong>of</strong><br />
population distributed <strong>the</strong>mselves ra<strong>the</strong>r ununi<strong>for</strong>mly<br />
in fields ( Taylor 1961). If we <strong>study</strong><br />
<strong>the</strong> population growth without considering<br />
<strong>the</strong> spatial distribution, <strong>the</strong>n we may lose<br />
ourselves in numbers <strong>and</strong> overlook some<br />
important features. On <strong>the</strong> o<strong>the</strong>r h<strong>and</strong>, if we<br />
<strong>study</strong> <strong>the</strong> spatial distribution but without<br />
considering <strong>the</strong> population growth, <strong>the</strong>n we<br />
will lose <strong>the</strong> dynamic feature <strong>of</strong> spatial<br />
distribution. For <strong>the</strong> <strong>study</strong> <strong>of</strong> <strong>the</strong> growth <strong>of</strong><br />
a “true” population, we have to set <strong>the</strong><br />
population into a space <strong>and</strong> consider <strong>the</strong><br />
changes in number <strong>and</strong> spatial distribution at<br />
<strong>the</strong> same time. Using a multidimensional<br />
matrix it is possible to do this work; <strong>the</strong><br />
population is <strong>the</strong>n taken as composition <strong>of</strong><br />
subpopulations, each subpopulation lives on<br />
its host plant <strong>and</strong> has its own age structure<br />
( or age-stage-structure ). Thus, we have <strong>the</strong><br />
age structure <strong>and</strong> spatial distribution in one<br />
model. The basic concepts have been discussed<br />
in this paper. For practical application to<br />
specific pest <strong>and</strong> host plant, o<strong>the</strong>r relevant<br />
factors must be taken into account.<br />
The multiple column matrix model is in<br />
principle developed <strong>for</strong> <strong>the</strong>oretical <strong>study</strong> on<br />
population growth with stage grouping. The<br />
multidimensional matrix model is <strong>the</strong>n <strong>for</strong><br />
<strong>the</strong> combined <strong>study</strong> <strong>of</strong> population growth <strong>and</strong><br />
dispersion. If <strong>the</strong> predator or parasite is going<br />
to be included in this model, a five dimensional<br />
matrix is necessary. The matrix SYSTEM<br />
( SPECIES,AGE,STAGE,COLUMN,ROW ) can<br />
be assigned <strong>for</strong> system simulation. Then,<br />
<strong>the</strong> experimental results such as Huffaker’s<br />
report ( 1958 ) perhaps can be studied using<br />
this method. Fur<strong>the</strong>rmore, when using <strong>the</strong>se<br />
concepts to <strong>study</strong> <strong>the</strong> intra-plant distribution<br />
on large host plant, such as trees, <strong>the</strong>n<br />
ano<strong>the</strong>r subscript HEIGHT must be used<br />
to construct <strong>the</strong> spatial structure<strong>for</strong><br />
example, POPU( AGE,STAGE,COLUMN,ROW,<br />
HEIGHT ) <strong>for</strong> <strong>the</strong> single species model or<br />
SYSTEM ( SPECIES,AGE,STAGE,COLUMN,<br />
ROW,HEIGHT ) <strong>for</strong> system simulation. Of<br />
course, it needs large memory to store <strong>the</strong><br />
matrix POPU <strong>and</strong> SYSTEM, <strong>and</strong> <strong>the</strong> simulation<br />
program can be run only on a large<br />
computer. However, it is not necessary to<br />
assign a large matrix <strong>for</strong> a field <strong>of</strong> hectares,<br />
but it must be large enough to reproduce <strong>the</strong><br />
important features <strong>of</strong> a “real” population. If<br />
<strong>the</strong> simulation can give more precise in<strong>for</strong>mation<br />
about field distribution, <strong>the</strong>n it is<br />
possible to know how many host plants bear<br />
a pest number over <strong>the</strong> predefined economic<br />
injury level, <strong>and</strong> this will be better than to<br />
use a single value, <strong>the</strong> mean density. On <strong>the</strong><br />
o<strong>the</strong>r h<strong>and</strong>, if <strong>the</strong> growth <strong>and</strong> dispersion <strong>of</strong><br />
vector population can be precisely studied,<br />
<strong>the</strong>n <strong>the</strong> research on epidemiology <strong>of</strong> plant<br />
disease transmitted by <strong>insect</strong> can be improved.<br />
The combined <strong>study</strong> <strong>of</strong> <strong>the</strong> growth <strong>and</strong><br />
dispersion is important not only <strong>for</strong> simulation<br />
works using calendar time, but also <strong>for</strong><br />
those using physiological time. We are<br />
interested in incorporating <strong>the</strong>se concepts in<br />
such simulation models. The main ongoing<br />
works in our laboratory are <strong>the</strong> fur<strong>the</strong>r<br />
development <strong>of</strong> <strong>the</strong>ories <strong>of</strong> population growth<br />
<strong>and</strong> <strong>the</strong>ir practical use in system simulation.<br />
REFERENCES<br />
ASHLEY, T. R (1976) Computer program <strong>for</strong><br />
analyzing parasitoid-host or predator-prey relationships.<br />
Fla. Entomol. 59: 27-32.<br />
CAREY, J. R. (1982) Demography <strong>and</strong> population<br />
dynamics <strong>of</strong> <strong>the</strong> Mediterranean fruit fly. Ecol.<br />
Modelling. 16: 125-150.<br />
CHI, H.(1981) Die Vermehrungsrate von Hypoaspis<br />
aculeifer Canestrini (Acarina, Laelapidae) bei<br />
Ernährung mit Onychiurus fimatus Gisin (Collembola,<br />
Onychiuridae) unter verschiedenen<br />
Temperaturen. Mitt. dtsch. Ges. allg. angew.<br />
Ent. 3:122-125.<br />
FULTON, W. C. <strong>and</strong> D. L. HAYNES (1975) Computer<br />
mapping in pest management. Environ.Entomol.<br />
4: 357-360.<br />
HAYNES, D. L. <strong>and</strong> R. L.TUMMALA (1978) Application<br />
<strong>of</strong> computer technology to pest manage<br />
ment. In pest Control Strategies (E. H. Smith<br />
<strong>and</strong> D. Pimentel, eds.). Academic Press, New<br />
York <strong>and</strong> London. pp. 181-201.
240 HSIN CHI AND HSI LIU<br />
HUFFAKER, C. B. (1958) Experimental studies on<br />
predation: Dispersion factors <strong>and</strong> predatorprey<br />
oscillations. Hilgardia. 27: 343-385.<br />
JENNINGS D. T., M. W. HOUSEWEART <strong>and</strong> J. B.<br />
DIMOND (1983) Dispersal losses <strong>of</strong> early-instar<br />
spruce budworm ( Lepidoptera: Tortricidae )<br />
larval in strip clearcut <strong>and</strong> dense spruce-fir<br />
<strong>for</strong>est <strong>of</strong> Main. Environ. Entomol. 12: 1787-<br />
1792.<br />
LEFKOVITCH, L. P. (1965) The <strong>study</strong> <strong>of</strong> population<br />
growth in organisms grouped by stages. Biometrics.<br />
21: 1-18.<br />
LESLIE, P. H. (1945) On <strong>the</strong> use <strong>of</strong> matrices in<br />
certain population ma<strong>the</strong>matics. Biometrika.<br />
33: 183-212.<br />
LESLIE, P. H. (1948) Some fur<strong>the</strong>r notes on <strong>the</strong><br />
use <strong>of</strong> matrices in population ma<strong>the</strong>matics.<br />
Biometrika. 35: 213-245.<br />
LEWIS, E. G. (1942) On <strong>the</strong> generation <strong>and</strong> growth<br />
<strong>of</strong> a population. Sankhya. 6: 93-96.<br />
LONGSTAFF, B. C. (1977) The dynamics<strong>of</strong> collembolan<br />
population: a matrix <strong>of</strong> single<br />
species population growth. Can. J. Zool. 55:<br />
314-324.<br />
LOTKA, A. J. (1913) A natural population norm.<br />
J. Wash. Acad. Sci. 3: 241-248, 289-293.<br />
MANLY, B. F. J.(1974) Estimation <strong>of</strong> stage-specific<br />
survival rates <strong>and</strong> <strong>the</strong>r parameters <strong>for</strong> <strong>insect</strong><br />
populations developing through several stages.<br />
Oecologia. 15:227-285.<br />
PENNYCUICK, C. J., R. M. COMPTON <strong>and</strong> L. BECKING-<br />
HAM (1968) A computer model <strong>for</strong> simulating<br />
<strong>the</strong> growth <strong>of</strong> a population, or <strong>of</strong> two interacting<br />
populations. J. Theor. Biol. 18: 316-329.<br />
TAYLOR, L. R. (1961) Aggregation, variance <strong>and</strong><br />
<strong>the</strong> mean. Nature. 189: 732-735.<br />
TAYLOR, L. R. <strong>and</strong> R. A. J. TAYLOR (1977) Aggregation,<br />
migration <strong>and</strong> population mechanics.<br />
Nature. 265: 415-421.<br />
VAN STRAALEN, N. M.(1982)Demographic analysis<br />
<strong>of</strong> arthropod populations using a continuous<br />
stage-variable. J. Anim. Ecol. 51: 769-783.<br />
WELLINGTON, W. G., P. J. CAMERON, W. A. THOMP-<br />
SON, I. B. VERTINSKY <strong>and</strong> A. S. LANDSBERG<br />
(1975) A stochastic model <strong>for</strong> assessing <strong>the</strong><br />
effects <strong>of</strong> external <strong>and</strong> internal heterogeneity<br />
on an <strong>insect</strong> population. Res. Popul. Ecol. 17:<br />
1-28.