Introduction to Survey Data Analysis - Survey Research Laboratory
Introduction to Survey Data Analysis - Survey Research Laboratory
Introduction to Survey Data Analysis - Survey Research Laboratory

Create successful ePaper yourself
Turn your PDF publications into a flip-book with our unique Google optimized e-Paper software.
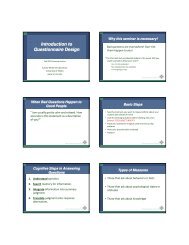
<strong>Introduction</strong> <strong>to</strong> <strong>Survey</strong> <strong>Data</strong><br />
<strong>Analysis</strong><br />
Young Ik Cho, PhD<br />
<strong>Research</strong> Assistant Professor<br />
<strong>Survey</strong> <strong>Research</strong> Labora<strong>to</strong>ry<br />
University of Illinois at Chicago<br />
Fall 2008<br />
<strong>Survey</strong> <strong>Research</strong> Labora<strong>to</strong>ry<br />
Focus of the Seminar<br />
• <strong>Data</strong> Cleaning/Missing <strong>Data</strong><br />
• Sampling Bias Reduction<br />
<strong>Survey</strong> <strong>Research</strong> Labora<strong>to</strong>ry<br />
When analyzing survey data . . .<br />
1. Understand & evaluate survey<br />
design<br />
2. Screen the data<br />
3. Adjust for sampling design<br />
<strong>Survey</strong> <strong>Research</strong> Labora<strong>to</strong>ry<br />
1
1. Understand & Evaluate <strong>Survey</strong><br />
• Conduc<strong>to</strong>r of survey<br />
• Sponsor of survey<br />
• Measured variables<br />
• Unit of analysis<br />
• Mode of data collection<br />
• Dates of data collection<br />
<strong>Survey</strong> <strong>Research</strong> Labora<strong>to</strong>ry<br />
1. Understand & Evaluate <strong>Survey</strong><br />
• Geographic coverage<br />
• Respondent eligibility criteria<br />
• Sample design<br />
• Sample size & response rate<br />
<strong>Survey</strong> <strong>Research</strong> Labora<strong>to</strong>ry<br />
Levels of Measurement<br />
•Nominal<br />
•Ordinal<br />
•Interval<br />
•Ratio<br />
<strong>Survey</strong> <strong>Research</strong> Labora<strong>to</strong>ry<br />
2
2. <strong>Data</strong> Screening<br />
Examine raw frequency distributions<br />
for …<br />
(a) out-of-range values (outliers)<br />
(b) missing values<br />
<strong>Survey</strong> <strong>Research</strong> Labora<strong>to</strong>ry<br />
2. <strong>Data</strong> Screening<br />
Out-of-range values:<br />
• Delete <strong>Data</strong><br />
• Recode Values<br />
<strong>Survey</strong> <strong>Research</strong> Labora<strong>to</strong>ry<br />
Missing <strong>Data</strong>:<br />
• can reduce effective sample size<br />
• may introduce bias<br />
<strong>Survey</strong> <strong>Research</strong> Labora<strong>to</strong>ry<br />
3
Reasons for Missing <strong>Data</strong><br />
• Refusals (question sensitivity)<br />
• Don’t know responses (cognitive<br />
problems, memory problems)<br />
• Not applicable<br />
• <strong>Data</strong> processing errors<br />
• Questionnaire programming errors<br />
• Design fac<strong>to</strong>rs<br />
• Attrition in panel studies<br />
<strong>Survey</strong> <strong>Research</strong> Labora<strong>to</strong>ry<br />
Effects of Ignoring Missing <strong>Data</strong><br />
• Reduced sample size – loss of<br />
statistical power<br />
• <strong>Data</strong> may no longer be representative<br />
– introduces bias<br />
• Difficult <strong>to</strong> identify effects<br />
<strong>Survey</strong> <strong>Research</strong> Labora<strong>to</strong>ry<br />
Assumptions on Missing <strong>Data</strong><br />
• Missing completely at random<br />
(MCAR)<br />
• Missing at random (MAR)<br />
• Ignorable<br />
• Nonignorable<br />
<strong>Survey</strong> <strong>Research</strong> Labora<strong>to</strong>ry<br />
4
Missing completely at random<br />
• Being missing is independent from<br />
any variables.<br />
• Cases with complete data are<br />
indistinguishable from cases with<br />
missing data.<br />
• Missing cases are a random subsample<br />
of original sample.<br />
<strong>Survey</strong> <strong>Research</strong> Labora<strong>to</strong>ry<br />
Missing at random (MR)<br />
• The probability of a variable being<br />
observed is independent of the true<br />
value of that variable controlling for<br />
one or more variables.<br />
• Example: Probability of missing<br />
income is unrelated <strong>to</strong> income within<br />
levels of education.<br />
<strong>Survey</strong> <strong>Research</strong> Labora<strong>to</strong>ry<br />
Ignorable missing data<br />
• The data are MAR.<br />
• The missing data mechanism is<br />
unrelated <strong>to</strong> the parameters we want<br />
<strong>to</strong> estimate.<br />
<strong>Survey</strong> <strong>Research</strong> Labora<strong>to</strong>ry<br />
5
Nonignorable missing data<br />
• The pattern of data missingness is<br />
non-MAR.<br />
<strong>Survey</strong> <strong>Research</strong> Labora<strong>to</strong>ry<br />
Methods of Handling Missing <strong>Data</strong><br />
• Listwise (casewise) deletion: uses only<br />
complete cases<br />
• Pairwise deletion: uses all available cases<br />
• Dummy Variable Adjustment: Missing<br />
value indica<strong>to</strong>r method<br />
• Mean Substitution: substitute mean value<br />
computed from available cases (cf.<br />
unconditional or conditional)<br />
<strong>Survey</strong> <strong>Research</strong> Labora<strong>to</strong>ry<br />
Methods of Handling Missing <strong>Data</strong><br />
• Regression methods: predict value<br />
based on regression equation with<br />
other variables as predic<strong>to</strong>rs<br />
• Hot deck: identify the most similar<br />
case <strong>to</strong> the case with a missing and<br />
impute the value<br />
<strong>Survey</strong> <strong>Research</strong> Labora<strong>to</strong>ry<br />
6
Methods of Handling Missing <strong>Data</strong><br />
• Maximum likelihood methods: use all<br />
available data <strong>to</strong> generate maximum<br />
likelihood-based statistics.<br />
<strong>Survey</strong> <strong>Research</strong> Labora<strong>to</strong>ry<br />
Methods of Handling Missing <strong>Data</strong><br />
• Multiple imputation: combines the<br />
methods of ML <strong>to</strong> produce multiple<br />
data sets with imputed values for<br />
missing cases<br />
<strong>Survey</strong> <strong>Research</strong> Labora<strong>to</strong>ry<br />
Types of <strong>Survey</strong> Sample Designs<br />
• Simple Random Sampling<br />
• Systematic Sampling<br />
• Complex sample designs<br />
• stratified designs<br />
• cluster designs<br />
• mixed mode designs<br />
<strong>Survey</strong> <strong>Research</strong> Labora<strong>to</strong>ry<br />
7
Why complex sample designs?<br />
• Increased efficiency<br />
• Decreased costs<br />
<strong>Survey</strong> <strong>Research</strong> Labora<strong>to</strong>ry<br />
Why complex sample designs?<br />
• Statistical software packages with an<br />
assumption of SRS underestimate<br />
the sampling variance.<br />
• Not accounting for the impact of<br />
complex sample design can lead <strong>to</strong> a<br />
biased estimate of the sampling<br />
variance (Type I error).<br />
<strong>Survey</strong> <strong>Research</strong> Labora<strong>to</strong>ry<br />
Sample Weights<br />
• Used <strong>to</strong> adjust for differing<br />
probabilities of selection.<br />
• In theory, simple random samples<br />
are self-weighted.<br />
• In practice, simple random samples<br />
are likely <strong>to</strong> also require adjustments<br />
for non-response.<br />
<strong>Survey</strong> <strong>Research</strong> Labora<strong>to</strong>ry<br />
8
Types of Sample Weights<br />
• Poststratification weights: designed <strong>to</strong><br />
bring the sample proportions in<br />
demographic subgroups in<strong>to</strong> agreement<br />
with the population proportion in the<br />
subgroups.<br />
• Non-response weights: designed <strong>to</strong> inflate<br />
the weights of survey respondents <strong>to</strong><br />
compensate for nonrespondents with<br />
similar characteristics.<br />
• “Blow-up” (expansion) weights: provide<br />
estimates for the <strong>to</strong>tal population of<br />
interest.<br />
<strong>Survey</strong> <strong>Research</strong> Labora<strong>to</strong>ry<br />
Syntax Examples of Design-Based<br />
<strong>Analysis</strong> in STATA, SUDAAN and SAS<br />
STATA<br />
svyset strata strata<br />
svyset psu psu<br />
svyset pweight finalwt<br />
svyreg fatitk age male black hispanic<br />
SUDAAN<br />
proc regress data=”c:\nhanes.sav” filetype=spss desgn=wr;<br />
nest strata psu;<br />
weight finalwt<br />
subpgroup sex race;<br />
levels 2 3;<br />
model fatintk = age sex race;<br />
<strong>Survey</strong> <strong>Research</strong> Labora<strong>to</strong>ry<br />
Syntax Examples of Design-Based<br />
<strong>Analysis</strong> in STATA, SUDAAN and SAS<br />
SAS<br />
proc surveyreg data=nhanes;<br />
strata strata;<br />
cluster psu;<br />
class sex race;<br />
model fatintk = age sex race;<br />
weight finalwt<br />
<strong>Survey</strong> <strong>Research</strong> Labora<strong>to</strong>ry<br />
9
In Summary,<br />
when analyzing survey data . . .<br />
• Understand & evaluate survey design<br />
Screen the data – deal with missing<br />
data & outliers.<br />
• If necessary, adjust for study design<br />
using weights and appropriate<br />
computer software.<br />
<strong>Survey</strong> <strong>Research</strong> Labora<strong>to</strong>ry<br />
Thank You!<br />
www.srl.uic.edu<br />
<strong>Survey</strong> <strong>Research</strong> Labora<strong>to</strong>ry<br />
10