1 JANUARY - 31 DECEMBER 2004 - Minoan Lines
1 JANUARY - 31 DECEMBER 2004 - Minoan Lines
1 JANUARY - 31 DECEMBER 2004 - Minoan Lines

Create successful ePaper yourself
Turn your PDF publications into a flip-book with our unique Google optimized e-Paper software.
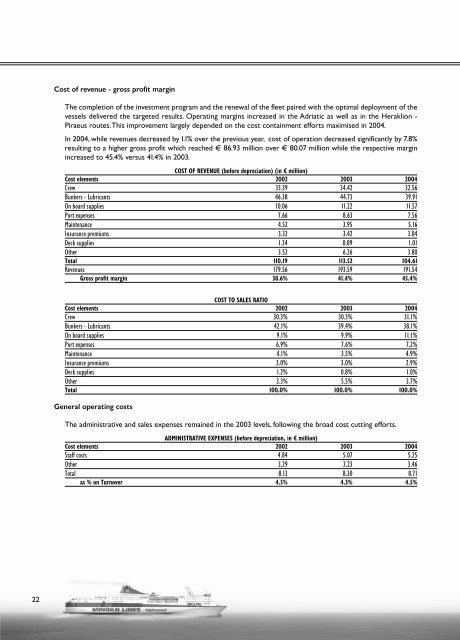
Cost of revenue - gross profit margin<br />
The completion of the investment program and the renewal of the fleet paired with the optimal deployment of the<br />
vessels delivered the targeted results. Operating margins increased in the Adriatic as well as in the Heraklion -<br />
Piraeus routes.This improvement largely depended on the cost containment efforts maximised in <strong>2004</strong>.<br />
In <strong>2004</strong>, while revenues decreased by 1.1% over the previous year, cost of operation decreased significantly by 7.8%<br />
resulting to a higher gross profit which reached € 86.93 million over € 80.07 million while the respective margin<br />
increased to 45.4% versus 41.4% in 2003.<br />
COST OF REVENUE (before depreciation) (in ú million)<br />
Cost elements 2002 2003 <strong>2004</strong><br />
Crew 33.39 34.42 32.56<br />
Bunkers - Lubricants 46.38 44.73 39.91<br />
On board supplies 10.06 11.22 11.57<br />
Port expenses 7.66 8.63 7.56<br />
Maintenance 4.52 3.95 5.16<br />
Insurance premiums 3.32 3.42 3.04<br />
Deck supplies 1.34 0.89 1.01<br />
Other 3.52 6.26 3.80<br />
Total 110.19 113.52 104.61<br />
Revenues 179.56 193.59 191.54<br />
Gross profit margin 38.6% 41.4% 45.4%<br />
COST TO SALES RATIO<br />
Cost elements 2002 2003 <strong>2004</strong><br />
Crew 30.3% 30.3% <strong>31</strong>.1%<br />
Bunkers - Lubricants 42.1% 39.4% 38.1%<br />
On board supplies 9.1% 9.9% 11.1%<br />
Port expenses 6.9% 7.6% 7.2%<br />
Maintenance 4.1% 3.5% 4.9%<br />
Insurance premiums 3.0% 3.0% 2.9%<br />
Deck supplies 1.2% 0.8% 1.0%<br />
Other 3.3% 5.5% 3.7%<br />
Total 100.0% 100.0% 100.0%<br />
General operating costs<br />
The administrative and sales expenses remained in the 2003 levels, following the broad cost cutting efforts.<br />
ADMINISTRATIVE EXPENSES (before depreciation, in ú million)<br />
Cost elements 2002 2003 <strong>2004</strong><br />
Staff costs 4.84 5.07 5.25<br />
Other 3.29 3.23 3.46<br />
Total 8.13 8.30 8.71<br />
as % on Turnover 4.5% 4.3% 4.5%<br />
22