1 JANUARY - 31 DECEMBER 2004 - Minoan Lines
1 JANUARY - 31 DECEMBER 2004 - Minoan Lines
1 JANUARY - 31 DECEMBER 2004 - Minoan Lines

Create successful ePaper yourself
Turn your PDF publications into a flip-book with our unique Google optimized e-Paper software.
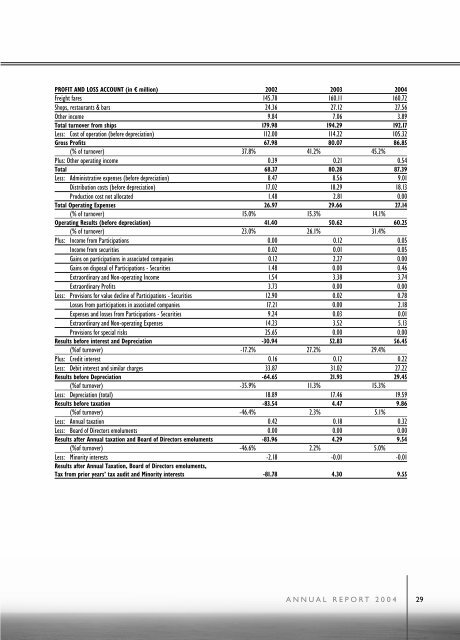
PROFIT AND LOSS ACCOUNT (in ú million) 2002 2003 <strong>2004</strong><br />
Freight fares 145.78 160.11 160.72<br />
Shops, restaurants & bars 24.36 27.12 27.56<br />
Other income 9.84 7.06 3.89<br />
Total turnover from ships 179.98 194.29 192.17<br />
Less: Cost of operation (before depreciation) 112.00 114.22 105.32<br />
Gross Profits 67.98 80.07 86.85<br />
(% of turnover) 37.8% 41.2% 45.2%<br />
Plus: Other operating income 0.39 0.21 0.54<br />
Total 68.37 80.28 87.39<br />
Less: Administrative expenses (before depreciation) 8.47 8.56 9.01<br />
Distribution costs (before depreciation) 17.02 18.29 18.13<br />
Production cost not allocated 1.48 2.81 0.00<br />
Total Operating Expenses 26.97 29.66 27.14<br />
(% of turnover) 15.0% 15.3% 14.1%<br />
Operating Results (before depreciation) 41.40 50.62 60.25<br />
(% of turnover) 23.0% 26.1% <strong>31</strong>.4%<br />
Plus: Income from Participations 0.00 0.12 0.05<br />
Income from securities 0.02 0.01 0.05<br />
Gains on participations in associated companies 0.12 2.27 0.00<br />
Gains on disposal of Participations - Securities 1.48 0.00 0.46<br />
Extraordinary and Non-operating Income 1.54 3.38 3.74<br />
Extraordinary Profits 3.73 0.00 0.00<br />
Less: Provisions for value decline of Participations - Securities 12.90 0.02 0.78<br />
Losses from participations in associated companies 17.21 0.00 2.18<br />
Expenses and losses from Participations - Securities 9.24 0.03 0.01<br />
Extraordinary and Non-operating Expenses 14.23 3.52 5.13<br />
Provisions for special risks 25.65 0.00 0.00<br />
Results before interest and Depreciation -30.94 52.83 56.45<br />
(%of turnover) -17.2% 27.2% 29.4%<br />
Plus: Credit interest 0.16 0.12 0.22<br />
Less: Debit interest and similar charges 33.87 <strong>31</strong>.02 27.22<br />
Results before Depreciation -64.6521.93 29.45<br />
(%of turnover) -35.9% 11.3% 15.3%<br />
Less: Depreciation (total) 18.89 17.46 19.59<br />
Results before taxation -83.54 4.47 9.86<br />
(%of turnover) -46.4% 2.3% 5.1%<br />
Less: Annual taxation 0.42 0.18 0.32<br />
Less: Board of Directors emoluments 0.00 0.00 0.00<br />
Results after Annual taxation and Board of Directors emoluments -83.96 4.29 9.54<br />
(%of turnover) -46.6% 2.2% 5.0%<br />
Less: Minority interests -2.18 -0.01 -0.01<br />
Results after Annual Taxation, Board of Directors emoluments,<br />
Tax from prior years’ tax audit and Minority interests -81.78 4.30 9.55<br />
ANNUAL REPORT <strong>2004</strong> 29