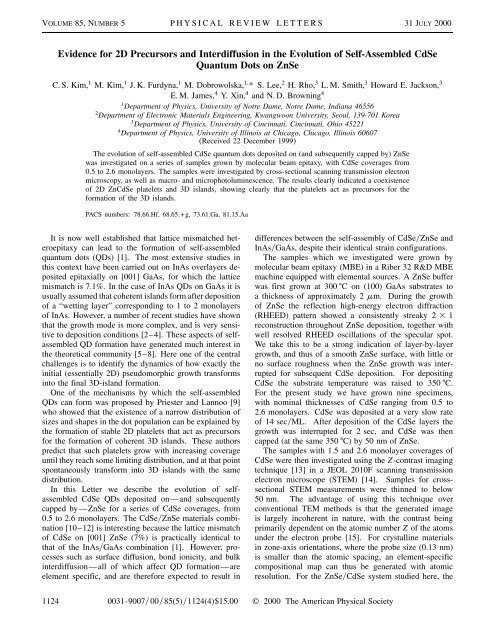
Evidence for 2D Precursors and Interdiffusion in the Evolution of Self ...
Evidence for 2D Precursors and Interdiffusion in the Evolution of Self ...
Evidence for 2D Precursors and Interdiffusion in the Evolution of Self ...

You also want an ePaper? Increase the reach of your titles
YUMPU automatically turns print PDFs into web optimized ePapers that Google loves.
VOLUME 85, NUMBER 5 PHYSICAL REVIEW LETTERS 31JULY 2000<br />
<strong>Evidence</strong> <strong>for</strong> <strong>2D</strong> <strong>Precursors</strong> <strong>and</strong> <strong>Interdiffusion</strong> <strong>in</strong> <strong>the</strong> <strong>Evolution</strong> <strong>of</strong> <strong>Self</strong>-Assembled CdSe<br />
Quantum Dots on ZnSe<br />
C. S. Kim, 1 M. Kim, 1 J. K. Furdyna, 1 M. Dobrowolska, 1, * S. Lee, 2 H. Rho, 3 L. M. Smith, 3 Howard E. Jackson, 3<br />
E. M. James, 4 Y. X<strong>in</strong>, 4 <strong>and</strong> N. D. Brown<strong>in</strong>g 4<br />
1 Department <strong>of</strong> Physics, University <strong>of</strong> Notre Dame, Notre Dame, Indiana 46556<br />
2 Department <strong>of</strong> Electronic Materials Eng<strong>in</strong>eer<strong>in</strong>g, Kwangwoon University, Seoul, 139-701 Korea<br />
3 Department <strong>of</strong> Physics, University <strong>of</strong> C<strong>in</strong>c<strong>in</strong>nati, C<strong>in</strong>c<strong>in</strong>nati, Ohio 45221<br />
4 Department <strong>of</strong> Physics, University <strong>of</strong> Ill<strong>in</strong>ois at Chicago, Chicago, Ill<strong>in</strong>ois 60607<br />
(Received 22 December 1999)<br />
The evolution <strong>of</strong> self-assembled CdSe quantum dots deposited on (<strong>and</strong> subsequently capped by) ZnSe<br />
was <strong>in</strong>vestigated on a series <strong>of</strong> samples grown by molecular beam epitaxy, with CdSe coverages from<br />
0.5 to 2.6 monolayers. The samples were <strong>in</strong>vestigated by cross-sectional scann<strong>in</strong>g transmission electron<br />
microscopy, as well as macro- <strong>and</strong> microphotolum<strong>in</strong>escence. The results clearly <strong>in</strong>dicated a coexistence<br />
<strong>of</strong> <strong>2D</strong> ZnCdSe platelets <strong>and</strong> 3D isl<strong>and</strong>s, show<strong>in</strong>g clearly that <strong>the</strong> platelets act as precursors <strong>for</strong> <strong>the</strong><br />
<strong>for</strong>mation <strong>of</strong> <strong>the</strong> 3D isl<strong>and</strong>s.<br />
PACS numbers: 78.66.Hf, 68.65.+g, 73.61.Ga, 81.15.Aa<br />
It is now well established that lattice mismatched heteroepitaxy<br />
can lead to <strong>the</strong> <strong>for</strong>mation <strong>of</strong> self-assembled<br />
quantum dots (QDs) [1]. The most extensive studies <strong>in</strong><br />
this context have been carried out on InAs overlayers deposited<br />
epitaxially on [001] GaAs, <strong>for</strong> which <strong>the</strong> lattice<br />
mismatch is 7.1%. In <strong>the</strong> case <strong>of</strong> InAs QDs on GaAs it is<br />
usually assumed that coherent isl<strong>and</strong>s <strong>for</strong>m after deposition<br />
<strong>of</strong> a “wett<strong>in</strong>g layer” correspond<strong>in</strong>g to 1 to 2 monolayers<br />
<strong>of</strong> InAs. However, a number <strong>of</strong> recent studies have shown<br />
that <strong>the</strong> growth mode is more complex, <strong>and</strong> is very sensitive<br />
to deposition conditions [2–4]. These aspects <strong>of</strong> selfassembled<br />
QD <strong>for</strong>mation have generated much <strong>in</strong>terest <strong>in</strong><br />
<strong>the</strong> <strong>the</strong>oretical community [5–8]. Here one <strong>of</strong> <strong>the</strong> central<br />
challenges is to identify <strong>the</strong> dynamics <strong>of</strong> how exactly <strong>the</strong><br />
<strong>in</strong>itial (essentially <strong>2D</strong>) pseudomorphic growth trans<strong>for</strong>ms<br />
<strong>in</strong>to <strong>the</strong> f<strong>in</strong>al 3D-isl<strong>and</strong> <strong>for</strong>mation.<br />
One <strong>of</strong> <strong>the</strong> mechanisms by which <strong>the</strong> self-assembled<br />
QDs can <strong>for</strong>m was proposed by Priester <strong>and</strong> Lannoo [9]<br />
who showed that <strong>the</strong> existence <strong>of</strong> a narrow distribution <strong>of</strong><br />
sizes <strong>and</strong> shapes <strong>in</strong> <strong>the</strong> dot population can be expla<strong>in</strong>ed by<br />
<strong>the</strong> <strong>for</strong>mation <strong>of</strong> stable <strong>2D</strong> platelets that act as precursors<br />
<strong>for</strong> <strong>the</strong> <strong>for</strong>mation <strong>of</strong> coherent 3D isl<strong>and</strong>s. These authors<br />
predict that such platelets grow with <strong>in</strong>creas<strong>in</strong>g coverage<br />
until <strong>the</strong>y reach some limit<strong>in</strong>g distribution, <strong>and</strong> at that po<strong>in</strong>t<br />
spontaneously trans<strong>for</strong>m <strong>in</strong>to 3D isl<strong>and</strong>s with <strong>the</strong> same<br />
distribution.<br />
In this Letter we describe <strong>the</strong> evolution <strong>of</strong> selfassembled<br />
CdSe QDs deposited on—<strong>and</strong> subsequently<br />
capped by—ZnSe <strong>for</strong> a series <strong>of</strong> CdSe coverages, from<br />
0.5 to 2.6 monolayers. The CdSeZnSe materials comb<strong>in</strong>ation<br />
[10–12] is <strong>in</strong>terest<strong>in</strong>g because <strong>the</strong> lattice mismatch<br />
<strong>of</strong> CdSe on [001] ZnSe (7%) is practically identical to<br />
that <strong>of</strong> <strong>the</strong> InAsGaAs comb<strong>in</strong>ation [1]. However, processes<br />
such as surface diffusion, bond ionicity, <strong>and</strong> bulk<br />
<strong>in</strong>terdiffusion—all <strong>of</strong> which affect QD <strong>for</strong>mation—are<br />
element specific, <strong>and</strong> are <strong>the</strong>re<strong>for</strong>e expected to result <strong>in</strong><br />
differences between <strong>the</strong> self-assembly <strong>of</strong> CdSeZnSe <strong>and</strong><br />
InAsGaAs, despite <strong>the</strong>ir identical stra<strong>in</strong> configurations.<br />
The samples which we <strong>in</strong>vestigated were grown by<br />
molecular beam epitaxy (MBE) <strong>in</strong> a Riber 32 R&D MBE<br />
mach<strong>in</strong>e equipped with elemental sources. A ZnSe buffer<br />
was first grown at 300 ± C on (100) GaAs substrates to<br />
a thickness <strong>of</strong> approximately 2 mm. Dur<strong>in</strong>g <strong>the</strong> growth<br />
<strong>of</strong> ZnSe <strong>the</strong> reflection high-energy electron diffraction<br />
(RHEED) pattern showed a consistently streaky 2 3 1<br />
reconstruction throughout ZnSe deposition, toge<strong>the</strong>r with<br />
well resolved RHEED oscillations <strong>of</strong> <strong>the</strong> specular spot.<br />
We take this to be a strong <strong>in</strong>dication <strong>of</strong> layer-by-layer<br />
growth, <strong>and</strong> thus <strong>of</strong> a smooth ZnSe surface, with little or<br />
no surface roughness when <strong>the</strong> ZnSe growth was <strong>in</strong>terrupted<br />
<strong>for</strong> subsequent CdSe deposition. For deposit<strong>in</strong>g<br />
CdSe <strong>the</strong> substrate temperature was raised to 350 ± C.<br />
For <strong>the</strong> present study we have grown n<strong>in</strong>e specimens,<br />
with nom<strong>in</strong>al thicknesses <strong>of</strong> CdSe rang<strong>in</strong>g from 0.5 to<br />
2.6 monolayers. CdSe was deposited at a very slow rate<br />
<strong>of</strong> 14 secML. After deposition <strong>of</strong> <strong>the</strong> CdSe layers <strong>the</strong><br />
growth was <strong>in</strong>terrupted <strong>for</strong> 2 sec, <strong>and</strong> CdSe was <strong>the</strong>n<br />
capped (at <strong>the</strong> same 350 ± C) by 50 nm <strong>of</strong> ZnSe.<br />
The samples with 1.5 <strong>and</strong> 2.6 monolayer coverages <strong>of</strong><br />
CdSe were <strong>the</strong>n <strong>in</strong>vestigated us<strong>in</strong>g <strong>the</strong> Z-contrast imag<strong>in</strong>g<br />
technique [13] <strong>in</strong> a JEOL 2010F scann<strong>in</strong>g transmission<br />
electron microscope (STEM) [14]. Samples <strong>for</strong> crosssectional<br />
STEM measurements were th<strong>in</strong>ned to below<br />
50 nm. The advantage <strong>of</strong> us<strong>in</strong>g this technique over<br />
conventional TEM methods is that <strong>the</strong> generated image<br />
is largely <strong>in</strong>coherent <strong>in</strong> nature, with <strong>the</strong> contrast be<strong>in</strong>g<br />
primarily dependent on <strong>the</strong> atomic number Z <strong>of</strong> <strong>the</strong> atoms<br />
under <strong>the</strong> electron probe [15]. For crystall<strong>in</strong>e materials<br />
<strong>in</strong> zone-axis orientations, where <strong>the</strong> probe size (0.13 nm)<br />
is smaller than <strong>the</strong> atomic spac<strong>in</strong>g, an element-specific<br />
compositional map can thus be generated with atomic<br />
resolution. For <strong>the</strong> ZnSeCdSe system studied here, <strong>the</strong><br />
1124 0031-90070085(5)1124(4)$15.00 © 2000 The American Physical Society
VOLUME 85, NUMBER 5 PHYSICAL REVIEW LETTERS 31JULY 2000<br />
0.13 nm size <strong>of</strong> <strong>the</strong> microprobe means that <strong>the</strong> 0.14 to<br />
0.16 nm spac<strong>in</strong>gs along <strong>the</strong> [110] direction are readily<br />
resolved, <strong>and</strong> <strong>the</strong> spatial map <strong>of</strong> <strong>the</strong> Cd-conta<strong>in</strong><strong>in</strong>g layer<br />
can be directly imaged.<br />
Figure 1(a) shows a high resolution cross-sectional Z-<br />
contrast image <strong>of</strong> <strong>the</strong> sample with 1.5 monolayer coverage<br />
<strong>of</strong> CdSe. As seen from <strong>the</strong> contrast (color) variations <strong>in</strong><br />
<strong>the</strong> image, <strong>the</strong> CdSe-conta<strong>in</strong><strong>in</strong>g layer is not uni<strong>for</strong>m even<br />
at this low coverage, areas with high Cd concentration<br />
(redyellow spots) be<strong>in</strong>g separated by “flat” regions with<br />
lower Cd content. Note that <strong>the</strong>re is very little distortion<br />
<strong>of</strong> <strong>the</strong> lattice fr<strong>in</strong>ges <strong>in</strong> <strong>the</strong> region <strong>of</strong> <strong>the</strong> CdSe layer. This<br />
suggests that even <strong>the</strong> areas <strong>of</strong> higher Cd concentration are<br />
composed <strong>of</strong> CdZnSe ra<strong>the</strong>r than pure CdSe (i.e., <strong>the</strong>re is a<br />
reduction <strong>in</strong> <strong>the</strong> lattice mismatch between <strong>the</strong> isl<strong>and</strong>s <strong>and</strong><br />
<strong>the</strong>ir environment). The isl<strong>and</strong>s <strong>the</strong>mselves vary <strong>in</strong> size<br />
both laterally <strong>and</strong> <strong>in</strong> <strong>the</strong> growth (up) direction; <strong>and</strong> we can<br />
clearly see <strong>the</strong> coexistence <strong>of</strong> both 3D <strong>and</strong> <strong>2D</strong> isl<strong>and</strong>s. In<br />
particular, <strong>the</strong>re are Cd-rich regions with large width-toheight<br />
ratios, which can be regarded as <strong>2D</strong> platelets. We<br />
also notice <strong>the</strong> existence <strong>of</strong> one 3D isl<strong>and</strong> [on <strong>the</strong> left <strong>in</strong><br />
Fig. 1(a)] with a diameter <strong>of</strong> about 8 nm <strong>and</strong> height <strong>of</strong><br />
about 5 nm, which can be identified as a quantum dot.<br />
One can also notice ano<strong>the</strong>r dot (second from <strong>the</strong> right)<br />
which is just <strong>in</strong> <strong>the</strong> process <strong>of</strong> exp<strong>and</strong><strong>in</strong>g from a <strong>2D</strong> platelet<br />
along <strong>the</strong> vertical direction. To our knowledge this is <strong>the</strong><br />
first image which captures <strong>the</strong> onset <strong>of</strong> QD <strong>for</strong>mation <strong>in</strong><br />
<strong>the</strong> case <strong>of</strong> CdSeZnSe, clearly show<strong>in</strong>g that <strong>the</strong> <strong>2D</strong> isl<strong>and</strong><br />
acts as a precursor to <strong>the</strong> <strong>for</strong>mation <strong>of</strong> a 3D isl<strong>and</strong>.<br />
Ano<strong>the</strong>r important feature revealed by Fig. 1(a) is that<br />
<strong>the</strong> dots extend to <strong>the</strong> same degree above <strong>and</strong> below <strong>the</strong> <strong>in</strong>terface.<br />
This is seen both <strong>for</strong> <strong>the</strong> fully developed dot (first<br />
on <strong>the</strong> left), <strong>and</strong> <strong>for</strong> <strong>the</strong> one <strong>in</strong> <strong>the</strong> process <strong>of</strong> <strong>for</strong>m<strong>in</strong>g,<br />
where it clearly starts to exp<strong>and</strong> <strong>in</strong> both “up” <strong>and</strong> “down”<br />
directions. This is direct graphic evidence that <strong>in</strong>terdif-<br />
FIG. 1 (color). Cross-sectional high resolution Z-contrast images<br />
<strong>of</strong> samples with (a) 1.5 <strong>and</strong> (b) 2.6 monolayers <strong>of</strong> CdSe<br />
deposited on ZnSe, <strong>and</strong> capped. The pictures were digitally<br />
color-coded based on <strong>the</strong> contrast <strong>in</strong><strong>for</strong>mation <strong>in</strong> <strong>the</strong> STEM images:<br />
red corresponds to regions richest <strong>in</strong> Cd, blue to those<br />
richest <strong>in</strong> Zn. The growth direction is vertically “up.”<br />
fusion plays an important role <strong>in</strong> <strong>the</strong> dynamics <strong>of</strong> quantum<br />
dot <strong>for</strong>mation. Here it is important to remember that,<br />
<strong>for</strong> <strong>the</strong> experimental conditions used <strong>in</strong> <strong>the</strong> STEM measurement<br />
[14], <strong>the</strong> contrast <strong>in</strong> <strong>the</strong> image is dom<strong>in</strong>ated by<br />
chemical composition (i.e., by <strong>the</strong> atomic number, Z); thus,<br />
although <strong>the</strong> detector geometry cannot totally remove <strong>the</strong><br />
residual coherent effects caused by stra<strong>in</strong> at <strong>the</strong> <strong>in</strong>terface<br />
[16], <strong>the</strong> images are primarily a map <strong>of</strong> <strong>the</strong> Cd distribution.<br />
Figure 1(b) shows a high resolution cross-sectional Z-<br />
contrast image <strong>for</strong> CdSe coverage <strong>of</strong> 2.6 monolayers. Here<br />
<strong>the</strong> image shows well <strong>for</strong>med 3D isl<strong>and</strong>s approximately 6<br />
to 8 nm <strong>in</strong> diameter, extend<strong>in</strong>g up <strong>and</strong> down <strong>in</strong> <strong>the</strong> vertical<br />
(growth) direction. The fact that <strong>the</strong> STEM distortion<br />
<strong>of</strong> <strong>the</strong> lattice fr<strong>in</strong>ges <strong>in</strong> <strong>the</strong> region <strong>of</strong> <strong>the</strong> dots is now more<br />
pronounced suggests that <strong>the</strong> lattice mismatch is greater,<br />
<strong>and</strong> that at this coverage <strong>the</strong> dots (although still composed<br />
<strong>of</strong> CdZnSe) are now richer <strong>in</strong> Cd than <strong>in</strong> <strong>the</strong> case <strong>of</strong><br />
1.5 monolayer CdSe coverage.<br />
Our STEM data are consistent with cross-sectional<br />
transmission electron microscopy (TEM) measurements<br />
per<strong>for</strong>med on samples with 1.0 <strong>and</strong> 0.7 monolayer coverage<br />
<strong>of</strong> CdSe by o<strong>the</strong>r groups [11,17,18]. In those studies,<br />
as <strong>in</strong> ours, <strong>the</strong> pictures do not show a uni<strong>for</strong>m wett<strong>in</strong>g<br />
layer, but also reveal fluctuations <strong>of</strong> composition <strong>in</strong> <strong>the</strong><br />
<strong>for</strong>m <strong>of</strong> <strong>2D</strong> isl<strong>and</strong>s with large width-to-height ratios.<br />
These results show that <strong>2D</strong> ZnCdSe platelets <strong>for</strong>m as soon<br />
as CdSe deposition beg<strong>in</strong>s (i.e., without <strong>for</strong>m<strong>in</strong>g a “true”<br />
wett<strong>in</strong>g layer), <strong>and</strong>, as <strong>the</strong> deposition <strong>of</strong> Cd cont<strong>in</strong>ues,<br />
<strong>the</strong> platelets grow at first laterally, <strong>and</strong> eventually (at <strong>the</strong><br />
coverage <strong>of</strong> ca. 1.5 ML) vertically.<br />
Macro- <strong>and</strong> microphotolum<strong>in</strong>escence measurements on<br />
<strong>the</strong>se samples also corroborate <strong>the</strong> <strong>in</strong>trigu<strong>in</strong>g transition<br />
from <strong>2D</strong> to 3D growth regimes seen <strong>in</strong> <strong>the</strong> STEM studies<br />
described above. Figure 2 shows microphotolum<strong>in</strong>escence<br />
spectra observed on five samples with different CdSe coverages,<br />
as <strong>in</strong>dicated. One can see a clear progression <strong>of</strong><br />
<strong>the</strong> spectrum toward lower energy as <strong>the</strong> CdSe coverage<br />
<strong>in</strong>creases from 0.5 to 2.6 monolayers. Superimposed on<br />
<strong>the</strong> broad lum<strong>in</strong>escence we observe sharp l<strong>in</strong>es with typical<br />
widths <strong>of</strong> 200 meV. Although <strong>the</strong> number <strong>of</strong> <strong>the</strong>se<br />
sharp spikes decreases with decreas<strong>in</strong>g CdSe coverage, it<br />
is important to note that <strong>the</strong> sharp l<strong>in</strong>es are seen on all<br />
samples, <strong>in</strong>clud<strong>in</strong>g <strong>the</strong> one with CdSe coverage <strong>of</strong> only<br />
0.5 monolayers.<br />
In Fig. 2(b) we exam<strong>in</strong>e more closely <strong>the</strong> photolum<strong>in</strong>escence<br />
spectrum from <strong>the</strong> sample with 0.5 monolayers coverage<br />
(note <strong>the</strong> exp<strong>and</strong>ed scale). The emission as a whole<br />
exhibits a narrow 5 meV wide l<strong>in</strong>e shape hav<strong>in</strong>g a weak<br />
low-energy tail, with a small number <strong>of</strong> narrow spikes superimposed<br />
on <strong>the</strong> tail. The tail itself arises from potential<br />
variations result<strong>in</strong>g from <strong>the</strong> fluctuation <strong>of</strong> CdSe concentration<br />
<strong>in</strong> <strong>the</strong> layer plane [19–21]. The spikes seen on<br />
<strong>the</strong> tail <strong>in</strong> <strong>the</strong> microphotolum<strong>in</strong>escence data <strong>for</strong> <strong>the</strong> sample<br />
with CdSe coverage <strong>of</strong> 0.5 monolayers thus correspond to<br />
<strong>in</strong>dividual potential fluctuations. When we proceed to <strong>the</strong><br />
1125
VOLUME 85, NUMBER 5 PHYSICAL REVIEW LETTERS 31JULY 2000<br />
PL <strong>in</strong>tensity (arb. units)<br />
Energy (eV)<br />
2.2 2.3 2.4 2.5 2.6 2.7 2.8<br />
(a)<br />
(b)<br />
2.6 ML 1.9 ML 1.5 ML 1.0 ML 0.5 ML<br />
L<strong>in</strong>e A<br />
L<strong>in</strong>e B<br />
1.0 ML 0.5 ML<br />
PL <strong>in</strong>tensity (arb. units)<br />
0.7 ML<br />
12 K<br />
30 K<br />
40 K<br />
1.5 ML<br />
L<strong>in</strong>e B L<strong>in</strong>e A<br />
15 K<br />
50 K<br />
110 K<br />
50 K<br />
140 K<br />
2.65 2.70 2.75<br />
Energy (eV)<br />
2.80<br />
FIG. 2. (a) Microphotolum<strong>in</strong>escence spectra taken at 6 K on<br />
capped CdSeZnSe QD samples with different CdSe coverages<br />
(solid curves), toge<strong>the</strong>r with best-fit simulations (dotted curves).<br />
(b) Microphotolum<strong>in</strong>escence spectra <strong>for</strong> samples with 0.5 <strong>and</strong><br />
1.0 monolayer coverage, plotted on an exp<strong>and</strong>ed energy scale.<br />
spectrum observed <strong>for</strong> 1 monolayer coverage, <strong>the</strong> emission<br />
l<strong>in</strong>e is qualitatively similar. However, <strong>the</strong> width <strong>of</strong> <strong>the</strong> lowenergy<br />
tail is now significantly greater, as is <strong>the</strong> number <strong>of</strong><br />
spikes, <strong>in</strong>dicat<strong>in</strong>g an <strong>in</strong>creas<strong>in</strong>g number <strong>of</strong> compositional<br />
fluctuations <strong>in</strong> <strong>the</strong> x-y plane as CdSe coverage <strong>in</strong>creases.<br />
Although <strong>the</strong> spectrum <strong>for</strong> 1.5 monolayer coverage at<br />
first sight does not look much different, temperature studies<br />
<strong>of</strong> its macrophotolum<strong>in</strong>escence reveal a significant difference<br />
<strong>in</strong> <strong>the</strong> behavior observed <strong>for</strong> samples with <strong>the</strong><br />
higher CdSe coverages. This difference is illustrated <strong>in</strong><br />
Fig. 3, which shows photolum<strong>in</strong>escence spectra obta<strong>in</strong>ed<br />
<strong>for</strong> samples with 0.7 <strong>and</strong> 1.5 monolayer coverage at several<br />
temperatures. For 0.7 monolayer coverage <strong>the</strong> lowenergy<br />
tail disappears quickly with <strong>in</strong>creas<strong>in</strong>g temperature<br />
due to <strong>the</strong>rmalization <strong>of</strong> states localized on <strong>the</strong> weak fluctuations<br />
with<strong>in</strong> <strong>the</strong> <strong>2D</strong> platelets. Similar behavior is also<br />
observed <strong>for</strong> all samples with coverages up to 1 monolayer.<br />
For samples with coverages <strong>of</strong> 1.5 monolayers <strong>and</strong> higher,<br />
however, <strong>the</strong> temperature dependence <strong>of</strong> <strong>the</strong> emission spectrum<br />
suggests <strong>the</strong> emergence <strong>of</strong> a new mechanism. The<br />
right column <strong>of</strong> Fig. 3 clearly <strong>in</strong>dicates that <strong>the</strong> photolum<strong>in</strong>escence<br />
spectrum observed <strong>for</strong> <strong>the</strong>se higher coverages is<br />
composed <strong>of</strong> two dist<strong>in</strong>ct l<strong>in</strong>es, each hav<strong>in</strong>g very different<br />
temperature characteristics. We observe that <strong>the</strong> <strong>in</strong>tensities<br />
<strong>of</strong> <strong>the</strong> two l<strong>in</strong>es compris<strong>in</strong>g <strong>the</strong> spectrum change ra<strong>the</strong>r dramatically<br />
with temperature relative to one ano<strong>the</strong>r. At <strong>the</strong><br />
lowest temperature <strong>the</strong> higher-energy l<strong>in</strong>e (which we will<br />
call l<strong>in</strong>e A) is clearly dom<strong>in</strong>ant relative to its low-energy<br />
partner (l<strong>in</strong>e B), while <strong>the</strong> opposite is true at high temperatures.<br />
This difference between l<strong>in</strong>es A <strong>and</strong> B suggests <strong>the</strong>ir<br />
different orig<strong>in</strong>s. Specifically, <strong>the</strong> survival <strong>of</strong> l<strong>in</strong>e B over<br />
2.72 2.74 2.76 2.4 2.5 2.6<br />
Energy (eV)<br />
FIG. 3. Macrophotolum<strong>in</strong>escence data taken on CdSeZnSe<br />
samples with 0.7 <strong>and</strong> 1.5 monolayer coverages at several<br />
temperatures.<br />
l<strong>in</strong>e A <strong>in</strong> <strong>the</strong> 1.5 monolayers sample suggests that l<strong>in</strong>e B<br />
is due to excitons conf<strong>in</strong>ed to QDs seen <strong>in</strong> Fig. 1. We thus<br />
suggest that l<strong>in</strong>e A, with its much faster temperature decay<br />
(a behavior typical <strong>for</strong> <strong>2D</strong>-conf<strong>in</strong>ed excitons, as compared<br />
to 0D excitons) corresponds to emission from <strong>the</strong> <strong>2D</strong><br />
platelets seen <strong>in</strong> <strong>the</strong> STEM image.<br />
To corroborate this hypo<strong>the</strong>sis, we modeled <strong>the</strong> lum<strong>in</strong>escence<br />
<strong>for</strong> 1.5, 1.9, <strong>and</strong> 2.6 monolayer coverages as a<br />
superposition <strong>of</strong> two Gaussian l<strong>in</strong>es, <strong>and</strong> followed <strong>the</strong> temperature<br />
dependence <strong>of</strong> <strong>the</strong>ir l<strong>in</strong>ewidth. Dotted curves <strong>in</strong><br />
Fig. 2 show a two-l<strong>in</strong>e fit to <strong>the</strong> data observed on <strong>the</strong> 1.5<br />
<strong>and</strong> 1.9 monolayer samples. The lum<strong>in</strong>escence observed<br />
on <strong>the</strong> sample with <strong>the</strong> highest CdSe coverage (2.6 ML) is<br />
symmetric, <strong>and</strong> can be modeled quite satisfactorily with a<br />
s<strong>in</strong>gle l<strong>in</strong>e. Figure 4 shows <strong>the</strong> FWHM <strong>of</strong> l<strong>in</strong>es A <strong>and</strong> B as<br />
a function <strong>of</strong> temperature <strong>for</strong> <strong>the</strong> sample with CdSe coverage<br />
<strong>of</strong> 1.9 monolayers. Aga<strong>in</strong>, we see <strong>the</strong> difference <strong>in</strong> <strong>the</strong><br />
behavior between <strong>the</strong> two l<strong>in</strong>es. The FWHM <strong>for</strong> <strong>the</strong> lowerenergy<br />
l<strong>in</strong>e (B) <strong>in</strong>itially shows significant narrow<strong>in</strong>g as <strong>the</strong><br />
temperature <strong>in</strong>creases <strong>in</strong> <strong>the</strong> region below 60 K. Such<br />
narrow<strong>in</strong>g has been observed <strong>in</strong> o<strong>the</strong>r QD systems, <strong>and</strong><br />
has been ascribed to a redistribution <strong>of</strong> carriers to lowerenergy<br />
QD states [21,22]. The higher-energy l<strong>in</strong>e (A) <strong>of</strong><br />
<strong>the</strong> 1.9 monolayer sample shows a behavior typical <strong>of</strong> <strong>the</strong><br />
emission <strong>of</strong> excitons conf<strong>in</strong>ed <strong>in</strong> a quantum well, where<br />
<strong>the</strong> FWHM <strong>in</strong>creases monotonically with temperature.<br />
Based on <strong>the</strong> above optical data we conclude that, <strong>for</strong><br />
CdSe coverages below 1.5 monolayer, only one type <strong>of</strong><br />
emission is observed, characteristic <strong>of</strong> a <strong>2D</strong> system. This<br />
emission is from <strong>the</strong> <strong>2D</strong> platelets clearly revealed <strong>in</strong> <strong>the</strong><br />
STEM images. For samples with 1.5 <strong>and</strong> 1.9 monolayer<br />
coverages, we simultaneously observe emissions from 3D<br />
quantum dots (l<strong>in</strong>e B) <strong>and</strong> from <strong>the</strong> <strong>2D</strong> platelets (l<strong>in</strong>e A),<br />
which aga<strong>in</strong> is consistent with <strong>the</strong> STEM image shown <strong>in</strong><br />
1126
VOLUME 85, NUMBER 5 PHYSICAL REVIEW LETTERS 31JULY 2000<br />
FWHM (meV)<br />
100<br />
80<br />
60<br />
40<br />
20<br />
L<strong>in</strong>e A<br />
L<strong>in</strong>e B<br />
0<br />
0 50 100 150 200<br />
Temperature (K)<br />
FIG. 4. Temperature dependence <strong>of</strong> full width at half maximum<br />
<strong>of</strong> l<strong>in</strong>e B (circles) <strong>and</strong> l<strong>in</strong>e A (squares) observed <strong>for</strong> <strong>the</strong><br />
sample with 1.9 monolayer coverage <strong>of</strong> CdSe.<br />
Fig. 1(a). The pronounced changes <strong>in</strong> <strong>the</strong> relative <strong>in</strong>tensities<br />
<strong>of</strong> l<strong>in</strong>es A <strong>and</strong> B as <strong>the</strong> coverage changes from 1.5 to<br />
1.9 monolayers <strong>in</strong>dicate a rapid <strong>in</strong>crease <strong>in</strong> <strong>the</strong> 3D dot density,<br />
at <strong>the</strong> expense <strong>of</strong> <strong>the</strong> <strong>2D</strong> platelets. The sample with<br />
2.6 monolayer coverage shows only one type <strong>of</strong> lum<strong>in</strong>escence,<br />
correspond<strong>in</strong>g to fully developed quantum dots.<br />
In conclusion, we have per<strong>for</strong>med both photolum<strong>in</strong>escence<br />
<strong>and</strong> STEM studies on a series <strong>of</strong> samples consist<strong>in</strong>g<br />
<strong>of</strong> CdSe layers <strong>of</strong> different thicknesses deposited on ZnSe,<br />
<strong>and</strong> subsequently capped. The STEM pictures give clear<br />
evidence that <strong>in</strong>terdiffusion plays an important role <strong>in</strong> <strong>the</strong><br />
process <strong>of</strong> quantum dot <strong>for</strong>mation. They also show that <strong>in</strong><br />
<strong>the</strong> early stages <strong>of</strong> <strong>the</strong> process one first observes <strong>the</strong> <strong>for</strong>mation<br />
<strong>of</strong> <strong>2D</strong> platelets, which act as precursors <strong>for</strong> <strong>the</strong> f<strong>in</strong>al<br />
3D dots. The optical data fully confirm <strong>the</strong> above STEM<br />
data. These results provide strong support <strong>for</strong> <strong>the</strong> model <strong>of</strong><br />
self-assembly proposed <strong>for</strong> quantum dots by Priester <strong>and</strong><br />
Lannoo [9], referred to at <strong>the</strong> outset <strong>of</strong> this paper.<br />
We thank A.-L. Barabási <strong>and</strong> J. C. Kim <strong>for</strong> helpful<br />
discussions. We acknowledge <strong>the</strong> support by <strong>the</strong> NSF<br />
(DMR-9705064, DMR-9705443, DMR-9601792, DMR-<br />
9733895, ECS-9412772) <strong>and</strong> ARO (DAAG55-97-1-0378).<br />
*Email address: mdobrowo@nd.edu<br />
[1] R. Notzel et al., Nature (London) 369, 131 (1994); D.<br />
Leonard et al., Appl. Phys. Lett. 63, 3203 (1993).<br />
[2] R. Heitz et al., Phys. Rev. Lett. 78, 4071 (1997).<br />
[3] P. B. Joyce et al., Phys. Rev. B 58, R15 981 (1998).<br />
[4] A. S. Bhatti et al., Phys. Rev. B 60, 2592 (1999).<br />
[5] V. A. Shchuk<strong>in</strong> et al., Phys. Rev. Lett. 75, 2968 (1995).<br />
[6] I. Daruka <strong>and</strong> A.-L. Barabasi, Phys. Rev. Lett. 79, 3708<br />
(1997).<br />
[7] F. M. Ross et al., Phys. Rev. Lett. 80, 984 (1998).<br />
[8] J. Ters<strong>of</strong>f <strong>and</strong> R. M. Tromp, Phys. Rev. Lett. 70, 2782<br />
(1993).<br />
[9] C. Priester <strong>and</strong> M. Lannoo, Phys. Rev. Lett. 75, 93 (1995).<br />
[10] S. H. X<strong>in</strong> et al., Appl. Phys. Lett. 69, 3884 (1996).<br />
[11] T. Kummell et al., Appl. Phys. Lett. 73, 3105 (1998).<br />
[12] F. Flack et al., Phys. Rev. B 54, R17 312 (1996).<br />
[13] S. J. Pennycook <strong>and</strong> L. A. Boatner, Nature (London) 336,<br />
565 (1998).<br />
[14] E. M. James <strong>and</strong> N. D. Brown<strong>in</strong>g, Ultramicroscopy 78, 125<br />
(1999).<br />
[15] D. E. Jesson <strong>and</strong> S. J. Pennycook, Proc. R. Soc. London A<br />
449, 273 (1995).<br />
[16] P. D. Nellist <strong>and</strong> S. J. Pennycook, Ultramicroscopy 78, 111<br />
(1999).<br />
[17] M. Strassburg et al., Appl. Phys. Lett. 72, 942 (1998).<br />
[18] I. L. Krestnikov et al., Phys. Rev. B 60, 8695 (1999).<br />
[19] D. Ouadjaout <strong>and</strong> Y. Marfa<strong>in</strong>g, Phys. Rev. B 41, 12 096<br />
(1990).<br />
[20] B. Gil et al., Phys. Rev. B 50, 18 231 (1994).<br />
[21] D. I. Lubyshev et al., Appl. Phys. Lett. 68, 205 (1996).<br />
[22] Z. Y. Xu et al., Phys. Rev. B 54, 11 528 (1996).<br />
1127