Wellington City Lake, Sumner County, KS - Kansas Water Office
Wellington City Lake, Sumner County, KS - Kansas Water Office
Wellington City Lake, Sumner County, KS - Kansas Water Office

You also want an ePaper? Increase the reach of your titles
YUMPU automatically turns print PDFs into web optimized ePapers that Google loves.
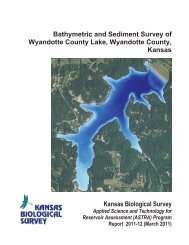
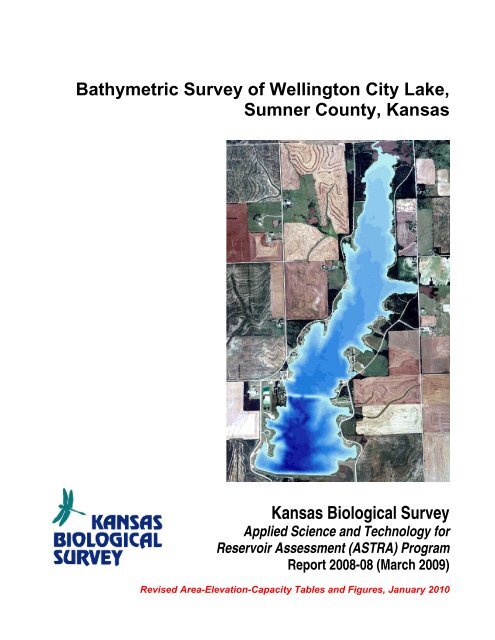
Bathymetric Survey of <strong>Wellington</strong> <strong>City</strong> <strong>Lake</strong>,<br />
<strong>Sumner</strong> <strong>County</strong>, <strong>Kansas</strong><br />
<strong>Kansas</strong> Biological Survey<br />
Applied Science and Technology for<br />
Reservoir Assessment (ASTRA) Program<br />
Report 2008-08 (March 2009)<br />
Revised Area-Elevation-Capacity Tables and Figures, January 2010
This work was funded by the <strong>Kansas</strong> <strong>Water</strong> <strong>Office</strong> through the State<br />
<strong>Water</strong> Plan Fund in support of the Reservoir Sustainability Initiative.
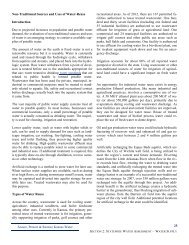
SUMMARY<br />
During November 2007, the <strong>Kansas</strong> Biological Survey (KBS) performed a bathymetric survey<br />
of <strong>Wellington</strong> <strong>City</strong> <strong>Lake</strong> in <strong>Sumner</strong> <strong>County</strong>, <strong>Kansas</strong>. The survey was carried out using<br />
acoustic echosounding apparatus linked to a global positioning system. Both Old <strong>Wellington</strong><br />
<strong>Lake</strong> and the contiguous New <strong>Wellington</strong> <strong>Lake</strong> were surveyed. Area-elevation-volume tables<br />
were constructed for the entire lake and separately for the older northern part of the lake and<br />
the newer southern part of the lake. No sediment sampling was performed on this lake.<br />
Summary Data:<br />
Bathymetric Survey:<br />
Date of survey: November 15, 2007<br />
<strong>Water</strong> elevation on date of survey: 1209.25<br />
Reservoir Statistics:<br />
Entire Impoundment<br />
Elevation on survey date<br />
1209.25 ft.<br />
Area on survey date (acres):<br />
615 a<br />
Volume on survey date (acre-feet):<br />
5958 a<br />
Maximum depth (feet): 26.3<br />
North Impoundment (Old <strong>Wellington</strong> <strong>City</strong> <strong>Lake</strong>)<br />
Year constructed: 1935<br />
Area on survey date (acres): 402<br />
Volume on survey date (acre-feet): 3032<br />
Maximum depth (feet): 14.9<br />
South Impoundment (New <strong>Wellington</strong> <strong>City</strong> <strong>Lake</strong>)<br />
Year constructed: 1993<br />
Area on survey date (acres): 212<br />
Volume on survey date (acre-feet): 2925<br />
Maximum depth (feet): 26.3<br />
a<br />
Total area and volume for the entire impoundment do not precisely equal the sums of area<br />
and volume of the north and south impoundment due to rounding.
TABLE OF CONTENTS<br />
SUMMARY.....................................................................................................................i<br />
TABLE OF CONTENTS................................................................................................ii<br />
LIST OF FIGURES.......................................................................................................iii<br />
LIST OF TABLES ........................................................................................................iv<br />
LAKE HISTORY AND PERTINENT INFORMATION .................................................. 1<br />
BATHYMETRIC SURVEYING PROCEDURE<br />
Pre-survey preparation:..................................................................................... 3<br />
Survey procedures: ........................................................................................... 3<br />
Establishment of lake level on survey date: ...................................................... 4<br />
Post-processing ................................................................................................ 6<br />
BATHYMETRIC SURVEY RESULTS<br />
Area-Volume-Elevation Tables.......................................................................... 9<br />
Entire Reservoir (North and South impoundments combined) ............... 9<br />
North Impoundment ONLY (Old <strong>Wellington</strong> <strong>City</strong> <strong>Lake</strong>) ........................ 12<br />
South Impoundment ONLY (New <strong>Wellington</strong> <strong>City</strong> <strong>Lake</strong>)...................... 15<br />
ii
LIST OF FIGURES<br />
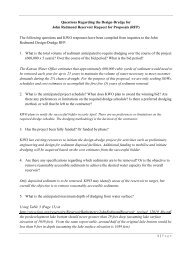
Figure 1. <strong>Wellington</strong> <strong>City</strong> <strong>Lake</strong> . ............................................................................... 1<br />
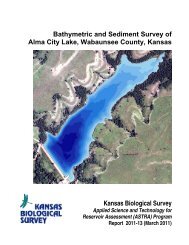
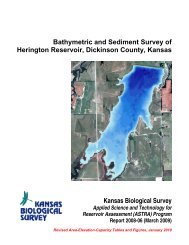
Figure 2. Location of <strong>Wellington</strong> <strong>City</strong> <strong>Lake</strong> in <strong>Sumner</strong> <strong>County</strong>, <strong>Kansas</strong>. .................. 2<br />
Figure 3.<br />
a. Photograph, water surface elevation gauge on intake tower,<br />
<strong>Wellington</strong> <strong>Lake</strong>, November 15, 2007....................................................... 4<br />
b. Close-up: Photograph, water surface elevation gauge on<br />
intake tower, <strong>Wellington</strong> <strong>Lake</strong>, November 15, 2007.................................. 4<br />
Figure 4. Bathymetric Survey Transects. ................................................................. 5<br />
Figure 5. Reservoir depth map ................................................................................ 8<br />
Figure 6. Cumulative area-elevation curve – Entire reservoir. ............................... 11<br />
Figure 7. Cumulative volume-elevation curve – Entire reservoir............................ 11<br />
Figure 8. Cumulative area-elevation curve for north impoundment. ...................... 14<br />
Figure 9. Cumulative volume-elevation curve for north impoundment .................. 14<br />
Figure 10. Cumulative area-elevation curve for south impoundment....................... 17<br />
Figure 11. Cumulative volume-elevation curve for south impoundment ................. 17<br />
iii
LIST OF TABLES<br />
Table 1.<br />
Table 2.<br />
Table 3.<br />
Table 4.<br />
Table 5.<br />
Table 6.<br />
Entire Reservoir (North and South impoundments combined)<br />
Cumulative area in acres by tenth foot elevation increments.................... 9<br />
Entire Reservoir (North and South impoundments combined)<br />
Cumulative volume in acre-feet by tenth foot elevation increments .......... 10<br />
North Impoundment ONLY (Old <strong>Wellington</strong> <strong>City</strong> <strong>Lake</strong>)<br />
Cumulative area in acres by tenth foot elevation increments.................... 12<br />
North Impoundment ONLY (Old <strong>Wellington</strong> <strong>City</strong> <strong>Lake</strong>)<br />
Cumulative volume in acre-feet by tenth foot elevation increments .......... 13<br />
South Impoundment ONLY (New <strong>Wellington</strong> <strong>City</strong> <strong>Lake</strong>)<br />
Cumulative area in acres by tenth foot elevation increments.................... 15<br />
South Impoundment ONLY (New <strong>Wellington</strong> <strong>City</strong> <strong>Lake</strong>)<br />
Cumulative volume in acre-feet by tenth foot elevation increments .......... 16<br />
iv
LAKE HISTORY AND PERTINENT INFORMATION<br />
(This section summarized from the National Dam Inventory and the <strong>Kansas</strong><br />
Department of Wildlife and Parks website descriptions)<br />
http://crunch.tec.army.mil.nidpublic.webpages.nid.cfm<br />
http://www.kdwp.state.ks.us/news/Fishing/Where-to-Fish-in-<strong>Kansas</strong>/Fishing-Locations-Public-<br />
<strong>Water</strong>s/Region-4/<strong>Wellington</strong>-<strong>City</strong>-<strong>Lake</strong><br />
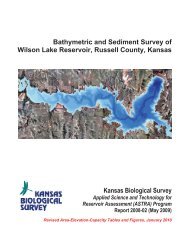
Figure 1. <strong>Wellington</strong> <strong>Lake</strong>, <strong>Sumner</strong> <strong>County</strong>, <strong>Kansas</strong> (Photo: KBS).<br />
Location: 5 miles west of <strong>Wellington</strong>, <strong>Kansas</strong> on US Hwy 160 in <strong>Sumner</strong> <strong>County</strong><br />
on Hargis Creek.<br />
Purpose: Drinking water, flood control and storm water management.<br />
History of Construction: The original <strong>Wellington</strong> <strong>City</strong> <strong>Lake</strong> Dam was<br />
constructed in 1935 on East Prairie Creek in <strong>Sumner</strong> <strong>County</strong>. It is owned by the<br />
<strong>City</strong> of <strong>Wellington</strong>. The <strong>Wellington</strong> <strong>Lake</strong> Dam Project in 1993 increased the<br />
<strong>Lake</strong>'s surface area by 50%.<br />
Structure and Spillway Type: The project consists of an earthfill embankment<br />
and a total dam length of 4,150 feet, including an uncontrolled spillway, 400 feet<br />
wide.<br />
1
<strong>Sumner</strong> <strong>County</strong>, <strong>Kansas</strong><br />
Mulvane<br />
Belle Plaine<br />
Conway Springs<br />
Argonia<br />
Milan<br />
Mayfield<br />
<strong>Wellington</strong><br />
Oxford<br />
Geuda Springs<br />
South Haven<br />
Caldwell<br />
Hunnewell<br />
-<br />
Miles<br />
0 1.5 3 6 9 12<br />
Figure 2. Location of <strong>Wellington</strong> <strong>City</strong> <strong>Lake</strong> in <strong>Sumner</strong> <strong>County</strong>, <strong>Kansas</strong><br />
2
Reservoir Bathymetric (Depth) Surveying Procedures<br />
KBS operates a Biosonics DT-X acoustic echosounding system<br />
(www.biosonicsinc.com) with a 200 kHz split-beam transducer and a 38-kHz singlebeam<br />
transducer. In addition to providing basic information on reservoir depth profiles,<br />
the Biosonics system also permits the assessment of bottom sediment composition.<br />
Latitude-longitude information is provided by a JRC global positioning system (GPS)<br />
that interfaces with the Biosonics system. ESRI’s ArcGIS is used for on-lake navigation<br />
and positioning, with GPS data feeds provided by the Biosonics unit through a serial<br />
cable. Power is provided to the echosounding unit, command/navigation computer, and<br />
auxiliary monitor by means of a inverter and battery backup device that in turn draw<br />
power from the 12-volt boat battery.<br />
Pre-survey preparation:<br />
Geospatial reference data: Prior to conducting the survey, geospatial data of the target<br />
lake is acquired, including georeferenced National Agricultural Imagery Project (NAIP)<br />
photography. The lake boundary is digitized as a polygon shapefile from the FSA NAIP<br />
georeferenced aerial photography obtained online from the Data Access and Service<br />
Center (DASC) at the <strong>Kansas</strong> Geological Survey. Prior to the lake survey, a series of<br />
transect lines are created as a shapefile in ArcGIS for guiding the boat during the<br />
survey. Transect lines are spaced more closely (25-50 meters separation) on smaller<br />
state/local lakes, while a spacing of 100-150 meters is used for federal reservoirs.<br />
Survey procedures:<br />
Calibration (Temperature and ball check): After boat launch and initialization of the<br />
Biosonics system and command computer, system parameters are set in the Biosonics<br />
Visual Acquisition software. The temperature of the lake at 1-2 meters is taken with a<br />
research-grade metric electronic thermometer. This temperature, in degrees Celsius, is<br />
input to the Biosonics Visual Acquisition software to calculate the speed of sound in<br />
water at the given temperature at the given depth. Start range, end range, ping<br />
duration, and ping interval are also set at this time. A ball check is performed using a<br />
tungsten-carbide sphere supplied by Biosonics for this purpose. The ball is lowered to a<br />
known distance (1.0 meter) below the transducer faces. The position of the ball in the<br />
water column (distance from the transducer face to the ball) is clearly visible on the<br />
echogram. The echogram distance is compared to the known distance to assure that<br />
parameters are properly set and the system is operating correctly.<br />
On-lake survey procedures: Using the GPS Extension of ArcGIS, the GPS data feed<br />
from the GPS receiver via the Biosonics echosounder, and the pre-planned transect<br />
pattern, the location of the boat on the lake in real-time is shown on the<br />
command/navigation computer screen. To assist the boat operator in navigation, an<br />
auxiliary LCD monitor is connected to the computer and placed within the easy view of<br />
the boat operator. Transducer face depth on all dates is 0.5 meters below the water<br />
surface. The transect pattern is maintained except when modified by obstructions in the<br />
lake (e.g., partially submerged trees) or shallow water and mudflats. Data are<br />
automatically logged in new files every half-hour (approximately 9000-ping files) by the<br />
Biosonics system.<br />
3
<strong>Wellington</strong> <strong>Lake</strong> Elevation Benchmark:<br />
Elevation of the water surface on the day of the bathymetric survey was taken from the<br />
gauge on the water intake tower located midlake at the western end of the former dam.<br />
The gauge is marked in feet above sea level, with minor markings at 3-inch intervals.<br />
From this gauge we determined that the water level was 1209.25 feet on November 15,<br />
2007. This value is assumed to be NGVD29.<br />
Figure 3a. <strong>Water</strong> surface elevation gauge on intake tower, <strong>Wellington</strong> <strong>Lake</strong>, November 15, 2007.<br />
Figure 3b. Closeup: <strong>Water</strong> surface elevation gauge on intake tower, <strong>Wellington</strong> <strong>Lake</strong>, November<br />
15, 2007. <strong>Water</strong> elevation is 1209.25 feet.<br />
4
Ü<br />
0 0.25 0.5 0.75 1<br />
Miles<br />
Figure 4. Bathymetric Survey Transects<br />
5
Post-processing (Visual Bottom Typer)<br />
The Biosonics DT-X system produces data files in a proprietary DT4 file format<br />
containing acoustic and GPS data. To extract the bottom position from the acoustic<br />
data, each DT4 file is processed through the Biosonics Visual Bottom Typer (VBT)<br />
software. The processing algorithm is described as follows:<br />
“The BioSonics, Inc. bottom tracker is an “end_up" algorithm, in that<br />
it begins searching for the bottom echo portion of a ping from the last<br />
sample toward the first sample. The bottom tracker tracks the bottom echo<br />
by isolating the region(s) where the data exceeds a peak threshold for N<br />
consecutive samples, then drops below a surface threshold for M samples.<br />
Once a bottom echo has been identified , a bottom sampling window is<br />
used to find the next echo. The bottom echo is first isolated by user_defined<br />
threshold values that indicate (1) the lowest energy to include in the bottom<br />
echo (bottom detection threshold) and (2) the lowest energy to start looking<br />
for a bottom peak (peak threshold). The bottom detection threshold allows<br />
the user to filter out noise caused by a low data acquisition threshold. The<br />
peak threshold prevents the algorithm from identifying the small energy<br />
echoes (due to fish, sediment or plant life) as a bottom echo.” (Biosonics<br />
Visual Bottom Typer User’s Manual, Version 1.10, p. 70).<br />
Data is output as a comma-delimited (*.csv) text file. A set number of qualifying pings<br />
are averaged to produce a single report (for example, the output for ping 31 {when<br />
pings per report is 20} is the average of all values for pings 12-31). Standard analysis<br />
procedure for all 2008 and later data is to use the average of 7 pings to produce one<br />
output value.<br />
All raw *.csv files are merged into one master *.csv file using the shareware program<br />
File Append and Split Tool (FAST) by Boxer Software (Ver. 1.0, 2006).<br />
Post-processing (Excel)<br />
The master *.csv file created by the FAST utility is imported into Microsoft Excel.<br />
Excess header lines are deleted (each input CSV file has its own header), and the<br />
header file is edited to change the column headers “#Ping” to “Ping” and “E1’ “ to “E11”,<br />
characters that are not ingestable by ArcGIS. Entries with depth values of zero (0) are<br />
deleted, as are any entries with depth values less than the start range of the data<br />
acquisition parameter (typically 0.49 meters or less) (indicating areas where the water<br />
was too shallow to record a depth reading).<br />
In Excel, depth adjustments are made. A new field – Adj_Depth – is created. The value<br />
for AdjDepth is calculated as AdjDepth = Depth + (Transducer Face Depth), where the<br />
Transducer Face Depth represents the depth of the transducer face below water level in<br />
meters (Typically, this value is 0.5 meters). Four values are computed in Excel:<br />
DepthM, DepthFt, ElevM and ElevFt, where:<br />
6
DepthM = Adj_Depth<br />
DepthFt = Adj_Depth * 3.28084<br />
These water depths are RELATIVE water depths that can vary from day-to-day based<br />
on the elevation of the water surface. In order to normalize all depth measurements to<br />
an absolute reference, water depths must be subtracted from an established value for<br />
the elevation of the water surface at the time of the bathymetric survey. Determination<br />
of water surface elevation has been described in an earlier section on establishment of<br />
lake levels.<br />
To set depths relative to lake elevation, another field is added to the attribute table of<br />
the point shapefile, ElevM. The value for this attribute is then computed as<br />
Depth_ElevM = (Elevation of the <strong>Water</strong> Surface in meters above sea level) - Adj_Depth.<br />
Elevation of the water surface in feet above sea level is also computed by converting<br />
ElevM to elevation in feet (ElevM * 3.28084).<br />
Particularly for multi-day surveys, ADJ_DEPTH, Depth_M, and Depth_Ft should NOT<br />
be used for further analysis or interpolation. If water depth is desired, it should be<br />
produced by subtracting Elev_M or Elev_Ft from the reference elevation used for<br />
interpolation purposes (for federal reservoirs, the elevation of the water surface on the<br />
day that the aerial photography from which the lake perimeter polygon was digitized).<br />
Post-processing (ArcGIS):<br />
Ingest to ArcGIS is accomplished by using the Tools – Add XY Data option. The<br />
projection information is specified at this time (WGS84). Point files are displayed as<br />
Event files, and are then exported as a shapefile (filename convention:<br />
ALLPOINTS_WGS84.shp). The pointfile is then reprojected to the UTM coordinate<br />
system of the appropriate zone (14 or 15) (filename convention ALLPOINTS_UTM.shp).<br />
Raster interpolation of the point data is performed using the same input data and the<br />
Topo to Raster option within the 3D Extension of ArcGIS. The elevation of the reservoir<br />
on the date of aerial photography used to create the perimeter/shoreline shapefile was<br />
used as the water surface elevation in all interpolations from point data to raster data.<br />
Contour line files are derived from the raster interpolation files using the ArcGIS<br />
command under 3D Analyst – Raster Surface – Contour.<br />
Area-elevation-volume tables are derived using an ArcGIS extension custom written for<br />
and available from the ASTRA Program. Summarized, the extension calculates the<br />
area and volume of the reservoir at 1/10-foot elevation increments from the raster data<br />
for a series of water surfaces beginning at the lowest elevation recorded and<br />
progressing upward in 1/10-foot elevation increments to the reference water surface.<br />
Cumulative volume is also computed in acre-feet.<br />
7
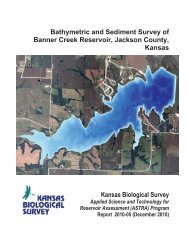
Ü<br />
DepthinFeet<br />
0.00 - 2.00<br />
2.01 - 4.00<br />
4.01 - 6.00<br />
6.01 - 8.00<br />
8.01 - 10.00<br />
10.01 - 12.00<br />
12.01 - 14.00<br />
14.01 - 16.00<br />
16.01 - 18.00<br />
18.01 - 20.00<br />
20.01 - 22.00<br />
22.01 - 24.00<br />
24.01 - 26.00<br />
26.01 - 28.00<br />
4 Ft. Contours<br />
0 0.25 0.5 0.75 1<br />
Miles<br />
Figure 5. <strong>Water</strong> depth based on November 2007 bathymetric survey.<br />
Depths are based on a pool elevation of 1209.25 feet.<br />
8
Elevation<br />
(ft NGVD)<br />
Table 1<br />
Entire Reservoir (North and South impoundments combined)<br />
Cumulative area in acres by tenth foot elevation increments<br />
0.00 0.10 0.20 0.30 0.40 0.50 0.60 0.70 0.80 0.90<br />
1182 0 0 0 0 1 1 1 1 2 2<br />
1183 3 3 4 5 6 7 8 10 11 11<br />
1184 12 13 14 15 16 17 18 19 20 21<br />
1185 22 23 24 25 27 28 29 30 31 32<br />
1186 33 35 36 37 38 39 41 42 43 44<br />
1187 44 45 46 47 48 50 51 52 53 54<br />
1188 55 56 57 57 58 59 60 60 61 62<br />
1189 63 63 64 65 65 66 67 67 68 68<br />
1190 69 70 70 71 72 72 73 74 74 75<br />
1191 76 76 77 77 78 79 79 80 80 81<br />
1192 81 82 83 83 84 85 85 86 86 87<br />
1193 88 88 89 89 90 91 91 92 92 93<br />
1194 94 94 95 96 97 99 100 102 106 110<br />
1195 113 117 121 125 130 134 139 145 150 155<br />
1196 159 162 165 168 171 173 175 177 179 180<br />
1197 182 184 186 189 192 195 198 201 204 208<br />
1198 211 214 217 221 224 227 230 233 235 238<br />
1199 240 243 246 249 252 256 260 263 268 271<br />
1200 276 280 285 290 295 298 302 307 311 316<br />
1201 321 325 330 334 339 342 346 349 353 357<br />
1202 360 364 368 372 377 381 386 392 396 401<br />
1203 405 410 414 419 423 428 433 439 444 448<br />
1204 454 458 463 468 472 476 480 484 488 492<br />
1205 496 500 504 509 512 516 520 524 527 530<br />
1206 533 535 538 541 543 546 548 550 553 555<br />
1207 558 560 562 565 567 570 572 575 577 580<br />
1208 582 585 587 590 593 595 598 600 603 606<br />
1209 609 612 615<br />
9
Elevation (ft<br />
NGVD)<br />
Table 2<br />
Entire Reservoir (North and South impoundments combined)<br />
Cumulative volume in acre-feet by tenth foot elevation increments<br />
0.00 0.10 0.20 0.30 0.40 0.50 0.60 0.70 0.80 0.90<br />
1182 0 0 0 0 0 0 0 0 0 1<br />
1183 1 1 1 2 2 3 4 5 6 7<br />
1184 8 9 11 12 14 15 17 19 21 23<br />
1185 25 27 29 32 35 37 40 43 46 49<br />
1186 53 56 59 63 67 71 75 79 83 87<br />
1187 92 96 101 105 110 115 120 125 131 136<br />
1188 141 147 152 158 164 170 176 182 188 194<br />
1189 200 206 213 219 226 232 239 246 252 259<br />
1190 266 273 280 287 294 301 309 316 323 331<br />
1191 338 346 354 361 369 377 385 393 401 409<br />
1192 417 425 433 442 450 459 467 476 484 493<br />
1193 502 510 519 528 537 546 555 564 574 583<br />
1194 592 602 611 621 630 640 650 660 671 681<br />
1195 693 704 716 728 741 754 768 782 797 812<br />
1196 828 844 860 877 894 911 928 946 964 982<br />
1197 1000 1018 1037 1056 1075 1094 1114 1134 1154 1175<br />
1198 1195 1217 1238 1260 1282 1305 1328 1351 1374 1398<br />
1199 1422 1446 1471 1495 1521 1546 1572 1598 1624 1651<br />
1200 1679 1707 1735 1763 1793 1822 1852 1883 1914 1945<br />
1201 1977 2009 2042 2075 2109 2143 2178 2212 2248 2283<br />
1202 2319 2355 2392 2429 2466 2504 2543 2582 2621 2661<br />
1203 2701 2742 2783 2825 2867 2909 2953 2996 3040 3085<br />
1204 3130 3176 3222 3268 3315 3363 3411 3459 3508 3557<br />
1205 3606 3656 3706 3757 3808 3859 3911 3963 4016 4069<br />
1206 4122 4175 4229 4283 4337 4392 4446 4501 4557 4612<br />
1207 4668 4724 4780 4836 4893 4950 5007 5064 5122 5180<br />
1208 5238 5297 5356 5415 5474 5533 5593 5653 5714 5774<br />
1209 5835 5897 5958<br />
10
700<br />
600<br />
Cumulative Area (acres)<br />
500<br />
400<br />
300<br />
200<br />
100<br />
0<br />
1182 1184 1186 1188 1190 1192 1194 1196 1198 1200 1202 1204 1206 1208<br />
Elevation (feet)<br />
Figure 6. Cumulative area-elevation curve – entire reservoir.<br />
7000<br />
6000<br />
Cumulative Volume (acre-feet)<br />
5000<br />
4000<br />
3000<br />
2000<br />
1000<br />
0<br />
1182 1184 1186 1188 1190 1192 1194 1196 1198 1200 1202 1204 1206 1208<br />
Elevation (feet)<br />
Figure 7. Cumulative volume-elevation curve – entire reservoir.<br />
11
Elevation (ft<br />
NGVD)<br />
1193<br />
Table 3<br />
North Impoundment ONLY (Old <strong>Wellington</strong> <strong>City</strong> <strong>Lake</strong>)<br />
Cumulative area in acres by tenth foot elevation increments<br />
0.00 0.10 0.20 0.30 0.40 0.50 0.60 0.70 0.80 0.90<br />
1194 1 1 2 2 4 7 10<br />
1195 13 16 19 22 26 30 34 39 44 48<br />
1196 51 54 56 58 60 61 63 64 65 66<br />
1197 67 68 70 72 74 76 78 80 83 85<br />
1198 88 90 93 95 97 100 102 103 105 107<br />
1199 108 110 112 114 117 120 123 126 129 132<br />
1200 135 138 142 147 151 154 157 161 164 168<br />
1201 172 175 179 183 186 189 192 194 197 200<br />
1202 203 206 209 212 216 220 224 228 232 236<br />
1203 239 243 246 250 254 258 262 267 271 275<br />
1204 280 283 287 291 294 298 301 304 308 311<br />
1205 314 317 321 324 327 330 334 336 339 341<br />
1206 343 345 347 349 351 353 355 356 358 360<br />
1207 362 363 365 367 369 370 372 374 376 377<br />
1208 379 381 383 385 387 389 390 392 394 396<br />
1209 398 400 402<br />
12
Table 4<br />
North Impoundment ONLY (Old <strong>Wellington</strong> <strong>City</strong> <strong>Lake</strong>)<br />
Cumulative volume in acre-feet by tenth foot elevation increments<br />
Elevation (ft<br />
NGVD)<br />
0.00 0.10 0.20 0.30 0.40 0.50 0.60 0.70 0.80 0.90<br />
1194 0 0 0 0 0 0 1 1 1 2<br />
1195 3 5 6 8 11 14 17 21 25 29<br />
1196 34 39 45 51 57 63 69 75 82 88<br />
1197 95 101 108 115 123 130 138 146 154 162<br />
1198 171 180 189 198 208 218 228 238 249 259<br />
1199 270 281 292 303 315 327 339 351 364 377<br />
1200 390 404 418 433 447 463 478 494 510 527<br />
1201 544 561 579 597 615 634 653 672 692 712<br />
1202 732 752 773 794 816 837 860 882 905 929<br />
1203 952 977 1001 1026 1051 1077 1103 1129 1156 1183<br />
1204 1211 1239 1268 1297 1326 1356 1386 1416 1446 1477<br />
1205 1509 1540 1572 1604 1637 1670 1703 1736 1770 1804<br />
1206 1838 1873 1908 1942 1977 2013 2048 2084 2119 2155<br />
1207 2191 2228 2264 2301 2337 2374 2412 2449 2486 2524<br />
1208 2562 2600 2638 2677 2716 2754 2794 2833 2872 2912<br />
1209 2952 2992 3032<br />
13
450<br />
400<br />
350<br />
Cumulative Area (acres)<br />
300<br />
250<br />
200<br />
150<br />
100<br />
50<br />
0<br />
1194 1195 1196 1197 1198 1199 1200 1201 1202 1203 1204 1205 1206 1207 1208 1209 1210<br />
Elevation (feet)<br />
Figure 8. Cumulative area-elevation curve for north impoundment ONLY<br />
4000<br />
3500<br />
Cumulative Volume (acre-feet)<br />
3000<br />
2500<br />
2000<br />
1500<br />
1000<br />
500<br />
0<br />
1194 1195 1196 1197 1198 1199 1200 1201 1202 1203 1204 1205 1206 1207 1208 1209 1210<br />
Elevation (feet)<br />
Figure 9. Cumulative volume-elevation curve for north impoundment ONLY<br />
14
Table 5<br />
South Impoundment ONLY (New <strong>Wellington</strong> <strong>City</strong> <strong>Lake</strong>)<br />
Cumulative area in acres by tenth foot elevation increments<br />
Elevation (ft<br />
NGVD)<br />
0.00 0.10 0.20 0.30 0.40 0.50 0.60 0.70 0.80 0.90<br />
1182 1 1 1 1 2 2<br />
1183 3 3 4 5 6 7 8 10 11 11<br />
1184 12 13 14 15 16 17 18 19 20 21<br />
1185 22 23 24 25 27 28 29 30 31 32<br />
1186 33 35 36 37 38 39 41 42 43 44<br />
1187 44 45 46 47 48 50 51 52 53 54<br />
1188 55 56 57 57 58 59 60 60 61 62<br />
1189 63 63 64 65 65 66 67 67 68 68<br />
1190 69 70 70 71 72 72 73 74 74 75<br />
1191 76 76 77 77 78 79 79 80 80 81<br />
1192 81 82 83 83 84 85 85 86 86 87<br />
1193 88 88 89 89 90 91 91 92 92 93<br />
1194 94 94 95 96 96 97 98 99 99 100<br />
1195 101 101 102 103 103 104 105 106 106 107<br />
1196 108 109 109 110 111 112 112 113 114 115<br />
1197 115 116 117 118 118 119 120 121 122 122<br />
1198 123 124 125 126 127 128 128 129 130 131<br />
1199 132 133 134 134 135 136 137 138 139 140<br />
1200 141 142 142 143 144 145 146 147 148 148<br />
1201 149 150 151 152 153 154 154 155 156 157<br />
1202 158 158 159 160 161 162 163 163 164 165<br />
1203 166 167 168 168 169 170 171 172 173 174<br />
1204 175 175 176 177 178 179 179 180 181 182<br />
1205 182 183 184 184 185 186 187 187 188 189<br />
1206 189 190 190 191 192 192 193 194 194 195<br />
1207 196 196 197 198 198 199 200 200 201 202<br />
1208 202 203 204 205 206 206 207 208 209 209<br />
1209 210 211 212<br />
15
Table 2<br />
South Impoundment ONLY (New <strong>Wellington</strong> <strong>City</strong> <strong>Lake</strong>)<br />
Cumulative volume in acre-feet by tenth foot elevation increments<br />
Elevation (ft<br />
NGVD)<br />
0.00 0.10 0.20 0.30 0.40 0.50 0.60 0.70 0.80 0.90<br />
1182 1<br />
1183 1 1 1 2 2 3 4 5 6 7<br />
1184 8 9 11 12 14 15 17 19 21 23<br />
1185 25 27 29 32 35 37 40 43 46 49<br />
1186 53 56 59 63 67 71 75 79 83 87<br />
1187 92 96 101 105 110 115 120 125 131 136<br />
1188 141 147 152 158 164 170 176 182 188 194<br />
1189 200 206 213 219 226 232 239 246 252 259<br />
1190 266 273 280 287 294 301 309 316 323 331<br />
1191 338 346 354 361 369 377 385 393 401 409<br />
1192 417 425 433 442 450 459 467 476 484 493<br />
1193 502 510 519 528 537 546 555 564 574 583<br />
1194 592 602 611 621 630 640 650 659 669 679<br />
1195 689 699 710 720 730 741 751 762 772 783<br />
1196 794 804 815 826 837 848 860 871 882 894<br />
1197 905 917 929 940 952 964 976 988 1000 1012<br />
1198 1025 1037 1049 1062 1075 1087 1100 1113 1126 1139<br />
1199 1152 1165 1179 1192 1206 1219 1233 1247 1260 1274<br />
1200 1288 1303 1317 1331 1345 1360 1374 1389 1404 1419<br />
1201 1434 1449 1464 1479 1494 1509 1525 1540 1556 1571<br />
1202 1587 1603 1619 1635 1651 1667 1683 1700 1716 1733<br />
1203 1749 1766 1782 1799 1816 1833 1850 1867 1885 1902<br />
1204 1919 1937 1955 1972 1990 2008 2026 2044 2062 2080<br />
1205 2098 2116 2135 2153 2172 2190 2209 2228 2246 2265<br />
1206 2284 2303 2322 2341 2360 2380 2399 2418 2438 2457<br />
1207 2477 2496 2516 2536 2556 2575 2595 2615 2635 2656<br />
1208 2676 2696 2717 2737 2758 2778 2799 2820 2841 2862<br />
1209 2883 2904 2925<br />
16
250<br />
200<br />
Cumulative Area (acres)<br />
150<br />
100<br />
50<br />
0<br />
1182 1184 1186 1188 1190 1192 1194 1196 1198 1200 1202 1204 1206 1208 1210<br />
Elevation (feet)<br />
Figure 10. Cumulative area-elevation curve for south impoundment ONLY.<br />
3500<br />
3000<br />
Cumulative Area (acres)<br />
2500<br />
2000<br />
1500<br />
1000<br />
500<br />
0<br />
1182 1184 1186 1188 1190 1192 1194 1196 1198 1200 1202 1204 1206 1208 1210<br />
Elevation (feet)<br />
Figure 11. Cumulative volume-elevation curve for south impoundment ONLY<br />
17