An Overview of the Total Lightning Jump Algorithm: Past ... - GOES-R
An Overview of the Total Lightning Jump Algorithm: Past ... - GOES-R
An Overview of the Total Lightning Jump Algorithm: Past ... - GOES-R

Create successful ePaper yourself
Turn your PDF publications into a flip-book with our unique Google optimized e-Paper software.
Christopher J. Schultz 1 , Lawrence D. Carey 2 ,<br />
Walter A. Petersen 3 , Daniel Cecil 2 , Monte<br />
Bateman 4 , Steven Goodman 5 , Ge<strong>of</strong>frey Stano 6 ,<br />
Valliappa Lakshmanan 7<br />
1 - Department <strong>of</strong> Atmospheric Science, UAHuntsville, Huntsville, AL<br />
2– Earth System Science Center, UAHuntsville, Huntsville, AL<br />
3 – NASA Wallops Flight Facility, Wallops , VA<br />
4 – USRA (NASA MSFC)<br />
5 – NOAA NESDIS<br />
6 – ENSCO (NASA MSFC)<br />
7 – OU CIMMS/NOAA NSSL
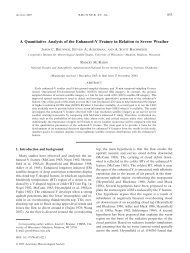
Adapted from Goodman et al. (1988)<br />
Goodman et al. (1988)<br />
demonstrated that total<br />
lightning peaked prior to<br />
<strong>the</strong> onset <strong>of</strong> a microburst.<br />
Williams et al. (1989)<br />
showed that <strong>the</strong> peak total<br />
flash rate correlated with<br />
<strong>the</strong> maximum vertical<br />
extent <strong>of</strong> pulse<br />
thunderstorms, and<br />
preceded maximum outflow<br />
velocity by several minutes.<br />
MacGorman et al. (1989)<br />
showed that <strong>the</strong> total flash<br />
rate peaked 5 minutes prior<br />
to a tornado touchdown,<br />
while <strong>the</strong> cloud-to-ground<br />
(CG) flash rate peaked 15<br />
minutes after <strong>the</strong> peak in<br />
intra cloud flash rate.<br />
Adapted from MacGorman et al. (1989)
Adapted from Williams et al. (1999) (above)<br />
Williams et al. (1999)<br />
examined a large<br />
number <strong>of</strong> severe<br />
storms in Central FL<br />
Noticed that <strong>the</strong> total<br />
flash rate “jumped”<br />
prior to <strong>the</strong> onset <strong>of</strong><br />
severe wea<strong>the</strong>r.<br />
Williams also proposed<br />
60 flashes min -1 or<br />
greater for separation<br />
between severe and<br />
non-severe<br />
thunderstorms.
Gatlin and Goodman<br />
(2010) , JTECH;<br />
developed <strong>the</strong> first<br />
lightning jump<br />
algorithm<br />
Study proved that it was<br />
indeed possible to<br />
develop an operational<br />
algorithm for severe<br />
wea<strong>the</strong>r detection<br />
Mainly studied severe<br />
thunderstorms<br />
• Only 1 non severe storm in<br />
a sample <strong>of</strong> 26 storms<br />
Adapted from Gatlin and Goodman (2010)
Six separate lightning jump<br />
configurations tested<br />
<br />
<br />
<br />
Case study expansion:<br />
• 107 T-storms analyzed<br />
• 38 severe<br />
• 69 non-severe<br />
The “2σ” configuration<br />
yielded best results<br />
• POD beats NWS performance<br />
statistics (80-90%);<br />
• FAR even better i.e.,15%<br />
lower (Barnes et al. 2007)<br />
• Caveat: Large difference<br />
in sample sizes, more cases<br />
are needed to finalize<br />
result.<br />
Demonstrated that an<br />
operational algorithm is<br />
indeed possible.<br />
Thunderstorm breakdown:<br />
North Alabama – 83 storms<br />
Washington D.C. – 2 storms<br />
Houston TX – 13 storms<br />
Dallas – 9 storms<br />
<strong>Algorithm</strong> POD FAR CSI HSS<br />
Gatlin 90% 66% 33% 0.49<br />
Gatlin 45 97% 64% 35% 0.52<br />
2σ 87% 33% 61% 0.75<br />
3σ 56% 29% 45% 0.65<br />
Threshold 5 72% 40% 49% 0.66<br />
Threshold 4 83% 42% 50% 0.67
Expanded to 711 thunderstorms<br />
• 255 severe, 456 non severe<br />
• Primarily from N. Alabama (555)<br />
• Also included<br />
• Washington D.C. (109)<br />
• Oklahoma (25)<br />
• STEPS (22)<br />
Confirmed that total lightning trends perform better<br />
than cloud-to-ground (CG) lightning trends for<br />
thunderstorm monitoring.
Nearly 40% <strong>of</strong> misses in Schultz et al. (2011) came from low topped supercells,<br />
TC rainband storms, and cold season events<br />
- Lack <strong>of</strong> lightning activity inhibited <strong>the</strong> performance <strong>of</strong> <strong>the</strong> algorithm<br />
Time-height plot <strong>of</strong> reflectivity (top) and total flash rate (bot) for an EF-1 producing<br />
tornadic storm on March 25, 2010. Tornado touchdown time ~2240 UTC.
TITAN work helps put <strong>the</strong> LJ into <strong>the</strong> context <strong>of</strong> an<br />
automatic tracker that can be traced to prior LJ<br />
work (Schultz et al. 2009, 2011).<br />
• <strong>Algorithm</strong> itself might need to be adjusted to<br />
accommodate objective tracking (i.e., no manual<br />
corrections).<br />
Use GLM resolution LMA flash data and products<br />
(e.g., flash extent density).<br />
Explore limitations and improvements to LJ<br />
algorithm with automatic tracking and GLM<br />
resolution.<br />
8
Recent work using TITAN at NCAR<br />
• Radar radar reflectivity<br />
• 35 dBZ, –15 °C<br />
• 50 dBZ, 0 °C<br />
• <strong>Lightning</strong><br />
• 1 km Flash Extent Density<br />
• 8 km Flash Extent Density, Flash Density<br />
• Each <strong>of</strong> <strong>the</strong>se entities has been tested on multiple flash<br />
density/flash extent density thresholds<br />
Goal was to explore lightning tracking<br />
methods and get an apples to apples<br />
comparison with past studies
Following <strong>the</strong> Schultz et al. methodology<br />
(35 dBZ -15°C) and not touching <strong>the</strong> tracks<br />
we obtain <strong>the</strong> following from TITAN in a<br />
period between February and June:<br />
Hits Misses False<br />
Alarms<br />
Lead<br />
Time<br />
# <strong>of</strong><br />
Storms<br />
POD<br />
FAR<br />
5 27 19 2.498 1035 15.048 85.07<br />
• These are only <strong>the</strong> “isolated” storms within <strong>the</strong><br />
larger storm sample<br />
Vast majority <strong>of</strong> this sample is non-severe<br />
10
• Using 1 km resolution from past studies (e.g., Patrick and<br />
Demetriades 2005, McKinney et al. 2008)<br />
• Feedback from NWS forecasters was positive toward this<br />
method because it produced more “cellular” features<br />
• 3x3 boxcar smoothing applied (mean value) to create a<br />
consolidated feature that is trackable.<br />
• Statistics below represent “isolated” storms identified by TITAN.<br />
Sigma<br />
Hits/events<br />
(POD)<br />
False Alarms<br />
(FAR)<br />
Lead<br />
Time<br />
# <strong>of</strong> storms<br />
FED 2 33/138 22/138 (23.91%) (15.94%) 71/104 69/91 (75.82%) (68.26%) 2.86 2.45 807/2331 (35%)<br />
FED 3 69/134 43/134 (51.49) (32.09) 62/134 42/85 (49.41%) (47.32%) 6.81 3.36 465/962 (48%)<br />
FED 4 34/79 17/79 (43.04%) (21.51%) 55/84 33/50 (61.79%) (66.00%) 5.45 3.12 284/545 (52%)<br />
FED 5 39/62 17/62 (62.90%) (27.41%) 48/87 32/49 (55.17%) (65.30%) 7.14 3.25 190/336 (57%)
Midday QLCS tornadic storm<br />
Right, time history plot <strong>of</strong> <strong>the</strong><br />
lightning trend associated with <strong>the</strong><br />
storm circled below in <strong>the</strong> 1 km FED<br />
image<br />
Left, 1 km FED product. Red circle<br />
represents portion <strong>of</strong> <strong>the</strong> QLCS that<br />
was most active at this time.
1 KM FED METHOD 35 DBZ -15°C<br />
<strong>Lightning</strong>’s limitations:<br />
1. Missing <strong>the</strong> developmental phase <strong>of</strong> <strong>the</strong> storm;<br />
impacts lead time (toward edge <strong>of</strong> LMA in this case)<br />
2. lightning centers can be split (not shown)<br />
3. lightning areas are much smaller as compared to radar
No matter how<br />
hard we try<br />
severe events<br />
will be missed<br />
due to a lack<br />
<strong>of</strong> lightning<br />
Tornadic MCV<br />
27 April 2011<br />
<strong>An</strong>imation courtesy<br />
NWS Huntsville
Number <strong>of</strong> stations contributing to <strong>the</strong> flash extent density can cause a<br />
“blooming” effect which would affect <strong>the</strong> FED thresholds used to track storms.
We will not have <strong>the</strong> capability to monitor<br />
lightning at 1 km using GLM<br />
First step: Must test LMA flash data at 8<br />
km – GLM Resolution<br />
Goal: In addition to resolution, must also<br />
account for <strong>the</strong> different measurement <strong>of</strong><br />
lightning (VHF vs optical) – GLM Proxy<br />
18
By moving to a GLM<br />
resolution, we lost<br />
individual convective<br />
areas within a line.<br />
Individual tornadic cells within<br />
a line<br />
Midday tornadic QLCS, 27 April, 2011
THRESHOLDS TESTED<br />
Sensitivity testing on FED<br />
and FD products<br />
Testing <strong>of</strong> spatial criteria<br />
for track continuation<br />
Storm Report numbers<br />
Automated verification<br />
FED – threshold 6 flashes – no smooth<br />
FED – threshold 7 flashes – no smooth<br />
FED – threshold 8 flashes – no smooth<br />
FED – threshold 9 flashes – no smooth<br />
FED – threshold 10 flashes – no smooth<br />
FD – threshold 6 flashes – smoo<strong>the</strong>d<br />
FD – threshold 7 flashes – smoo<strong>the</strong>d<br />
FD – threshold 8 flashes – smoo<strong>the</strong>d<br />
FD – threshold 9 flashes – smoo<strong>the</strong>d<br />
FD – threshold 10 flashes - smoo<strong>the</strong>d
Main failure is in tracking <strong>of</strong> features<br />
• Feature identification numbers changing constantly<br />
• Shape and size primary culprits<br />
• Affect verification statistics when looking at LJ<br />
Current 2σ should likely not be used alone<br />
in real-time operations<br />
• Combination <strong>of</strong> algorithms likely <strong>the</strong> best candidate<br />
Need to track on a multivariate field…<br />
21
35<br />
Source<br />
Hailstorm, March 30,<br />
2011<br />
Upward tick in<br />
lightning seen 10 about<br />
10 minutes prior Source to<br />
hail, but magnitude<br />
<strong>of</strong> jump not as great
Validation <strong>of</strong> a lightning tracking method<br />
using <strong>the</strong> lightning jump will be<br />
challenging<br />
• <strong>Algorithm</strong> verification changes drastically with<br />
utilization <strong>of</strong> each algorithm type (2σ,<br />
threshold, combination).<br />
• Not an apples to apples comparison<br />
between tracking methods (FED vs FD,<br />
lightning vs radar).<br />
• Combination <strong>of</strong> data types in tracking might<br />
be <strong>the</strong> most useful.<br />
23
Tracking – It’s (almost) all in <strong>the</strong> tracking now.<br />
• Cell tracking is essential but also a limiting factor to LJ performance: dropped<br />
tracks, splits/mergers etc. Needs more work.<br />
• Tracking on lightning alone likely reduces 2 lead time for some storms –<br />
favors multi-sensor approach and will require modifications to LJ algorithm<br />
<br />
<br />
GLM Resolution<br />
• As expected, 8 km LMA lightning resolution can sometimes change/complicate<br />
cell identification and tracking<br />
• However, lightning trends (and jump) are typically still in GLM resolution cells<br />
• GLM resolution and proxy (next) will likely require some adjustments to <strong>the</strong><br />
lightning jump algorithm and tracking (e.g., threshold choices)<br />
<strong>Lightning</strong> <strong>Jump</strong> <strong>Algorithm</strong><br />
• Since tracking limitations were manually corrected, Schultz et al. studies<br />
represent <strong>the</strong> benchmark (i.e., upside) for what we can expect for verification<br />
• Due to automatic tracking limitations, <strong>the</strong> 2σ method alone will likely not suffice<br />
in operations.<br />
• To adjust to automated tracking, need to incorporate additional methods that do<br />
not require as much cell history (e.g., “Threshold approach” in Schultz et al.<br />
2009)<br />
24
GLM Proxy 5-minute Flash Count<br />
WDSS-II (wsegmotionII/k-means) cells<br />
25
Colors indicate different cell<br />
identifications.<br />
Some <strong>of</strong> <strong>the</strong> spikes in GLM proxy<br />
flash rate are due to cell mergers.<br />
Time series that end abruptly at<br />
high flash rates are due to dropped<br />
associations (i.e., from one time<br />
step to ano<strong>the</strong>r, <strong>the</strong> cell gets a new<br />
name and starts a new time series).<br />
• When <strong>the</strong> color changes frequently for<br />
one true cell, its time history is<br />
compromise.<br />
See Cecil et al. GLM STM poster on<br />
“Cell Identification and Tracking<br />
for Geostationary <strong>Lightning</strong><br />
Mapper” for more details and<br />
future directions for improvement.<br />
26
Modify current WDSS-II/K-means cell tracking<br />
algorithm and reduce tracking ambiguity<br />
• O<strong>the</strong>r GLM fields (GLM flash [or group or event] extent<br />
density). Multi-sensor, multi-variable tracking optimization<br />
• See Dan Cecil’s GLM STM poster.<br />
Adaptation <strong>of</strong> LJA for full use <strong>of</strong> a “Level II” GLM<br />
optical flash proxy (e.g., thresholds)<br />
Integration <strong>of</strong> LJA with ongoing K-means cell<br />
tracking on GLM resolution and proxy<br />
(acceleration)<br />
• Threshold and 2 combined<br />
Participation in National <strong>Lightning</strong> <strong>Jump</strong> Field Test<br />
coordinated by NOAA NWS (acceleration <strong>of</strong> PG)<br />
Objective environmental definition <strong>of</strong> cool season<br />
conditions and modification <strong>of</strong> LJA to improve<br />
performance (temporary de-prioritization)<br />
27
GUIDANCE STATEMENT<br />
• “The <strong>Lightning</strong> <strong>Jump</strong> Test (LJT) Project shall run<br />
an automated version <strong>of</strong> <strong>the</strong> 2σ algorithm using<br />
<strong>Total</strong> <strong>Lightning</strong> Data (in particular, LMA data) in<br />
order to evaluate its performance and effect on<br />
watch/warning operations via severe wea<strong>the</strong>r<br />
verification, with an eye to <strong>the</strong> future application<br />
<strong>of</strong> <strong>the</strong> GLM on <strong>GOES</strong>-R.”<br />
28
Establish a fully automated processing<br />
method using <strong>the</strong> “2σ” (2-sigma) algorithm.<br />
This includes automated (but not real-time)<br />
verification in order to calculate and<br />
evaluate POD/FAR/CSI for severe wea<strong>the</strong>r<br />
forecasts.<br />
This is expected to produce a large data set,<br />
which can be used for various o<strong>the</strong>r postprocessing<br />
elements, yet to be determined.<br />
The results <strong>of</strong> this test are intended to<br />
inform <strong>the</strong> utility <strong>of</strong> <strong>the</strong> GLM data from<br />
<strong>GOES</strong>-R.<br />
29
Project Managers: Lead: Tom Filiaggi (NOAA NWS),<br />
Steve Goodman (NOAA NESDIS)<br />
Participant Organizations: NASA MSFC, NOAA NESDIS,<br />
NOAA NSSL, NOAA NWS (OST-MDL, OST-SPB, WFO’s –<br />
MLB, HUN, LWX, LUB), NOAA SPC, TTU, UAHuntsville, U<br />
<strong>of</strong> Maryland, U <strong>of</strong> Oklahoma<br />
24 participating individuals (so far)<br />
Area Leads<br />
• <strong>Algorithm</strong>s (Carey): <strong>Lightning</strong> <strong>Jump</strong> <strong>Algorithm</strong> (Carey, Schultz),<br />
Tracking (Kuhlman), Flash identification (Carey), <strong>Lightning</strong><br />
Data/Geographic Domain (Stano)<br />
• Test Plan (Stumpf)<br />
• Data Management (Kuhlman)<br />
• Verification (Carey)<br />
30
Phase 1, Preparation: August 2011 –<br />
February 2012<br />
• Identify and tune tracker, LMA flash identification<br />
algorithm, lightning jump algorithm<br />
• K-means on radar reflectivity at -10C<br />
• LMA flash ID algorithm: NSSL/OU/Lak’s code<br />
• Will recommend that 2 be updated to 2/threshold blend<br />
• Define verification data and methods<br />
• Enhanced verification beyond Storm Data (SHAVE - Severe<br />
Hazards <strong>An</strong>alysis and Verification Experiment)<br />
• Prepare hardware and define data management plan<br />
• Flesh out test plan<br />
• Stress test (on archived case data)<br />
31
Phase 2, Maturation (1 st test phase):<br />
March 2012 – October 2012<br />
• Run <strong>Lightning</strong> <strong>Jump</strong> <strong>Algorithm</strong> continuously for<br />
defined domain and archive data<br />
• Dynamic test: continue tuning various aspects as<br />
we learn, adapt, and improve<br />
• Tracking<br />
• Verification<br />
• Flash ID/proxy definition<br />
• Not yet done for “operational forecaster”<br />
environment<br />
• Preliminary report to NWS in Summer 2012<br />
32
Phase 3, Re-evaluation : November 2012<br />
– February 2013<br />
• Evaluate Phase 2 for lessons learned<br />
• Incorporate new knowledge from R3 and Phase 2<br />
test<br />
• Re-tune and improve algorithms<br />
• Tracking improvements, multi-sensor tracking (radar,<br />
lightning, and/or IR ?)<br />
• Verification (e.g., expand to radar ?)<br />
• GLM flash proxy improvements (e.g., resolution, VHFto-optical).<br />
Not clear that this will be ready due to<br />
strong feedback to tracking.<br />
• Incorporate o<strong>the</strong>r lightning proxies (e.g., WTLN etc)?<br />
33
Phase 4, Full Test : March 2013 – August<br />
2013<br />
• <strong>Algorithm</strong>s should be stable (static) during test<br />
• Possibly accomplished in an operational forecasting<br />
environment<br />
• Some training required for forecasters<br />
Phase 5, Wrap Up: July – September 2013<br />
• Evaluation and NWS reporting by end <strong>of</strong> FY13<br />
Phase 6 (?), Additional NWS Test Phases?<br />
• UAHuntsville LJ R3 plan PG in Optional Year 3 (FY13)<br />
• Remaining issues to test operationally (e.g., more<br />
realistic GLM proxy, multi-sensor tracking etc)?<br />
34
Type<br />
2σ<br />
# <strong>of</strong><br />
Features<br />
Hits<br />
Misses False<br />
Alarms<br />
POD FAR Lead<br />
Time<br />
FED 6 618 44 93 58 32.11 56.86 5.68<br />
FED 7 578 38 119 70 24.20 64.81 4.28<br />
FED 8 499 40 101 68 28.37 62.96 4.51<br />
FED 9 469 43 115 55 27.21 56.12 4.11<br />
FED 10 421 24 95 57 20.16 70.37 2.82<br />
Threshold<br />
FED 6 618 42 95 18 30.65 30.00 4.51<br />
FED 7 578 33 124 27 21.01 45.00 3.15<br />
FED 8 499 32 109 47 22.69 59.49 3.70<br />
FED 9 469 54 104 40 34.17 42.55 6.05<br />
FED 10 421 43 76 37 36.13 46.25 5.54
Type<br />
2σ<br />
# <strong>of</strong><br />
Features<br />
Hits<br />
Misses False<br />
Alarms<br />
POD FAR Lead<br />
Time<br />
FD 6 267 31 83 22 27.19 41.50 4.42<br />
FD 7 229 25 70 34 26.31 57.62 3.94<br />
FD 8 212 40 86 21 31.74 34.42 4.89<br />
FD 9 184 36 49 19 42.35 34.54 8.22<br />
FD 10 170 38 53 18 41.75 32.14 5.75<br />
Threshold<br />
FD 6 267 52 62 13 45.61 20.00 6.86<br />
FD 7 229 35 60 16 36.84 31.37 5.38<br />
FD 8 212 51 75 14 40.47 21.54 6.82<br />
FD 9 184 45 40 12 52.94 21.05 11.21<br />
FD 10 170 49 42 18 53.84 26.86 7.73
Type<br />
Combo<br />
# <strong>of</strong><br />
Features<br />
Hits<br />
Misses False<br />
Alarms<br />
POD FAR Lead<br />
Time<br />
FED 6 618 60 77 73 43.80 54.88 7.35<br />
FED 7 578 54 103 86 34.39 61.42 5.94<br />
FED 8 499 52 89 94 36.87 64.38 6.35<br />
FED 9 469 67 91 78 42.41 53.79 8.15<br />
FED 10 421 45 74 81 37.82 64.29 6.25<br />
Combo<br />
FD 6 267 62 52 33 54.38 34.73 8.61<br />
FD 7 229 49 46 50 51.75 50.50 8.40<br />
FD 8 212 67 59 32 53.17 32.32 8.70<br />
FD 9 184 52 33 33 61.17 38.82 12.60<br />
FD 10 170 60 31 32 65.93 34.78 10.09