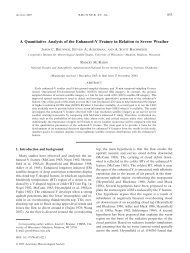
A lightning data assimilation scheme for the WRF-ARW ... - GOES-R
A lightning data assimilation scheme for the WRF-ARW ... - GOES-R
A lightning data assimilation scheme for the WRF-ARW ... - GOES-R

You also want an ePaper? Increase the reach of your titles
YUMPU automatically turns print PDFs into web optimized ePapers that Google loves.
A <strong>lightning</strong> <strong>data</strong> <strong>assimilation</strong> <strong>scheme</strong> <strong>for</strong><br />
<strong>the</strong> <strong>WRF</strong>-<strong>ARW</strong> model at cloud-resolving<br />
scales: Tropical Cyclone Erin (2007) and<br />
NSSL daily <strong>for</strong>ecast runs.<br />
Alexandre Olivier Fierro<br />
-CIMMS/NOAA- The University of Oklahoma-<br />
Collaborators: Ted Mansell, Don MacGorman, Conrad Ziegler-<br />
NSSL/NOAA and Ming Xue (CAPS)
Why using <strong>lightning</strong> <strong>data</strong> <strong>for</strong> NWP application?<br />
•Occurrence of <strong>lightning</strong> in convection is correlated to basic<br />
quantities that are often diagnosed in dynamical model.<br />
•Such quantities are: graupel mixing ratio, w, supercooled water<br />
supersaturation over ice and/or water among o<strong>the</strong>rs<br />
•Moreover, <strong>for</strong> tropical applications; observations suggest that<br />
hurricane eyewall total <strong>lightning</strong> flash rate is often accompanied by<br />
intensity fluctuations of <strong>the</strong> system (e.g., Molinari’s, Fierro et als.).<br />
RI<br />
Rita<br />
21 Sep 05 16:00-17:00 UTC<br />
Shao et al. (2006)
Scientific goals:<br />
•There<strong>for</strong>e a natural question to ask is:<br />
Can total <strong>lightning</strong> <strong>data</strong> (IC+CG) be used as a <strong>for</strong>ecast tool<br />
within NWP models to better predict convection in real time at<br />
cloud resolving scales (dx
23 April 2011 case<br />
Setup in a ‘flash’:<br />
•Domain covers portion of S. Plains (500x600 grid zones)<br />
•Dx=dy=2 km with 35 vertical levels<br />
•WSM 6 microphysics<br />
•NAM 40 km <strong>data</strong> used as initial conditions.<br />
•Run started at 00Z<br />
•WTLN total <strong>lightning</strong> <strong>data</strong> interpolated onto <strong>WRF</strong> grid in 10<br />
min intervals in <strong>the</strong> following set of 4 experiments<br />
(i)By directly interpolating <strong>the</strong> lat/lon WTLN <strong>data</strong> onto <strong>the</strong> 2 km domain<br />
grid (G2)<br />
(ii)By first interpolating <strong>the</strong> WTLN <strong>data</strong> onto <strong>the</strong> domain using an<br />
hypo<strong>the</strong>tical GEOS-R resolution of 10 km and <strong>the</strong>n extrapolate that 10<br />
km <strong>data</strong> onto <strong>the</strong> 2 km domain (G10).<br />
(iii)Then, in separate experiments, <strong>for</strong> G2 and G10, <strong>the</strong> <strong>lightning</strong> <strong>data</strong><br />
was nudged in during ei<strong>the</strong>r <strong>the</strong> first 1 hour or during <strong>the</strong> first 2 h of<br />
simulation after 00Z.
How is <strong>the</strong> <strong>lightning</strong> nudged into <strong>WRF</strong>?<br />
Because <strong>lightning</strong> flashes are generally associated with <strong>the</strong> presence of<br />
updrafts, whenever a flash (gridlight) was present in a I,J location, <strong>the</strong> layer<br />
between 0 and -30°C (representative of <strong>the</strong> mixed-phase graupel rich<br />
region of storms) was supersaturated w.r.t water as a function of flash rate<br />
as follows:<br />
q vapor = q sat +0.05*q sat *tanh(gridlight/30 )<br />
Interpolated flash rates<br />
G2<br />
G10
How are <strong>the</strong> WTLN flashes extrapolated from 10 km to 2 km grid?<br />
Flash count is assumed conserved and maximized at <strong>the</strong> center of<br />
<strong>the</strong> grid cell.
23 April: dBZ at 1 km AGL<br />
Obs<br />
0200Z 0400Z 0600Z<br />
CTRL<br />
CTRL run does not reproduce supercells at 02Z in <strong>the</strong> TX panhandle as well<br />
as <strong>the</strong> convection over <strong>the</strong> warm front in KS. Simulated squall line is also ill<br />
defined and located too far to <strong>the</strong> W.
23 April: 2 h <strong>assimilation</strong><br />
Obs<br />
CTRL<br />
G2<br />
0200Z<br />
As expected, early supercellular activity is more correctly resolved using <strong>lightning</strong>.
23 April: 2 h <strong>assimilation</strong><br />
G2<br />
0200Z 0400Z 0600Z<br />
G10<br />
For both again, early supercellular activity is more correctly resolved using <strong>lightning</strong>. Warm<br />
frontal convection in KS is also better represented. However, <strong>the</strong> squall line in W OK is per<br />
say inexistent and worst that in CTRL. Note also that both cases show a high degree of<br />
similarity Would GEOS-R resolution flash <strong>data</strong> (vs lat/lon) be sufficient <strong>for</strong> <strong>assimilation</strong>?
23 April: 1 h <strong>assimilation</strong><br />
G2<br />
0200Z 0400Z 0600Z<br />
G10<br />
Early supercellular activity is still well depicted as well as KS convection, although slightly<br />
weaker than obs (and than 2h <strong>assimilation</strong> runs). As be<strong>for</strong>e, squall line in W OK produced<br />
by merging of supercells is inexistent. Ra<strong>the</strong>r The convection in TX panhandle in all runs<br />
developed in <strong>the</strong> TX panhandle along a boundary (dry-line and/or cold front).
TC Erin: 1) Observations<br />
•Similar to Rita; TS Erin ‘eyewall’<br />
was lit up with <strong>lightning</strong> flashes<br />
during its intensification period.<br />
•LMA detected 8 times as many<br />
flashes as NLDN-<br />
•Topology of accumulated 12-h<br />
LMA+NLDN flashes starting at 00Z<br />
19 Aug used to ‘control’<br />
microphysics in <strong>WRF</strong> runs
Observations ctd…<br />
•Erin showed a welldefined<br />
closed circulation<br />
with an eye-like feature<br />
at 0900UTC, which was<br />
depicted by <strong>the</strong> LMA<br />
sources.<br />
•Source heights were<br />
seen as high as 18 km<br />
indicative of deep<br />
convection.<br />
•Reminiscent of<br />
convective heat<br />
axisymmetrization by hot<br />
towers in TC eyewalls.
<strong>WRF</strong> test runs<br />
if (q x<br />
b / air<br />
) <strong>the</strong>n q x<br />
max( q x<br />
,b/ air<br />
)<br />
where b is <strong>the</strong> mixing ratio threshold (0 <strong>for</strong> run QX0), =0.2, q x is <strong>the</strong> mixing<br />
ratio of hydrometeor class x<br />
<br />
Lightning assimilated in 10 min intervals throughout <strong>the</strong> simulation<br />
<strong>for</strong> all cases More of an analysis study ra<strong>the</strong>r than a <strong>for</strong>ecast-
Surface wind speed (m/s)<br />
Results<br />
•CTRL run<br />
produced strong<br />
squall line that<br />
eventually disrupt<br />
and ‘kill’ <strong>the</strong><br />
primary circulation<br />
of <strong>the</strong> vortex via<br />
<strong>the</strong> production of<br />
strong surface cold<br />
pools<br />
•NOMICRO case<br />
indicates that<br />
vortex<br />
intensification must<br />
involve moist<br />
convection in <strong>the</strong><br />
model as in real<br />
hurricanes-
Surface wind speed (m/s)<br />
•The three QX<br />
experiments, whereby<br />
<strong>the</strong> <strong>WRF</strong> convection<br />
is almost suppressed<br />
outside <strong>the</strong> <strong>lightning</strong><br />
area result in a welldefined<br />
TS-like<br />
circulation as in obs.<br />
• Convection in <strong>the</strong><br />
model had to be<br />
imposed a severe<br />
limit <strong>for</strong> <strong>the</strong> vortex to<br />
intensify.
Forecast test<br />
•Assimilating<br />
LMA+NLDN<br />
<strong>lightning</strong> <strong>data</strong><br />
<strong>for</strong> <strong>the</strong> first 6 h<br />
resulted in a<br />
better 2 h<br />
(=0800Z)<br />
<strong>for</strong>ecast<br />
compared to<br />
CTRL.
Questions?
LMA and NLDN networks in a nutshell<br />
•The OK LMA consists of a group of stations located near <strong>the</strong><br />
TLX radar, while NLDN covers CONUS evenly:<br />
Map of NLDN sensor locations and<br />
type (IMPACT - Improved Per<strong>for</strong>mance<br />
from Combined Technology; TOA -<br />
Time Of Arrival) <strong>for</strong> CONUS.<br />
Blue circle indicates a 60-km<br />
radius from KOUN and <strong>the</strong> peachshaded<br />
circle indicates a 75-km<br />
radius from <strong>the</strong> center of <strong>the</strong> LMA<br />
network. (Bruning et al. 07)
WTLN network<br />
•Wea<strong>the</strong>rBug Total Lightning Network is <strong>the</strong> world’s largest <strong>lightning</strong> detection<br />
network with detection efficiency ranging between 25-60% over CONUS.<br />
•Measure broadband electric field, from 1 Hz to 12 MHz<br />
•Incorporates advanced <strong>lightning</strong> location technology<br />
•The first network to detect both in-cloud (IC) and cloud-to-ground (CG) <strong>lightning</strong>.<br />
•More than 360 <strong>lightning</strong> sensors from around <strong>the</strong> globe making WTLN <strong>the</strong> world’s<br />
largest and fastest <strong>lightning</strong> detection network.<br />
http://earthnetworks.com/OurNetworks/LightningNetwork.aspx
Observations ctd…<br />
Deeper LMA sources on <strong>the</strong> SE of <strong>the</strong> center of circulation are<br />
coincident/consistent with deeper radar echoes (particularly 30-40 dBZ,<br />
KOUN OU polarimetric radar)
Erin: dBZ at 1 km AGL
Erin: <strong>the</strong>ta’ at <strong>the</strong> surface<br />
•CTRL run with<br />
unconstrained<br />
model produces<br />
strong cold<br />
pools near <strong>the</strong><br />
center of<br />
circulation of<br />
<strong>the</strong> vortex<br />
resulting in its<br />
weakening.
Erin: pre-convective sounding in SE quadrant