Onondaga Lake Fact Sheet - Onondaga Lake Partnership
Onondaga Lake Fact Sheet - Onondaga Lake Partnership
Onondaga Lake Fact Sheet - Onondaga Lake Partnership

You also want an ePaper? Increase the reach of your titles
YUMPU automatically turns print PDFs into web optimized ePapers that Google loves.
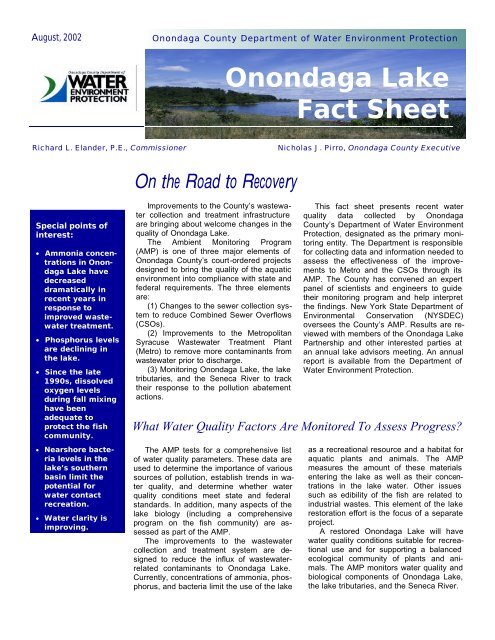
August, 2002<br />
<strong>Onondaga</strong> County Department of Water Environment Protection<br />
<strong>Onondaga</strong> <strong>Lake</strong><br />
<strong>Fact</strong> <strong>Sheet</strong><br />
Richard L. Elander, P.E., Commissioner<br />
Nicholas J. Pirro, <strong>Onondaga</strong> County Executive<br />
On the Road to Recovery<br />
Special points of<br />
interest:<br />
• Ammonia concentrations<br />
in <strong>Onondaga</strong><br />
<strong>Lake</strong> have<br />
decreased<br />
dramatically in<br />
recent years in<br />
response to<br />
improved wastewater<br />
treatment.<br />
• Phosphorus levels<br />
are declining in<br />
the lake.<br />
• Since the late<br />
1990s, dissolved<br />
oxygen levels<br />
during fall mixing<br />
have been<br />
adequate to<br />
protect the fish<br />
community.<br />
• Nearshore bacteria<br />
levels in the<br />
lake’s southern<br />
basin limit the<br />
potential for<br />
water contact<br />
recreation.<br />
• Water clarity is<br />
improving...<br />
Improvements to the County’s wastewater<br />
collection and treatment infrastructure<br />
are bringing about welcome changes in the<br />
quality of <strong>Onondaga</strong> <strong>Lake</strong>.<br />
The Ambient Monitoring Program<br />
(AMP) is one of three major elements of<br />
<strong>Onondaga</strong> County’s court-ordered projects<br />
designed to bring the quality of the aquatic<br />
environment into compliance with state and<br />
federal requirements. The three elements<br />
are:<br />
(1) Changes to the sewer collection system<br />
to reduce Combined Sewer Overflows<br />
(CSOs).<br />
(2) Improvements to the Metropolitan<br />
Syracuse Wastewater Treatment Plant<br />
(Metro) to remove more contaminants from<br />
wastewater prior to discharge.<br />
(3) Monitoring <strong>Onondaga</strong> <strong>Lake</strong>, the lake<br />
tributaries, and the Seneca River to track<br />
their response to the pollution abatement<br />
actions.<br />
This fact sheet presents recent water<br />
quality data collected by <strong>Onondaga</strong><br />
County’s Department of Water Environment<br />
Protection, designated as the primary monitoring<br />
entity. The Department is responsible<br />
for collecting data and information needed to<br />
assess the effectiveness of the improvements<br />
to Metro and the CSOs through its<br />
AMP. The County has convened an expert<br />
panel of scientists and engineers to guide<br />
their monitoring program and help interpret<br />
the findings. New York State Department of<br />
Environmental Conservation (NYSDEC)<br />
oversees the County’s AMP. Results are reviewed<br />
with members of the <strong>Onondaga</strong> <strong>Lake</strong><br />
<strong>Partnership</strong> and other interested parties at<br />
an annual lake advisors meeting. An annual<br />
report is available from the Department of<br />
Water Environment Protection.<br />
What Water Quality <strong>Fact</strong>ors Are Monitored To Assess Progress?<br />
The AMP tests for a comprehensive list<br />
of water quality parameters. These data are<br />
used to determine the importance of various<br />
sources of pollution, establish trends in water<br />
quality, and determine whether water<br />
quality conditions meet state and federal<br />
standards. In addition, many aspects of the<br />
lake biology (including a comprehensive<br />
program on the fish community) are assessed<br />
as part of the AMP.<br />
The improvements to the wastewater<br />
collection and treatment system are designed<br />
to reduce the influx of wastewaterrelated<br />
contaminants to <strong>Onondaga</strong> <strong>Lake</strong>.<br />
Currently, concentrations of ammonia, phosphorus,<br />
and bacteria limit the use of the lake<br />
as a recreational resource and a habitat for<br />
aquatic plants and animals. The AMP<br />
measures the amount of these materials<br />
entering the lake as well as their concentrations<br />
in the lake water. Other issues<br />
such as edibility of the fish are related to<br />
industrial wastes. This element of the lake<br />
restoration effort is the focus of a separate<br />
project.<br />
A restored <strong>Onondaga</strong> <strong>Lake</strong> will have<br />
water quality conditions suitable for recreational<br />
use and for supporting a balanced<br />
ecological community of plants and animals.<br />
The AMP monitors water quality and<br />
biological components of <strong>Onondaga</strong> <strong>Lake</strong>,<br />
the lake tributaries, and the Seneca River.
Page 2<br />
<strong>Onondaga</strong> <strong>Lake</strong> <strong>Fact</strong> <strong>Sheet</strong><br />
Ammonia<br />
Ammonia-N, mg/l<br />
3<br />
2.5<br />
2<br />
1.5<br />
1<br />
0.5<br />
0<br />
Figure 1<br />
Ammonia Levels in <strong>Onondaga</strong> <strong>Lake</strong><br />
Upper waters,<br />
annual average<br />
88 89 90 91 92 93 94 95 96 97 98 99 00 01<br />
The columns of Figure 1 display the average ammonia<br />
nitrogen (NH3-N) concentrations in <strong>Onondaga</strong> <strong>Lake</strong>’s<br />
upper waters measured in recent years. Throughout the<br />
1990s, concentrations of ammonia in the lake water exceeded<br />
the state’s water quality standard designed to<br />
protect sensitive aquatic life. Because Metro contributes<br />
more than 90% of the ammonia influx, reductions in ammonia<br />
in the wastewater effluent are quickly evident in<br />
the lake. The dramatic reduction in ammonia levels in recent<br />
years is the direct result of engineering improvements<br />
at Metro. Reductions in ammonia loading from<br />
Metro are displayed in Figure 2.<br />
Metro effluent quality also depends on the quality of<br />
wastewater entering the treatment plant. <strong>Onondaga</strong><br />
County is working with local industries, particularly Bristol<br />
Myers Squibb, to reduce ammonia in wastewater before it<br />
reaches the treatment plant. Some of the reductions that<br />
have been achieved are a result of the controls on the<br />
industrial sources.<br />
As shown in Figure 3, ammonia concentrations in the<br />
lake’s upper waters are improving with respect to compliance<br />
with standards designed to protect sensitive aquatic<br />
life. However, slight exceedences of safe levels remain,<br />
particularly early in the spring, a critical period for fish<br />
spawning activity. This pattern is a result of the challenges<br />
associated with achieving consistent nitrification<br />
(conversion of ammonia to the nontoxic form nitrate nitrogen)<br />
when wastewater temperatures are cool in winter.<br />
The biological process is extremely sensitive to temperature.<br />
Days<br />
300<br />
250<br />
200<br />
150<br />
100<br />
50<br />
Figure 3<br />
Days of Violation of Ammonia Standard<br />
<strong>Onondaga</strong> <strong>Lake</strong> Upper Waters<br />
Figure 2<br />
Metro Ammonia Discharge<br />
0<br />
88 89 90 91 92 93 94 95 96 97 98 99 00 01<br />
Year<br />
10000<br />
Pounds per day<br />
8000<br />
6000<br />
4000<br />
2000<br />
0<br />
88 89 90 91 92 93 94 95 96 97 98 99 00 01<br />
Year<br />
Greater reductions in ammonia levels are anticipated<br />
with completion of the ammonia phosphorus project now<br />
under construction at Metro. Year-round nitrification will<br />
be achieved and full compliance with standards is projected.<br />
New York State Department of Environmental<br />
Conservation has established strict limits on ammonia<br />
levels in Metro effluent. Phased effluent limits are in<br />
place, with compliance milestones in 2004 and 2012. The<br />
County is projected to meet the 2012 required ammonia<br />
limits by 2004, eight years ahead of schedule.
<strong>Onondaga</strong> <strong>Lake</strong> <strong>Fact</strong> <strong>Sheet</strong><br />
Page 3<br />
Phosphorus and Dissolved Oxygen<br />
Phosphorus is naturally present in all waters and is an<br />
essential nutrient for life. In most Northeastern lakes, including<br />
<strong>Onondaga</strong> <strong>Lake</strong>, phosphorus is the limiting nutrient<br />
for algal growth. Because it is the limiting nutrient, the concentration<br />
of phosphorus in lake water is correlated with<br />
abundance of algae. Excessive algae will make a lake appear<br />
turbid or green and diminish its attractiveness for recreational<br />
use.<br />
Algal cells eventually sink into deep water and are decomposed.<br />
Dissolved oxygen, a basic requirement for fish<br />
and other aquatic life, is depleted as these algal cells decay.<br />
The deep waters of <strong>Onondaga</strong> <strong>Lake</strong> become anoxic<br />
(no oxygen present) by mid summer as a result of the large<br />
masses of decaying algae. When the lake waters cool and<br />
mix in the fall, this deep layer of anoxic water mixes<br />
through the lake and depresses lakewide oxygen levels.<br />
Fish may seek refuge in areas with higher dissolved oxygen<br />
or swim into the Seneca River to find suitable water<br />
quality conditions.<br />
Because of these factors, phosphorus is an important<br />
factor in restoring the lake’s recreational use and aquatic<br />
habitat. New York State has adopted a statewide guidance<br />
value for phosphorus of 20 micrograms per liter (a unit of<br />
measure equivalent to parts per billion). As shown in Figure<br />
4, phosphorus levels are declining in the lake but remain<br />
above the guidance value.<br />
Summer Average Upper Waters<br />
TP, ug/l<br />
200<br />
150<br />
100<br />
50<br />
Figure 4<br />
Summer Phosphorus Levels<br />
in <strong>Onondaga</strong> <strong>Lake</strong><br />
Guidance value, 20 µg/l<br />
0<br />
1984 1986 1988 1990 1992 1994 1996 1998 2000 2002<br />
Slightly more than half of the phosphorus entering the<br />
lake comes from Metro; the other half is contributed by runoff<br />
from urban and agricultural areas. Since the late 1980s,<br />
the County has made many operational changes at Metro<br />
to reduce phosphorus levels in the treated wastewater. Figure<br />
5 charts the reduction in phosphorus output from Metro.<br />
The high value in 1993 was due to construction at the<br />
treatment plant and spring floods. Additional reductions<br />
will be achieved with completion of the ammonia phosphorus<br />
project now under construction at Metro.<br />
Pounds per day<br />
1200<br />
1000<br />
800<br />
600<br />
400<br />
200<br />
0<br />
Figure 5<br />
Metro Phosphorus Discharge<br />
86 87 88 89 90 91 92 93 94 95 96 97 98 99 00 01<br />
Year<br />
Dissolved oxygen levels in <strong>Onondaga</strong> <strong>Lake</strong> are improving<br />
as well (Figure 6). In the past several years,<br />
oxygen levels in the fall have been adequate to protect<br />
the fish community. This change represents real progress<br />
towards attaining water quality conditions that will<br />
support a balanced ecological community.<br />
Minimum DO (mg/l)<br />
7<br />
6<br />
5<br />
4<br />
3<br />
2<br />
1<br />
0<br />
Figure 6<br />
Minimum Dissolved Oxygen Concentrations<br />
<strong>Onondaga</strong> <strong>Lake</strong> During Fall Mixing<br />
Minimum standard: 5 mg/l<br />
88 89 90 91 92 93 94 95 96 97 98 99 00 01<br />
Year
Page 4<br />
<strong>Onondaga</strong> <strong>Lake</strong> <strong>Fact</strong> <strong>Sheet</strong><br />
Water Clarity and Bacteria<br />
Depth (m)<br />
0<br />
0.5<br />
1<br />
1.5<br />
2<br />
2.5<br />
3<br />
3.5<br />
Figure 7<br />
<strong>Onondaga</strong> <strong>Lake</strong> Average Summer Water<br />
Clarity<br />
86 87 88 89 90 91 92 93 94 95 96 97 98 99 00 01<br />
Swimming Safety Guidance 1.2 m (4 ft)<br />
For <strong>Onondaga</strong> <strong>Lake</strong> to<br />
be attractive and safe for<br />
water contact recreation,<br />
the water must be clear and<br />
free of disease-causing microorganisms.<br />
As described<br />
earlier, water clarity is related<br />
to algae and phosphorus<br />
levels. Microbiological<br />
quality is primarily related to<br />
the combined sewer overflows<br />
and urban stormwater<br />
runoff.<br />
Water clarity in the lake<br />
has improved in recent<br />
years in response to reductions<br />
in phosphorus and the<br />
shifts in the food web related<br />
to the successful invasion of the zebra mussel (Figure 7). However, algal blooms persist and limit the lake’s attractiveness<br />
for recreational use.<br />
Microbiological quality is assessed by monitoring for<br />
the abundance of “indicator organisms”, bacteria that are<br />
associated with recent fecal contamination. Results of the<br />
2001 nearshore bacteria monitoring effort are displayed in<br />
Figure 8. The southern end of <strong>Onondaga</strong> <strong>Lake</strong> has unacceptably<br />
high levels of indicator bacteria following storms<br />
and does not support water contact recreation. This finding<br />
highlights the need for continued progress with the CSO<br />
projects.<br />
However, bacteria levels decrease greatly as one proceeds<br />
away from the southern tributaries. Water quality in<br />
Willow Bay, Maple Bay, and <strong>Onondaga</strong> <strong>Lake</strong> Park shows<br />
very few violations of bacteria standards for safe swimming.<br />
The County will continue to monitor nearshore areas<br />
around the lake shoreline to assess progress towards<br />
meeting the goal for safe swimming.<br />
<strong>Onondaga</strong> County Department of<br />
Water Environment Protection<br />
650 Hiawatha Blvd West<br />
Syracuse, NY 13204-1194<br />
Phone: 315-435-2260<br />
Fax: 315-435-5023<br />
Visit our Web site:<br />
www.ongov.net<br />
Summary and a Look Ahead<br />
Real progress has been made in <strong>Onondaga</strong> <strong>Lake</strong> towards<br />
the goal of attaining water quality conditions that<br />
support recreational use and aquatic life. The Ambient<br />
Monitoring Program will continue to track key indicators as<br />
the improvements to Metro and the CSOs are completed.<br />
For more information call Joe Mastriano,<br />
Operations Manager, at (315) 435-2260.