The Population Ecology of Wild Horses in the Australian Alps
The Population Ecology of Wild Horses in the Australian Alps
The Population Ecology of Wild Horses in the Australian Alps

Create successful ePaper yourself
Turn your PDF publications into a flip-book with our unique Google optimized e-Paper software.
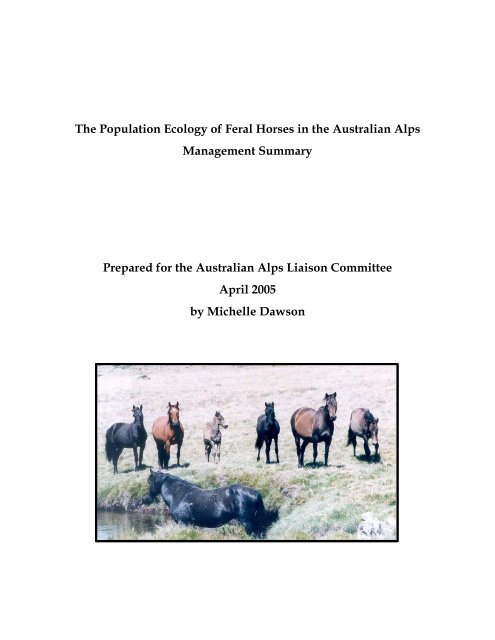
<strong>The</strong> <strong>Population</strong> <strong>Ecology</strong> <strong>of</strong> Feral <strong>Horses</strong> <strong>in</strong> <strong>the</strong> <strong>Australian</strong> <strong>Alps</strong><br />
Management Summary<br />
Prepared for <strong>the</strong> <strong>Australian</strong> <strong>Alps</strong> Liaison Committee<br />
April 2005<br />
by Michelle Dawson
Contents<br />
Introduction 2<br />
Distribution 3<br />
Abundance 6<br />
<strong>Population</strong> dynamics 8<br />
Brumby-runn<strong>in</strong>g 11<br />
Key management messages 13<br />
References 14<br />
Introduction<br />
From 1999-2002 I studied <strong>the</strong> population ecology <strong>of</strong> wild (feral) horses <strong>in</strong> <strong>the</strong> <strong>Australian</strong><br />
<strong>Alps</strong> for my Doctorate through <strong>the</strong> Applied <strong>Ecology</strong> Research Group, University <strong>of</strong><br />
Canberra (under my maiden name ‘Walter’). <strong>The</strong> <strong>Australian</strong> <strong>Alps</strong> Liaison Committee<br />
(AALC) funded most <strong>of</strong> <strong>the</strong> field work and many parks staff from across <strong>the</strong> <strong>Alps</strong> were<br />
<strong>in</strong>volved. In 2005, <strong>the</strong> AALC commissioned me to summarise my <strong>the</strong>sis <strong>in</strong>to a version<br />
suitable for park managers and this is <strong>the</strong> result. It provides a syn<strong>the</strong>sis <strong>of</strong> <strong>the</strong> work and<br />
its key f<strong>in</strong>d<strong>in</strong>gs. If people are after details <strong>of</strong> any component <strong>of</strong> <strong>the</strong> research, I refer <strong>the</strong>m<br />
to <strong>the</strong> <strong>the</strong>sis and o<strong>the</strong>r references mentioned <strong>in</strong> <strong>the</strong> text. <strong>The</strong>re have been numerous<br />
developments <strong>in</strong> wild horse management s<strong>in</strong>ce 2002, as well as a very large fire. I have<br />
not dealt with <strong>the</strong>m here.<br />
This study was <strong>the</strong> first <strong>of</strong> its k<strong>in</strong>d <strong>in</strong> <strong>the</strong> <strong>Australian</strong> <strong>Alps</strong>, and <strong>the</strong>refore has a broad<br />
focus. It stemmed from a need to improve our understand<strong>in</strong>g <strong>of</strong> this controversial<br />
species and aims to provide <strong>in</strong>terested parties with <strong>in</strong>formation to determ<strong>in</strong>e <strong>the</strong> best<br />
approach to management. It also contributes to broader knowledge on survey<br />
techniques for large mammals and horse population dynamics <strong>in</strong> general and exam<strong>in</strong>es<br />
brumby-runn<strong>in</strong>g for <strong>the</strong> first time. <strong>The</strong> only previous study <strong>of</strong> wild horses <strong>in</strong> <strong>the</strong><br />
<strong>Australian</strong> <strong>Alps</strong> was on <strong>the</strong>ir impact <strong>in</strong> sub-alp<strong>in</strong>e and montane environments (Dyr<strong>in</strong>g<br />
1990).<br />
<strong>Horses</strong> were first <strong>in</strong>troduced <strong>in</strong>to Australia <strong>in</strong> 1788 (Dobbie et al. 1993). <strong>The</strong>y adapted<br />
well to conditions and numbers rose rapidly. Between 1830 and 1850 <strong>the</strong>y <strong>in</strong>creased<br />
from an estimated 14 000 to 160 000 largely by natural <strong>in</strong>crease and were first recognised<br />
as feral pests <strong>in</strong> Australia <strong>in</strong> <strong>the</strong> 1860’s. Australia has <strong>the</strong> highest number <strong>of</strong> wild horses<br />
<strong>in</strong> <strong>the</strong> world (Dobbie et al. 1993). <strong>The</strong>y occur mostly <strong>in</strong> remote, usually rugged, semi-arid<br />
areas. <strong>The</strong> largest populations are on unfenced pastoral country <strong>in</strong> <strong>the</strong> Nor<strong>the</strong>rn<br />
Territory and Queensland. <strong>The</strong> major concentration <strong>of</strong> wild horses <strong>in</strong> New South Wales<br />
and Victoria are found <strong>in</strong> <strong>the</strong> <strong>Australian</strong> <strong>Alps</strong> (Dobbie et al. 1993).<br />
<strong>Wild</strong> horses are an <strong>in</strong>troduced species <strong>in</strong> <strong>the</strong> <strong>Australian</strong> <strong>Alps</strong>. <strong>The</strong>y are a large and hardho<strong>of</strong>ed<br />
animal occupy<strong>in</strong>g an environment that evolved without similar species. <strong>The</strong>re is<br />
concern that <strong>the</strong>y have a negative impact on <strong>the</strong> <strong>Alps</strong> environment. <strong>Wild</strong> horses were<br />
2
seen to be a problem dur<strong>in</strong>g last century (Helms 1890 <strong>in</strong> Dyr<strong>in</strong>g 1990) and many<br />
scientists (Cost<strong>in</strong> 1954, Walters & Hallam 1992, Dobbie et al. 1993, Green & Osborne<br />
1994) have expressed concern about <strong>the</strong> threat <strong>of</strong> <strong>in</strong>creas<strong>in</strong>g numbers <strong>of</strong> wild horses to<br />
environmental values <strong>of</strong> <strong>the</strong> <strong>Alps</strong>. In <strong>the</strong> <strong>Australian</strong> <strong>Alps</strong>, Dyr<strong>in</strong>g (1990) identified track<br />
formation, soil compaction, change <strong>in</strong> vegetation structure and streambank disturbance<br />
as impacts <strong>of</strong> wild horses on sub-alp<strong>in</strong>e and montane environments.<br />
<strong>The</strong>re is a considerable amount <strong>of</strong> folklore associated with wild horses <strong>in</strong> <strong>the</strong> <strong>Australian</strong><br />
<strong>Alps</strong> and many people see <strong>the</strong>m as hav<strong>in</strong>g cultural value. <strong>The</strong>y even feature on <strong>the</strong><br />
<strong>Australian</strong> ten dollar note. <strong>The</strong>se contradictory views <strong>of</strong> wild horses will always make<br />
<strong>the</strong>m a sensitive management issue. <strong>The</strong> aim <strong>of</strong> this research is to provide people with<br />
<strong>in</strong>formation so that we can better understand wild horses and how <strong>the</strong>y are <strong>in</strong>teract<strong>in</strong>g<br />
with <strong>the</strong> <strong>Alps</strong> environment with <strong>the</strong> hope <strong>of</strong> aid<strong>in</strong>g more effective management.<br />
Improv<strong>in</strong>g our understand<strong>in</strong>g <strong>of</strong> wild horses <strong>in</strong> <strong>the</strong> <strong>Australian</strong> <strong>Alps</strong> national parks has<br />
been on <strong>the</strong> agenda for some time. In 1992, a review <strong>of</strong> wild horses <strong>in</strong> <strong>the</strong> <strong>Australian</strong><br />
<strong>Alps</strong> national parks recommended that an action plan for feral horses be developed and<br />
implemented at <strong>the</strong> earliest opportunity (Walters & Hallam 1992). <strong>The</strong> action plan was<br />
to be preceded by two key studies: 1) a study <strong>of</strong> wild horse demography and <strong>the</strong>ir<br />
ecology, and 2) a study <strong>of</strong> wild horse impact on vegetation communities and <strong>the</strong><br />
environment <strong>of</strong> <strong>the</strong> <strong>Australian</strong> <strong>Alps</strong> national parks. This study addressed <strong>the</strong> first po<strong>in</strong>t.<br />
Distribution<br />
Keep<strong>in</strong>g track <strong>of</strong> <strong>the</strong> distribution <strong>of</strong> wild horses over time helps us to monitor <strong>the</strong> effect<br />
<strong>of</strong> control programs (or no control) and environmental events such as severe w<strong>in</strong>ters or<br />
fire. We can learn from past changes <strong>in</strong> distribution and its causes, and will assist future<br />
land managers by keep<strong>in</strong>g records <strong>of</strong> changes <strong>in</strong> distribution especially <strong>in</strong> response to<br />
control programs. In this section I present a revised distribution map <strong>of</strong> wild horses <strong>in</strong><br />
<strong>the</strong> <strong>Australian</strong> <strong>Alps</strong> national parks and discuss reasons for current and historical<br />
distribution.<br />
Dyr<strong>in</strong>g (1990) produced a distribution map <strong>of</strong> wild horses <strong>in</strong> <strong>the</strong> <strong>Australian</strong> <strong>Alps</strong>. <strong>The</strong><br />
ma<strong>in</strong> features <strong>of</strong> her maps were: 1) <strong>the</strong> absence <strong>of</strong> horses <strong>in</strong> <strong>the</strong> ACT, 2) small isolated<br />
populations <strong>in</strong> nor<strong>the</strong>rn Kosciuszko at Peppercorn, <strong>Wild</strong> Horse and Nungar Pla<strong>in</strong>s, and<br />
<strong>in</strong> nearby Bago and Maragle State Forests, 3) a small population at Bo<strong>the</strong>rum Pla<strong>in</strong> near<br />
Lake J<strong>in</strong>dabyne, 4) a large cont<strong>in</strong>uous population south <strong>of</strong> Thredbo River extend<strong>in</strong>g<br />
through sou<strong>the</strong>rn Kosciuszko to <strong>the</strong> Victorian border, 5) a cont<strong>in</strong>uation <strong>of</strong> <strong>the</strong> same<br />
population <strong>in</strong> Victoria, <strong>in</strong> <strong>the</strong> Cobberas-T<strong>in</strong>gar<strong>in</strong>gy National Park (now part <strong>of</strong> <strong>the</strong><br />
Alp<strong>in</strong>e National Park), and 6) a population on <strong>the</strong> Bogong High Pla<strong>in</strong>s near Omeo and<br />
smaller populations at Mount Willis (west <strong>of</strong> Lake Dartmouth) and on <strong>the</strong> Moroka and<br />
Caledonia Rivers.<br />
I revised <strong>the</strong> wild horse distribution maps between 1999-2002 by searched NSW and<br />
Victorian wildlife atlases, hold<strong>in</strong>g discussions with local managers and park users to<br />
determ<strong>in</strong>e current boundaries and factors <strong>in</strong>fluenc<strong>in</strong>g past distribution, and visit<strong>in</strong>g a lot<br />
<strong>of</strong> <strong>the</strong> range. <strong>Wild</strong> horses are found <strong>in</strong> Kosciuszko National Park, NSW (Figure 1) and<br />
3
<strong>the</strong> Alp<strong>in</strong>e National Park, Victoria (Figure 2) and were present on <strong>the</strong> border <strong>of</strong> <strong>the</strong><br />
<strong>Australian</strong> Capital Territory.<br />
<strong>The</strong> maximum observed rate <strong>of</strong> spread <strong>of</strong> wild horses <strong>in</strong> <strong>the</strong> <strong>Australian</strong> <strong>Alps</strong> between<br />
Dyr<strong>in</strong>g’s (1990) study and <strong>the</strong> maps presented here is remarkably low (< 4 km per year).<br />
<strong>The</strong> areas where <strong>the</strong>y appear to have spread is <strong>in</strong> nor<strong>the</strong>rn Kosciuszko National Park,<br />
and <strong>in</strong>to alp<strong>in</strong>e areas near Mount Kosciuszko. <strong>The</strong>y now do not occupy <strong>the</strong> full extent <strong>of</strong><br />
<strong>the</strong>ir potential range (for example <strong>the</strong>y used to be present <strong>in</strong> Namadgi National Park,<br />
ACT). <strong>Horses</strong> are adaptable to a wide range <strong>of</strong> environments, and are present from <strong>the</strong><br />
highest to lowest elevations <strong>in</strong> <strong>the</strong> <strong>Australian</strong> <strong>Alps</strong> so <strong>the</strong>y have <strong>the</strong> potential to have a<br />
much greater distribution than at present.<br />
Figure 1: Distribution <strong>of</strong> wild horses <strong>in</strong> Kosciuszko National Park. Map produced<br />
courtesy <strong>of</strong> NSW NPWS.<br />
4
Humans appear to be <strong>the</strong> most important factor <strong>in</strong>fluenc<strong>in</strong>g wild horse distribution. <strong>The</strong><br />
presence <strong>of</strong> horses <strong>in</strong> an area can usually be traced back to an <strong>in</strong>troduction event, and<br />
control efforts have removed <strong>the</strong>m or reduced <strong>the</strong>ir range. O<strong>the</strong>r factors that appear to<br />
<strong>in</strong>fluence wild horse distribution <strong>in</strong>clude geographical barriers, severe snow events,<br />
drought and possibly behaviour.<br />
Figure 2: Distribution <strong>of</strong> wild horses <strong>in</strong> <strong>the</strong> Alp<strong>in</strong>e National Park, Victoria. Map<br />
produced courtesy <strong>of</strong> <strong>the</strong> Department <strong>of</strong> Natural Resources and Environment. Refer to<br />
Figure 1 for legend.<br />
Graziers controlled <strong>the</strong> distribution <strong>of</strong> wild horses <strong>in</strong> much <strong>of</strong> <strong>the</strong> <strong>Australian</strong> <strong>Alps</strong> from<br />
<strong>the</strong> mid-1800s to as late as <strong>the</strong> 1960s. Different graziers had different approaches to wild<br />
horses; some eradicated <strong>the</strong>m locally and o<strong>the</strong>rs were responsible for <strong>the</strong>ir release <strong>in</strong>to<br />
new areas. With <strong>the</strong> area subsequently reserved as national parks humans cont<strong>in</strong>ue to<br />
<strong>in</strong>fluence wild horse distribution. For example wild horses were successfully eradicated<br />
from Namadgi National Park <strong>in</strong> <strong>the</strong> 1980s (Higg<strong>in</strong>s 1994). However no management<br />
action appears to contribute to <strong>the</strong> spread <strong>of</strong> horses, as do <strong>the</strong> occasional illegal<br />
re<strong>in</strong>troduction. (small populations (less than 10 animals) are less likely to establish after<br />
<strong>in</strong>troduction than larger ones).<br />
Barriers <strong>of</strong> dense vegetation and steep slopes appear to prevent horses from colonis<strong>in</strong>g<br />
new areas <strong>in</strong> <strong>the</strong> short term. <strong>The</strong> question <strong>in</strong> <strong>the</strong>se cases is whe<strong>the</strong>r horses will<br />
eventually overcome <strong>the</strong>se barriers. <strong>The</strong> effectiveness <strong>of</strong> a barrier will depend on <strong>the</strong><br />
form <strong>of</strong> <strong>the</strong> barrier and <strong>the</strong> pressure on it from <strong>the</strong> wild horse population.<br />
Heavy snow events can cause mortality <strong>of</strong> wild horses. <strong>The</strong>se events appear to be rare<br />
and only affect populations at higher elevations. For example, wild horses <strong>in</strong> <strong>the</strong> ACT<br />
suffered a large reduction <strong>in</strong> numbers <strong>in</strong> <strong>the</strong> early 1960s due to heavy snowfalls (Higg<strong>in</strong>s<br />
5
1994). In <strong>the</strong> longer-term, heavy snow events may become less frequent if global<br />
warm<strong>in</strong>g raises mean temperatures <strong>in</strong> <strong>the</strong> <strong>Australian</strong> <strong>Alps</strong> (Whetton 1998). Such<br />
changes may facilitate <strong>the</strong> expansion <strong>of</strong> <strong>the</strong> distribution <strong>of</strong> wild horses.<br />
Drought <strong>in</strong>fluences <strong>the</strong> distribution <strong>of</strong> wild horses <strong>in</strong> <strong>the</strong> ra<strong>in</strong>shadow area on <strong>the</strong> eastern<br />
side <strong>of</strong> <strong>the</strong> <strong>Australian</strong> <strong>Alps</strong> south <strong>of</strong> J<strong>in</strong>dabyne. <strong>The</strong>re is very little water available <strong>in</strong> this<br />
environment <strong>in</strong> contrast to <strong>the</strong> rest <strong>of</strong> <strong>the</strong> <strong>Alps</strong> where water is freely available. In 1982-<br />
83 drought killed <strong>of</strong>f most <strong>of</strong> <strong>the</strong> horses <strong>in</strong> <strong>the</strong> area and kangaroo, wallaby and rabbit<br />
populations also suffered massive losses.<br />
<strong>The</strong> potential <strong>of</strong> behaviour to limit <strong>the</strong> distribution <strong>of</strong> wild horses is difficult to assess.<br />
<strong>The</strong>y are highly social animals and <strong>the</strong>re is a general belief that <strong>the</strong>y are strongly tied to<br />
<strong>the</strong>ir home range. Behaviour, environmental events (e.g. drought, snow, fire) and o<strong>the</strong>r<br />
species (eg wild dogs) may have acted <strong>in</strong> conjunction with humans to restrict <strong>the</strong><br />
expansion <strong>in</strong> range <strong>of</strong> wild horses by keep<strong>in</strong>g <strong>the</strong>m below a threshold density. If wild<br />
horses are similar to wood bison <strong>in</strong> that <strong>the</strong>y are pulse dispersers, <strong>the</strong>y must reach a<br />
threshold density before <strong>the</strong>y disperse and colonise a new area.<br />
It will be <strong>in</strong>terest<strong>in</strong>g to see <strong>the</strong> patterns <strong>of</strong> wild horse distribution <strong>in</strong> <strong>the</strong> <strong>Australian</strong> <strong>Alps</strong><br />
<strong>in</strong> <strong>the</strong> future. It is likely to depend heavily on <strong>the</strong> approach to management. If <strong>the</strong>y are<br />
not actively managed <strong>the</strong>y may disperse <strong>in</strong>to new areas. Alternatively, management<br />
may result <strong>in</strong> a range reduction. <strong>The</strong> low rate <strong>of</strong> spread <strong>of</strong> wild horses <strong>in</strong> <strong>the</strong> <strong>Australian</strong><br />
<strong>Alps</strong> should make <strong>the</strong>m relatively easy to manage compared to o<strong>the</strong>r <strong>in</strong>troduced species<br />
such as <strong>the</strong> European rabbit which spread at 64km per year (Caughley 1977).<br />
Abundance<br />
<strong>The</strong> goals <strong>of</strong> manag<strong>in</strong>g wild animal populations are usually expressed <strong>in</strong> terms <strong>of</strong><br />
population size. For endangered species, managers try to <strong>in</strong>crease population size, for<br />
pest species <strong>the</strong>y try to reduce population size and for harvested populations <strong>the</strong>y try to<br />
ma<strong>in</strong>ta<strong>in</strong> a population size to optimise harvest. <strong>Population</strong> estimates are particularly<br />
useful if <strong>the</strong>y are repeated through time. <strong>Population</strong> trend data is useful for assess<strong>in</strong>g<br />
<strong>the</strong> success <strong>of</strong> management actions or response <strong>of</strong> <strong>the</strong> population to natural events. I<br />
used aerial survey to estimate <strong>the</strong> size <strong>of</strong> <strong>the</strong> wild horse population <strong>in</strong> <strong>the</strong> <strong>Australian</strong><br />
<strong>Alps</strong> national parks <strong>in</strong> 2001. I repeated this survey <strong>in</strong> 2003 after <strong>the</strong> fires (refer to Walter<br />
2003 for details).<br />
Despite <strong>the</strong> obvious advantages <strong>of</strong> us<strong>in</strong>g aerial survey to estimate abundance and<br />
density <strong>of</strong> animals, it has many shortcom<strong>in</strong>gs. One <strong>of</strong> <strong>the</strong> challenges is to improve<br />
accuracy, which is a measure <strong>of</strong> how close a population estimate is to true population<br />
size. Undercount<strong>in</strong>g is <strong>the</strong> rule <strong>in</strong> aerial surveys, so results usually are negatively<br />
biased. Some <strong>of</strong> <strong>the</strong> ma<strong>in</strong> factors contribut<strong>in</strong>g to bias are vegetation cover, species be<strong>in</strong>g<br />
surveyed, survey specifications (e.g. height above ground, speed, strip width), wea<strong>the</strong>r<br />
conditions and observer experience. <strong>The</strong>re are several analysis techniques frequently<br />
used for aerial survey <strong>in</strong>clud<strong>in</strong>g strip surveys (used extensively <strong>in</strong> kangaroo surveys),<br />
mark-recapture models (used on emus and mule deer), and l<strong>in</strong>e transect models (a<br />
newer technique which is prov<strong>in</strong>g to be very useful). In this study I used all three<br />
6
methods simultaneously and assessed <strong>the</strong> best method. For full details, refer to Walter<br />
and Hone (2003).<br />
<strong>The</strong> area surveyed follows <strong>the</strong> distribution maps presented <strong>in</strong> Figures 1 and 2 and are<br />
summarised <strong>in</strong> Table 1. It excluded <strong>the</strong> area adjacent to Talb<strong>in</strong>go Reservoir and east <strong>of</strong><br />
<strong>the</strong> Snowy River <strong>in</strong> Byadbo as <strong>the</strong>se areas were considered to be too rugged and<br />
population densities too low to provide accurate estimates.<br />
Table 1: Regions surveyed <strong>in</strong> <strong>the</strong> <strong>Australian</strong> <strong>Alps</strong> national parks dur<strong>in</strong>g <strong>the</strong> wild horse<br />
aerial survey <strong>in</strong> 2001.<br />
Region Area (km2) No. <strong>of</strong> transects Total transect length (km)<br />
North Kosciuszko 795 25 412<br />
Snowy Pla<strong>in</strong> 77 6 42<br />
South Kosciuszko 758 22 379<br />
North Victoria 1069 30 587<br />
Bogong High Pla<strong>in</strong>s 90 8 54<br />
TOTAL 2789 91 1474<br />
<strong>The</strong> average size <strong>of</strong> groups observed from <strong>the</strong> air was 4.91 (± 0.61 SE, n = 34) and 3.79 (±<br />
0.57 SE, n = 4) for observer 1 and 2 respectively. This is <strong>in</strong> contrast to <strong>the</strong> group size<br />
observed from ground surveys done as part <strong>of</strong> <strong>the</strong> population dynamics study (below)<br />
<strong>of</strong> 5.65 (± 0.51 SE, n = 34). <strong>The</strong> smaller group sizes observed from <strong>the</strong> air is probably a<br />
result <strong>of</strong> not see<strong>in</strong>g all <strong>in</strong>dividuals <strong>in</strong> a group from <strong>the</strong> air. Two observers were used <strong>in</strong><br />
<strong>the</strong> aircraft to improve <strong>the</strong> accuracy <strong>of</strong> estimates. Interest<strong>in</strong>gly, observer 2 saw more<br />
s<strong>in</strong>gletons and pairs than observer 1.<br />
We found that <strong>the</strong> number <strong>of</strong> horses sighted dropped rapidly with <strong>in</strong>creas<strong>in</strong>g distance<br />
from <strong>the</strong> aircraft. This meant that strip and mark-recapture estimates resulted <strong>in</strong> an<br />
underestimate <strong>of</strong> abundance. We cannot know what <strong>the</strong> most accurate survey method is<br />
because true population size was not known. However <strong>the</strong> l<strong>in</strong>e transect analysis for both<br />
observers comb<strong>in</strong>ed appears to account for bias <strong>the</strong> most effectively. It also gave a<br />
higher level <strong>of</strong> precision.<br />
<strong>Population</strong> estimates us<strong>in</strong>g <strong>the</strong> l<strong>in</strong>e transect method equated to 1.86 horses per km 2 and<br />
a population estimate <strong>of</strong> 5200 horses (coefficient <strong>of</strong> variation = 31%) (Walter and Hone<br />
2003). <strong>The</strong> average density <strong>of</strong> wild horses across <strong>the</strong> entire <strong>Australian</strong> <strong>Alps</strong> national<br />
parks would be lower than <strong>the</strong> survey estimates because areas where <strong>the</strong>re were no<br />
horses present and <strong>of</strong> lower horse abundance were not <strong>in</strong>cluded <strong>in</strong> <strong>the</strong> surveys. Density<br />
was not uniform across <strong>the</strong> areas surveyed (if <strong>the</strong>y were <strong>the</strong> coefficient <strong>of</strong> variation<br />
would be zero). No horses were seen <strong>in</strong> <strong>the</strong> sou<strong>the</strong>rn section <strong>of</strong> north Victoria (lower<br />
Buchan River), but horses were seen frequently on <strong>the</strong> high plateau country on <strong>the</strong><br />
NSW/Victoria border, and <strong>in</strong> <strong>the</strong> open pla<strong>in</strong>s <strong>in</strong> north Kosciuszko.<br />
Dyr<strong>in</strong>g (1990) estimated <strong>the</strong> number <strong>of</strong> horses <strong>in</strong> <strong>the</strong> <strong>Australian</strong> <strong>Alps</strong> based on anecdotal<br />
evidence. She suggested that <strong>the</strong>re were 1500-1700 horses <strong>in</strong> <strong>the</strong> area covered <strong>in</strong> her<br />
survey <strong>in</strong> Victoria, which is slightly lower than <strong>the</strong> estimates obta<strong>in</strong>ed <strong>in</strong> <strong>the</strong> current<br />
study for Victorian <strong>Alps</strong> parks, and for NSW she suggested <strong>the</strong>re were several hundred<br />
7
horses <strong>in</strong> south Kosciuszko and approximately 100 <strong>in</strong> nor<strong>the</strong>rn Kosciuszko. We have no<br />
way <strong>of</strong> know<strong>in</strong>g how accurate <strong>the</strong>se estimates are, but <strong>the</strong>y are much lower than <strong>the</strong><br />
current study and suggest a 3 fold <strong>in</strong>crease <strong>in</strong> <strong>the</strong> population <strong>in</strong> Kosciuszko National<br />
park over 10 years.<br />
<strong>Population</strong> dynamics<br />
<strong>The</strong> options available to managers <strong>of</strong> any wildlife species are<br />
ei<strong>the</strong>r to make <strong>the</strong><br />
population <strong>in</strong>crease, to make it decrease, harvest it for a cont<strong>in</strong>ual yield or leave it alone.<br />
All <strong>of</strong> <strong>the</strong>se options are greatly assisted by an understand<strong>in</strong>g <strong>of</strong> <strong>the</strong> underly<strong>in</strong>g<br />
dynamics <strong>of</strong> <strong>the</strong> population. <strong>Population</strong> dynamics are <strong>the</strong> variations <strong>in</strong> <strong>the</strong> sizes and<br />
densities <strong>of</strong> populations reflect<strong>in</strong>g a change <strong>in</strong> demographic parameters <strong>in</strong>clud<strong>in</strong>g birth<br />
and death rates. Estimation and modell<strong>in</strong>g <strong>of</strong> demographic parameters provides<br />
<strong>in</strong>formation on <strong>the</strong> state <strong>of</strong> <strong>the</strong> population, such as whe<strong>the</strong>r it is likely to be stable,<br />
<strong>in</strong>creas<strong>in</strong>g or decl<strong>in</strong><strong>in</strong>g, and possible causes. <strong>The</strong> aim <strong>of</strong> this section <strong>of</strong> <strong>the</strong> study was to<br />
exam<strong>in</strong>e <strong>the</strong> population dynamics <strong>of</strong> three populations <strong>of</strong> wild horses across <strong>the</strong> <strong>Alps</strong>,<br />
determ<strong>in</strong>e what factors are likely to be limit<strong>in</strong>g <strong>the</strong> populations if any, and assess <strong>the</strong><br />
sensitivity <strong>of</strong> population growth rate to change <strong>in</strong> key demographic parameters (which<br />
can be used to help make decisions on what component <strong>of</strong> <strong>the</strong> population to target if<br />
undertak<strong>in</strong>g control).<br />
Studies on o<strong>the</strong>r wild horses around <strong>the</strong> world give us a good basic understand<strong>in</strong>g <strong>of</strong><br />
typical population dynamics and social organisation <strong>of</strong> wild horses. L<strong>in</strong>klater (2000)<br />
reviewed feral horse populations <strong>in</strong> North America, South America, Europe and<br />
Australasia and found that comparison across different populations showed that horses<br />
had remarkably similar social and spatial organisation and that group sizes (range 1 –<br />
28) and home range size (range 0.8 – 303km 2 ) varied as much between as with<strong>in</strong><br />
populations (L<strong>in</strong>klater 2000). <strong>The</strong> density <strong>of</strong> populations ranged from 0.1 to 35.4 horses<br />
per km 2 , and adult sex ratios varied from 0.03 to 1.85 males per female. Variation <strong>in</strong><br />
densities and sex ratios were <strong>of</strong>ten <strong>the</strong> result <strong>of</strong> management practices such as removal<br />
<strong>of</strong> animals. <strong>The</strong> maximum rate <strong>of</strong> <strong>in</strong>crease observed for any wild horse population to<br />
date is 30% per year (Duncan 1992), however values <strong>of</strong> 21% per year are more common<br />
(Garrott et al. 1991). <strong>Horses</strong> have an annual breed<strong>in</strong>g season with generally 80-90% <strong>of</strong><br />
adult females (over 2 years) produc<strong>in</strong>g one foal each year (Garrott et al. 1991).<br />
Survivorship is high <strong>in</strong> adults with little annual variation and generally lower and more<br />
variable earlier <strong>in</strong> life (Garrott & Taylor 1990).<br />
Variability <strong>in</strong> wild horse population dynamics occurs at different locations due to <strong>the</strong><br />
fact that different limit<strong>in</strong>g factors are operat<strong>in</strong>g on <strong>the</strong> various age and sex classes <strong>of</strong> <strong>the</strong><br />
population. For example, mounta<strong>in</strong> lion predation can drastically reduce juvenile<br />
survival, and food limitation reduces juvenile survival, delays age at first reproduction<br />
and reduces fecundity. Management practices can potentially limit populations by<br />
reduc<strong>in</strong>g fecundity (birth rate) us<strong>in</strong>g fertility control or reduc<strong>in</strong>g survival rates <strong>of</strong> adults<br />
and/or juveniles by cull<strong>in</strong>g.<br />
<strong>The</strong> population dynamics <strong>of</strong> wild horses were studied <strong>in</strong> detail at three sites each spr<strong>in</strong>g<br />
and autumn between spr<strong>in</strong>g 1999 and autumn 2002. <strong>The</strong> sites were Big Boggy near<br />
Mount Kosciuszko <strong>in</strong> central Kosciuszko National Park, Cowombat on <strong>the</strong> border <strong>of</strong><br />
8
Kosciuszko National Park and <strong>the</strong> Alp<strong>in</strong>e National Park near <strong>The</strong> Pilot, and Currango <strong>in</strong><br />
nor<strong>the</strong>rn Kosciuszko National Park southwest <strong>of</strong> Mount Bimberi (Table 2). <strong>The</strong>se sites<br />
were chosen to sample a range <strong>of</strong> habitats, because <strong>the</strong>y were areas <strong>of</strong> <strong>in</strong>terest for park<br />
managers, wild horses could readily be found at all <strong>of</strong> <strong>the</strong> sites, and <strong>the</strong>y are<br />
<strong>in</strong>dependent <strong>of</strong> each o<strong>the</strong>r (too far apart for horses to move between). <strong>The</strong>re was no<br />
management <strong>of</strong> <strong>the</strong>se populations for <strong>the</strong> duration <strong>of</strong> <strong>the</strong> study.<br />
<strong>Population</strong> estimates through time at each site showed different patterns. <strong>The</strong> Big<br />
Boggy population showed seasonal patterns with higher numbers <strong>in</strong> autumn than <strong>in</strong><br />
spr<strong>in</strong>g, and <strong>the</strong> spr<strong>in</strong>g estimates were more precise than <strong>the</strong> autumn estimates (range 57<br />
± 1 SE to 86 ± 6 SE horses). This trend is probably related to snow <strong>in</strong> <strong>the</strong> area over<br />
w<strong>in</strong>ter. Cowombat population estimates also showed seasonal trends but not as clearly<br />
as <strong>the</strong> Big Boggy, and were generally less precise than Big Boggy estimates (range from<br />
64 ± 6 SE to 101 ± 10 SE horses). <strong>The</strong>re was no clear seasonal trend <strong>in</strong> population<br />
estimates for Currango, and precision varied between occasions (range from 69 ± 4 SE to<br />
109 ± 6 SE horses). <strong>The</strong> variability <strong>in</strong> estimates <strong>of</strong> <strong>the</strong> Currango population was<br />
probably due to immigration and emigration. <strong>The</strong> highest average density <strong>of</strong> horses<br />
was observed at Cowombat, while <strong>the</strong> Big Boggy and Currango populations had similar<br />
lower densities (Table 3).<br />
Table 2: <strong>Population</strong> dynamics study area descriptions<br />
Site Area (km 2 ) Elevation (m) Vegetation<br />
Big Boggy 35.5 1500-2228 Alp<strong>in</strong>e, sub alp<strong>in</strong>e woodland, cold air<br />
dra<strong>in</strong>age shrub and herbfield<br />
Cowombat 12.7 1000-1540 Montane and mixed open forest, subalp<strong>in</strong>e<br />
woodland, tall gum and alp<strong>in</strong>e ash forest<br />
Currango 41.4 1220-1370 Cold air dra<strong>in</strong>age shrub and herbfield,<br />
montane mixed open forest, subalp<strong>in</strong>e<br />
woodland, tall gum and alp<strong>in</strong>e ash forest<br />
<strong>The</strong> demographics <strong>of</strong> <strong>the</strong> populations were similar to those <strong>of</strong> o<strong>the</strong>r wild horse<br />
populations with high adult survival rates, lower survival <strong>in</strong> <strong>the</strong> first 3 years <strong>of</strong> life and<br />
fecundity rates <strong>of</strong> about 0.25 (number <strong>of</strong> females born per female per year) (Table 3). All<br />
sites had a positive rate <strong>of</strong> <strong>in</strong>crease but <strong>the</strong> only site where <strong>the</strong> rate <strong>of</strong> <strong>in</strong>crease was<br />
significantly different to a stable population was Currango. Cowombat had <strong>the</strong> lowest<br />
rate <strong>of</strong> <strong>in</strong>crease.<br />
9
Table 3: Summary <strong>of</strong> key demographic variables for <strong>the</strong> three study sites 1999-2001.<br />
Fecundity is half juveniles per adult female per year, survival rates are annual, and rate<br />
<strong>of</strong> <strong>in</strong>crease (λ) is <strong>the</strong> annual f<strong>in</strong>ite growth rate (with coefficient <strong>of</strong> variation <strong>in</strong> <strong>the</strong><br />
estimate).<br />
Site Average Fecundity Survival 0-3 Adult Rate <strong>of</strong> <strong>in</strong>crease<br />
density years survival (CV %)<br />
(horseskm -2 )<br />
Big Boggy 2.01 0.24 0.75 0.91 1.07 (3.5)<br />
Cowombat 6.40 0.21 0.63 0.91 1.03 (3.4)<br />
Currango 2.13 0.31 0.67 0.91 1.09 (4.2)<br />
<strong>Horses</strong> at Cowombat had <strong>the</strong> poorest average body condition <strong>of</strong> <strong>the</strong> three sites, and<br />
horses at Currango had <strong>the</strong> highest body condition score. This trend <strong>of</strong> body condition<br />
was reflected <strong>in</strong> <strong>the</strong> trend <strong>in</strong> food available (Table 4). <strong>The</strong> body condition <strong>of</strong> females was<br />
poorer than males, overall however, <strong>the</strong> body condition <strong>of</strong> females at Currango was not<br />
significantly different to that <strong>of</strong> males.<br />
Currango<br />
Body Con ditio n<br />
Cowombat<br />
Big Boggy<br />
Food Available<br />
Figure 3: Average body condition scores and food availability scores for <strong>the</strong> three study<br />
sites between 1999 and 2001.<br />
<strong>The</strong> trend <strong>in</strong> body condition and food availability (Figure 3) and rate <strong>of</strong> <strong>in</strong>crease (Table<br />
3) across <strong>the</strong> three sites suggests that <strong>the</strong> population at Cowombat is food limited and<br />
relatively stable while <strong>the</strong> population at Currango is not limited by food and <strong>in</strong>creas<strong>in</strong>g.<br />
<strong>The</strong> Big Boggy is <strong>in</strong> between <strong>the</strong> two. <strong>The</strong> implications <strong>of</strong> this for management is that<br />
<strong>the</strong> Currango population is likely to cont<strong>in</strong>ue to <strong>in</strong>crease if no control actions are taken,<br />
although <strong>the</strong> relative impact <strong>of</strong> <strong>the</strong> horses at Currango on vegetation is lower. At <strong>the</strong><br />
o<strong>the</strong>r end <strong>of</strong> <strong>the</strong> scale, <strong>the</strong> population at Cowombat appears to be stable and <strong>in</strong><br />
equilibrium with its environment and unlikely to <strong>in</strong>crease <strong>in</strong> size <strong>in</strong> <strong>the</strong> absence <strong>of</strong><br />
management, although <strong>the</strong> impact <strong>of</strong> <strong>the</strong> wild horses <strong>in</strong> <strong>the</strong> area on <strong>the</strong> vegetation is<br />
higher. <strong>The</strong> Cowombat site was burnt by <strong>in</strong>tense wildfire <strong>in</strong> 2003 and it would be<br />
beneficial to revisit <strong>the</strong> sites to reassess <strong>the</strong> populations.<br />
10
Managers that target adults (survival or removal) <strong>in</strong> any control measure will yield <strong>the</strong><br />
most significant result, followed by fertility control <strong>the</strong>n target<strong>in</strong>g 0-3 year olds. This is<br />
because <strong>the</strong> rate <strong>of</strong> <strong>in</strong>crease <strong>of</strong> <strong>the</strong> wild horse populations were most sensitive to changes<br />
<strong>in</strong> adult survival. <strong>The</strong> next most <strong>in</strong>fluential parameter is fecundity, which has half <strong>the</strong><br />
weight<strong>in</strong>g <strong>of</strong> adult survival. Survival <strong>in</strong> <strong>the</strong> first 3 years <strong>of</strong> life has less <strong>in</strong>fluence<br />
receiv<strong>in</strong>g only 1/5 th <strong>the</strong> weight<strong>in</strong>g <strong>of</strong> adult survival, and age <strong>of</strong> first reproduction had a<br />
negligible effect on population growth rate.<br />
Brumby-runn<strong>in</strong>g<br />
Management <strong>of</strong> wild horses <strong>in</strong> <strong>the</strong> <strong>Australian</strong> <strong>Alps</strong> is not based purely <strong>in</strong> <strong>the</strong> context <strong>of</strong><br />
an <strong>in</strong>troduced species but also as one with cultural value. Brumby-runn<strong>in</strong>g is an activity<br />
that began soon after <strong>the</strong> arrival <strong>of</strong> horses <strong>in</strong> <strong>the</strong> <strong>Australian</strong> <strong>Alps</strong> and is closely tied to<br />
<strong>the</strong> culture <strong>of</strong> wild horses. At <strong>the</strong> time <strong>of</strong> <strong>the</strong> study, <strong>the</strong> only active management <strong>of</strong> wild<br />
horses <strong>in</strong> <strong>the</strong> <strong>Australian</strong> <strong>Alps</strong> national park was brumby-runn<strong>in</strong>g <strong>in</strong> <strong>the</strong> Victorian <strong>Alps</strong>.<br />
Brumby-runn<strong>in</strong>g is a form <strong>of</strong> harvest<strong>in</strong>g where horse-riders rope wild horses and<br />
remove <strong>the</strong>m from <strong>the</strong> population; it is thought to have a limit<strong>in</strong>g effect on <strong>the</strong> wild<br />
horse population <strong>in</strong> Victoria, but it has never been exam<strong>in</strong>ed empirically. <strong>The</strong> purpose<br />
<strong>of</strong> this section <strong>of</strong> <strong>the</strong> study was to ga<strong>in</strong> an understand<strong>in</strong>g <strong>of</strong> <strong>the</strong> <strong>in</strong>fluence <strong>of</strong> brumbyrunn<strong>in</strong>g<br />
on <strong>the</strong> wild horse population <strong>in</strong> Victoria. In particular to describe <strong>the</strong><br />
demography <strong>of</strong> wild horses removed by brumby-runners, assess <strong>the</strong> behaviour <strong>of</strong><br />
brumby-runners relevant to <strong>the</strong> type and quantity <strong>of</strong> wild horses caught, and predict <strong>the</strong><br />
likely effect <strong>of</strong> brumby-runn<strong>in</strong>g on <strong>the</strong> wild horse population.<br />
Demographic data on wild horses caught and removed from <strong>the</strong> Alp<strong>in</strong>e National Park,<br />
Victoria was supplied by <strong>the</strong> Alp<strong>in</strong>e Brumby Management Association (ABMA) and<br />
Parks Victoria from 1998 to 2002. Brumby-runners recorded <strong>the</strong> general location,<br />
number and type (stallion, colt, mare, filly) <strong>of</strong> all horses caught each f<strong>in</strong>ancial year. <strong>The</strong><br />
quality <strong>of</strong> <strong>in</strong>formation supplied improved over time. <strong>The</strong> data for 2000-2001 and 2001-<br />
2002 are <strong>the</strong> most detailed <strong>in</strong>clud<strong>in</strong>g <strong>the</strong> month <strong>of</strong> capture and estimated age. I gave<br />
body condition scores to 176 horses caught between autumn 1999 and spr<strong>in</strong>g 2001<br />
<strong>in</strong>clusive based on photographic records kept by one brumby-runner (BR1). Body<br />
condition and demography <strong>of</strong> horses caught were compared to <strong>the</strong> wild horses studied<br />
<strong>in</strong> <strong>the</strong> population dynamics component <strong>of</strong> <strong>the</strong> study to see if <strong>the</strong> brumby-runners were<br />
selectively harvest<strong>in</strong>g. I also used records kept by BR1 on trips made between January<br />
2000 and January 2001 on number <strong>of</strong> brumby-runners, length <strong>of</strong> trip and capture rate to<br />
get an <strong>in</strong>sight <strong>in</strong>to <strong>the</strong> effectiveness <strong>of</strong> brumby-runn<strong>in</strong>g. F<strong>in</strong>ally, I used logistic growth<br />
models to assess whe<strong>the</strong>r <strong>the</strong> number <strong>of</strong> horses removed by brumby-runners is likely to<br />
be limit<strong>in</strong>g <strong>the</strong> population.<br />
About 200 horses were caught each year between 1998 and 2002 (Table 4). <strong>The</strong> majority<br />
<strong>of</strong> horses caught were young (colts and fillies). More females (mares and fillies) than<br />
males (stallions and colts) were caught <strong>in</strong> all years (ratio 0.67:1). <strong>The</strong> difference is due<br />
mostly to <strong>the</strong> fact that so few stallions were caught. Most horses were caught <strong>in</strong> autumn<br />
and least <strong>in</strong> summer with similar amounts be<strong>in</strong>g caught <strong>in</strong> w<strong>in</strong>ter and spr<strong>in</strong>g.<br />
11
Table 4: Summary <strong>of</strong> horses caught by brumby-runners <strong>in</strong> <strong>the</strong> Alp<strong>in</strong>e National Park,<br />
Victoria. *Not all horses caught were recorded <strong>in</strong> 1999-2000.<br />
Year Total caught Stallions (%) Colts (%) Mares (%) Fillies (%)<br />
1998-1999 224 9.4 29.9 43.8 17<br />
1999-2000 78* 7.7 37.2 41 14.1<br />
2000-2001 174 9.8 25.9 36.2 28.2<br />
2001-2002 207 7.7 36.2 33.3 22.7<br />
<strong>The</strong> assignment <strong>of</strong> wild horses caught <strong>in</strong>to categories <strong>of</strong> stallion, mares, colts and fillies<br />
can be mislead<strong>in</strong>g for <strong>in</strong>terpret<strong>in</strong>g age <strong>of</strong> horses, particularly males because males (3-6<br />
years old) can be called colts while <strong>the</strong> classification <strong>of</strong> 3-year-old females and older as<br />
fillies is less common. I would recommend that any data collection should <strong>in</strong>clude an<br />
estimation <strong>of</strong> age <strong>in</strong> <strong>the</strong> future to address this. This was done between 2000 and 2002<br />
and <strong>the</strong> data was used <strong>in</strong> comparisons with <strong>the</strong> Cowombat, Big Boggy and Currango<br />
wild populations.<br />
Brumby-runners did not select for males or females when all age classes were comb<strong>in</strong>ed<br />
for <strong>the</strong> analysis, however <strong>the</strong>y did select for adult females over adult males. <strong>The</strong>y also<br />
showed a preference for younger animals (
Predicted Popu latio n S ize<br />
4500<br />
4000<br />
3500<br />
3000<br />
2500<br />
2000<br />
1500<br />
1000<br />
500<br />
H=0<br />
H= 50<br />
H=100<br />
H=150<br />
H=200<br />
H=250<br />
H=300<br />
H=350<br />
0<br />
0<br />
10 20 30 40 50<br />
Time (Years)<br />
Figure 4: Predicted size <strong>of</strong> <strong>the</strong> Alp<strong>in</strong>e National Park wild horse population at different<br />
levels <strong>of</strong> harvest (H) per year. <strong>The</strong> model assumes logistic growth with <strong>in</strong>tr<strong>in</strong>sic rate <strong>of</strong><br />
<strong>in</strong>crease = 0.2, <strong>in</strong>itial population size = 2000 and carry<strong>in</strong>g capacity = 4000.<br />
This model assumes a non-selective harvest. Harvest<strong>in</strong>g that targets younger animals<br />
means that more animals have to be removed to achieve <strong>the</strong> same population reduction,<br />
while selectively harvest<strong>in</strong>g adult females will lead to a sex bias <strong>in</strong> <strong>the</strong> population and<br />
less animals would have to be removed to achieve <strong>the</strong> same target.<br />
Modell<strong>in</strong>g shows that although brumby-runn<strong>in</strong>g is a form <strong>of</strong> recreational harvest<strong>in</strong>g, it<br />
can suppress populations below carry<strong>in</strong>g capacity and can be used as a management<br />
tool. Its effectiveness as a management tool will depend on <strong>the</strong> management objectives<br />
<strong>in</strong> each circumstance. I recommend that if it is used as a management tool <strong>in</strong> <strong>the</strong> future<br />
it should be accompanied by population and/or impact monitor<strong>in</strong>g, as should any form<br />
<strong>of</strong> management.<br />
Key management messages<br />
• <strong>The</strong> maximum observed rate <strong>of</strong> spread <strong>of</strong> wild horses <strong>in</strong> <strong>the</strong> <strong>Australian</strong> <strong>Alps</strong><br />
between Dyr<strong>in</strong>g’s (1990) study and <strong>the</strong> maps presented here is remarkably low<br />
(< 4 km per year).<br />
• <strong>Wild</strong> horses do not occupy <strong>the</strong> full extent <strong>of</strong> <strong>the</strong>ir potential range.<br />
• Humans appear to be <strong>the</strong> most important factor <strong>in</strong>fluenc<strong>in</strong>g wild horse<br />
distribution. <strong>The</strong> presence <strong>of</strong> horses <strong>in</strong> an area can usually be traced back to an<br />
<strong>in</strong>troduction event, and control efforts have removed <strong>the</strong>m or reduced <strong>the</strong>ir range.<br />
13
• <strong>Population</strong> estimates <strong>in</strong> <strong>the</strong> survey area us<strong>in</strong>g <strong>the</strong> l<strong>in</strong>e transect method equated<br />
to 1.86 horses per km 2 and a population estimate <strong>of</strong> 5200.<br />
• <strong>The</strong>re is some evidence to suggest that <strong>the</strong> wild horse population <strong>in</strong> Kosciuszko<br />
<strong>in</strong>creased 3-fold <strong>in</strong> Kosciuszko National park over 10 years.<br />
• Management practices can potentially limit populations by target<strong>in</strong>g reduc<strong>in</strong>g<br />
fecundity (birth rate) us<strong>in</strong>g fertility control or reduc<strong>in</strong>g survival rates (by removal<br />
or cull<strong>in</strong>g) <strong>of</strong> adults and/or juveniles. Managers that target adults will yield <strong>the</strong><br />
most significant results, followed by fertility control <strong>the</strong>n target<strong>in</strong>g 0-3 year olds.<br />
• Across <strong>the</strong> three populations studied (Currango, Big Boggy and Cowombat)<br />
trends <strong>in</strong> population rate <strong>of</strong> <strong>in</strong>crease, body condition and food availability suggest<br />
that <strong>the</strong> population at Cowombat is food limited and relatively stable while <strong>the</strong><br />
population at Currango is not limited by food and <strong>in</strong>creas<strong>in</strong>g. <strong>The</strong> Big Boggy is <strong>in</strong><br />
between <strong>the</strong> two.<br />
• Brumby-runners <strong>in</strong> <strong>the</strong> Alp<strong>in</strong>e National park, Victoria caught approximately 200<br />
horses annually between 1998 and 2002. <strong>The</strong> majority <strong>of</strong> horses caught were<br />
young and more females than males were caught. <strong>The</strong> discrepancy between <strong>the</strong><br />
sexes is because so few adult males (stallions) were caught.<br />
• Modell<strong>in</strong>g shows that brumby-runn<strong>in</strong>g can suppress wild horse populations<br />
below carry<strong>in</strong>g capacity and can be used as a management tool.<br />
References<br />
Caughley, G. (1977). Analysis <strong>of</strong> Vertebrate <strong>Population</strong>s. John Wiley & Sons, London.<br />
Cost<strong>in</strong>, A.B. (1954). A Study <strong>of</strong> <strong>the</strong> Ecosystems <strong>of</strong> <strong>the</strong> Monaro Region <strong>of</strong> New South<br />
Wales. Soil Conservation Service <strong>of</strong> NSW, Sydney.<br />
Dobbie, W.R., Berman, D.McK. & Braysher, M.L. (1993). Manag<strong>in</strong>g Vertebrate Pests:<br />
Feral <strong>Horses</strong>. <strong>Australian</strong> Government Publish<strong>in</strong>g Service, Canberra.<br />
Duncan, P. (1992). <strong>Horses</strong> and Grasses. <strong>The</strong> Nutritional <strong>Ecology</strong> <strong>of</strong> Equids and <strong>The</strong>ir<br />
Impacts on <strong>the</strong> Camargue. Volume 87, Ecological Studies. Spr<strong>in</strong>ger-Verlag, New<br />
York.<br />
Dyr<strong>in</strong>g, J. (1990). <strong>The</strong> Impact <strong>of</strong> Feral <strong>Horses</strong> (Equus caballus) on Sub-alp<strong>in</strong>e and Montane<br />
Environments. Masters <strong>The</strong>sis, University <strong>of</strong> Canberra, Canberra.<br />
Garrott, R.A., S<strong>in</strong>iff, D.B. & Eberhardt, L.L. (1991). Growth rates <strong>of</strong> feral horse<br />
populations. Journal <strong>of</strong> <strong>Wild</strong>life Management 55: 641-648.<br />
Garrott, R.A. & Taylor, L. (1990). Dynamics <strong>of</strong> a feral horse population <strong>in</strong> Montana.<br />
Journal <strong>of</strong> <strong>Wild</strong>life Management 54: 603-612.<br />
Green, K. & Osborne, W. (1994). <strong>Wild</strong>life <strong>of</strong> <strong>the</strong> <strong>Australian</strong> Snow-Country. Reed Books,<br />
Sydney.<br />
Helms, R. (1890). Report on <strong>the</strong> graz<strong>in</strong>g leases <strong>of</strong> <strong>the</strong> Mount Kosciusko Plateau. NSW<br />
Agricultural Gazette 4: 530-531.<br />
Higg<strong>in</strong>s, M. (1994). On <strong>the</strong> trail <strong>of</strong> <strong>the</strong> Namadgi brumby runners. Canberra Historical<br />
Society 33:16-22.<br />
L<strong>in</strong>klater, W.L. (2000). Adaptive explanation <strong>in</strong> socio-ecology: lessons from <strong>the</strong> Equidae.<br />
Biological Reviews 75: 1-20.<br />
14
Walter M. J. (2002). <strong>The</strong> population ecology <strong>of</strong> wild horses <strong>in</strong> <strong>the</strong> <strong>Australian</strong> <strong>Alps</strong>. Ph.D.<br />
<strong>The</strong>sis, University <strong>of</strong> Canberra, Canberra.<br />
Walter, M. J. (2003). <strong>The</strong> Effect <strong>of</strong> Fire on <strong>Wild</strong> <strong>Horses</strong> <strong>in</strong> <strong>the</strong> <strong>Australian</strong> <strong>Alps</strong> National<br />
Parks. Unpublished report.<br />
Walter M. J. & Hone J. (2003) A comparison <strong>of</strong> three aerial survey techniques to estimate<br />
wild horse abundance <strong>in</strong> <strong>the</strong> <strong>Australian</strong> <strong>Alps</strong>. <strong>Wild</strong>life Society Bullet<strong>in</strong> 31, 1138-49.<br />
Walters, B. & Hallam, M. (Eds.). (1992). Feral <strong>Horses</strong> <strong>in</strong> <strong>the</strong> <strong>Alps</strong>, Report <strong>of</strong> a workshop.<br />
<strong>Australian</strong> <strong>Alps</strong> Liaison Committee, Canberra.<br />
Whetton, P. 1998. Climate change impacts on <strong>the</strong> spatial extent <strong>of</strong> snow cover <strong>in</strong> <strong>the</strong><br />
<strong>Australian</strong> <strong>Alps</strong>. In K. Green Ed. Snow A Natural History: An Uncerta<strong>in</strong> Future.<br />
<strong>Australian</strong> <strong>Alps</strong> Liaison Committee, Canberra. Pp. 195-206.<br />
15