Bulletin of the Sea Fisheries Institute 1 (155) 2002 - CEEMaR
Bulletin of the Sea Fisheries Institute 1 (155) 2002 - CEEMaR
Bulletin of the Sea Fisheries Institute 1 (155) 2002 - CEEMaR

Create successful ePaper yourself
Turn your PDF publications into a flip-book with our unique Google optimized e-Paper software.
14<br />
NATALIA KRASOVSKAJA<br />
Table 5. Duration <strong>of</strong> herring spawning season in <strong>the</strong> Vistula Lagoon by periods <strong>of</strong> different stock abundance<br />
Period<br />
Total herring<br />
catches [t]<br />
Catch per<br />
pound net [t]<br />
Stock<br />
abundance<br />
Duration <strong>of</strong> herring presence in<br />
<strong>the</strong> lagoon [days]<br />
Duration <strong>of</strong> mass<br />
spawning [days]<br />
1951-1954 11884 162 High 81 26<br />
1955-1966 1100 19 Low 62 26<br />
1967-1994 8472 131 High 69 37<br />
1995-2000 2944 31 Low 81 47<br />
On <strong>the</strong> contrary, changes in factors related to <strong>the</strong> spawning stock state did not cause very<br />
noticeable changes in <strong>the</strong> spawning pattern. Alternating periods <strong>of</strong> high and low stock abundance<br />
in <strong>the</strong> Vistula Lagoon are clearly determined (Fig. 2). When <strong>the</strong> data are summarized<br />
taking into account all <strong>the</strong> years until 2000, <strong>the</strong> results (Table 5) indicate ei<strong>the</strong>r weak or insignificant<br />
relationships despite significant changes in stock abundance. The same should be noted<br />
concerning age composition and growth rate changes. The current results confirmed <strong>the</strong> prevalent<br />
effect <strong>of</strong> abiotic factors on <strong>the</strong> herring spawning pattern in <strong>the</strong> Vistula Lagoon.<br />
The first spawning wave<br />
As follows from Table 4, <strong>the</strong> timing and duration <strong>of</strong> spawning are closely connected to <strong>the</strong> date<br />
<strong>the</strong> first spawning wave appeared. When <strong>the</strong> herring arrival is earlier, spawning begins and<br />
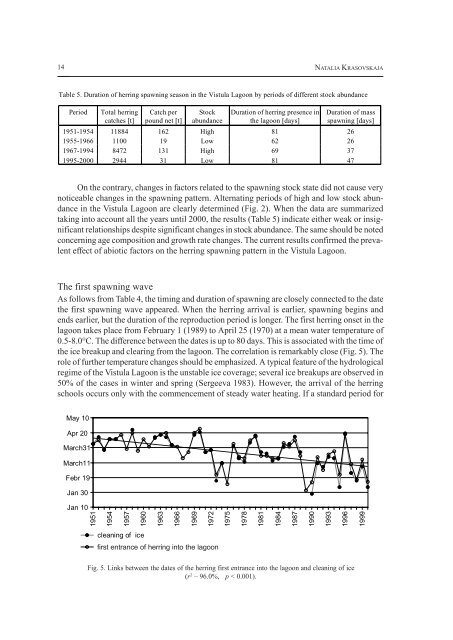
ends earlier, but <strong>the</strong> duration <strong>of</strong> <strong>the</strong> reproduction period is longer. The first herring onset in <strong>the</strong><br />
lagoon takes place from February 1 (1989) to April 25 (1970) at a mean water temperature <strong>of</strong><br />
0.5-8.0°C. The difference between <strong>the</strong> dates is up to 80 days. This is associated with <strong>the</strong> time <strong>of</strong><br />
<strong>the</strong> ice breakup and clearing from <strong>the</strong> lagoon. The correlation is remarkably close (Fig. 5). The<br />
role <strong>of</strong> fur<strong>the</strong>r temperature changes should be emphasized. A typical feature <strong>of</strong> <strong>the</strong> hydrological<br />
regime <strong>of</strong> <strong>the</strong> Vistula Lagoon is <strong>the</strong> unstable ice coverage; several ice breakups are observed in<br />
50% <strong>of</strong> <strong>the</strong> cases in winter and spring (Sergeeva 1983). However, <strong>the</strong> arrival <strong>of</strong> <strong>the</strong> herring<br />
schools occurs only with <strong>the</strong> commencement <strong>of</strong> steady water heating. If a standard period for<br />
May 10<br />
Apr 20<br />
March31<br />
March11<br />
Febr 19<br />
Jan 30<br />
Jan 10<br />
1951<br />
1954<br />
1957<br />
1960<br />
1963<br />
1966<br />
1969<br />
1972<br />
1975<br />
1978<br />
1981<br />
1984<br />
1987<br />
1990<br />
1993<br />
1996<br />
1999<br />
cleaning <strong>of</strong> ice<br />
first entering entrance <strong>of</strong> <strong>of</strong> herring into into <strong>the</strong> <strong>the</strong> Lagoon lagoon<br />
Fig. 5. Links between <strong>the</strong> dates <strong>of</strong> <strong>the</strong> herring first entrance into <strong>the</strong> lagoon and cleaning <strong>of</strong> ice<br />
(r 2 – 96.0%, p < 0.001).