Q Factor Measurements with an SWR Meter - Ve2azx.net
Q Factor Measurements with an SWR Meter - Ve2azx.net
Q Factor Measurements with an SWR Meter - Ve2azx.net

You also want an ePaper? Increase the reach of your titles
YUMPU automatically turns print PDFs into web optimized ePapers that Google loves.
capacitor, C, for reson<strong>an</strong>ce to maximize the<br />
voltage across the resonating capacitor C.<br />
The Q is calculated using Equation 2.<br />
Voltage Across C<br />
Q =<br />
Source Voltage<br />
[Eq 2]<br />
Note that the source voltage is in the<br />
millivolt r<strong>an</strong>ge, since it will be multiplied by<br />
the Q factor. A 10 mV source <strong>an</strong>d a Q of 500<br />
will give 5 V across the L-C circuit. In order<br />
to preserve the high imped<strong>an</strong>ce of the detector<br />
even at the higher frequencies, a capacitive<br />
voltage divider is used.<br />
This circuit measures the unloaded Q<br />
called Q U provided that the series resist<strong>an</strong>ce<br />
R S of the inductor under test is much higher<br />
th<strong>an</strong> the source resist<strong>an</strong>ce R S ′ <strong>an</strong>d the detector<br />
parallel resist<strong>an</strong>ce R P ′ is much larger th<strong>an</strong> the<br />
L-C circuit R P . 1<br />
2 – Tr<strong>an</strong>smission Method Using<br />
Coupling Capacitors<br />
A signal is coupled into <strong>an</strong> L-C parallel<br />
circuit using a low value capacitor <strong>an</strong>d<br />
extracts the output signal using the same<br />
value of capacitor. 2 See Figure 2. Note that<br />
inductive coupling is also possible, as used in<br />
tr<strong>an</strong>smission line (cavity) resonators.<br />
The – 3 dB b<strong>an</strong>dwidth (BW) is measured<br />
at the reson<strong>an</strong>t frequency f 0 , <strong>an</strong>d the loaded Q<br />
(Q L ) is calculated <strong>with</strong> Equation 3.<br />
f0<br />
QL<br />
= [Eq 3]<br />
BW<br />
The obtained b<strong>an</strong>dwidth, BW, is a function<br />
of the coupling, <strong>an</strong>d <strong>an</strong>other calculation<br />
is required to get Q U , the unloaded Q. When<br />
the input to output coupling is identical, we<br />
use Equation 4.<br />
⎛ Q ⎞<br />
U<br />
Loss = 20 log⎜ ⎟ [Eq 4]<br />
⎝ QU<br />
−QL<br />
⎠<br />
where Loss is in positive dB. The ratio Q U /<br />
Q L may now be calculated using Equation 5.<br />
Q<br />
Q<br />
U<br />
L<br />
Loss<br />
⎛ ⎞<br />
20<br />
10<br />
=<br />
⎜ ⎟<br />
Loss<br />
⎜ 20<br />
10 −1⎟<br />
⎝ ⎠<br />
[Eq 5]<br />
This equation is plotted in Figure 3.<br />
Note that this method applies well to<br />
tr<strong>an</strong>smission line resonators <strong>with</strong> equal<br />
imped<strong>an</strong>ce inductive coupling loops at the<br />
input / output. Note also that these two methods<br />
do not require knowledge of the L or C<br />
values to compute the Q factors.<br />
3 – Shunt Mode Tr<strong>an</strong>smission Method<br />
With L-C in Series<br />
Here the L <strong>an</strong>d C are series connected<br />
<strong>an</strong>d placed in shunt across the tr<strong>an</strong>smission<br />
circuit. See Figure 4. (This method is also<br />
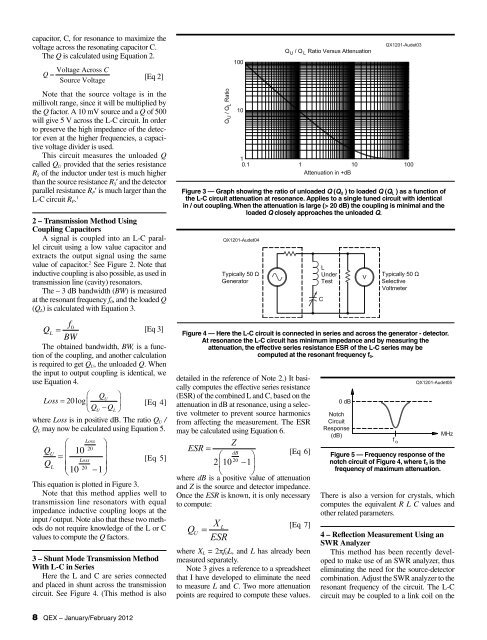
Figure 3 — Graph showing the ratio of unloaded Q (Q U ) to loaded Q (Q L ) as a function of<br />
the L-C circuit attenuation at reson<strong>an</strong>ce. Applies to a single tuned circuit <strong>with</strong> identical<br />
in / out coupling. When the attenuation is large (> 20 dB) the coupling is minimal <strong>an</strong>d the<br />
loaded Q closely approaches the unloaded Q.<br />
Figure 4 — Here the L-C circuit is connected in series <strong>an</strong>d across the generator - detector.<br />
At reson<strong>an</strong>ce the L-C circuit has minimum imped<strong>an</strong>ce <strong>an</strong>d by measuring the<br />
attenuation, the effective series resist<strong>an</strong>ce ESR of the L-C series may be<br />
computed at the reson<strong>an</strong>t frequency f 0 .<br />
detailed in the reference of Note 2.) It basically<br />
computes the effective series resist<strong>an</strong>ce<br />
(ESR) of the combined L <strong>an</strong>d C, based on the<br />
attenuation in dB at reson<strong>an</strong>ce, using a selective<br />
voltmeter to prevent source harmonics<br />
from affecting the measurement. The ESR<br />
may be calculated using Equation 6.<br />
= Z<br />
ESR ⎛ dB ⎞ [Eq 6]<br />
20<br />
2⎜10 −1⎟<br />
⎝ ⎠<br />
where dB is a positive value of attenuation<br />
<strong>an</strong>d Z is the source <strong>an</strong>d detector imped<strong>an</strong>ce.<br />
Once the ESR is known, it is only necessary<br />
to compute:<br />
Q<br />
U<br />
X<br />
ESR<br />
=<br />
L<br />
[Eq 7]<br />
where X L = 2πf 0 L, <strong>an</strong>d L has already been<br />
measured separately.<br />
Note 3 gives a reference to a spreadsheet<br />
that I have developed to eliminate the need<br />
to measure L <strong>an</strong>d C. Two more attenuation<br />
points are required to compute these values.<br />
Figure 5 — Frequency response of the<br />
notch circuit of Figure 4, where f 0 is the<br />
frequency of maximum attenuation.<br />
There is also a version for crystals, which<br />
computes the equivalent R L C values <strong>an</strong>d<br />
other related parameters.<br />
4 – Reflection Measurement Using <strong>an</strong><br />
<strong>SWR</strong> Analyzer<br />
This method has been recently developed<br />
to make use of <strong>an</strong> <strong>SWR</strong> <strong>an</strong>alyzer, thus<br />
eliminating the need for the source-detector<br />
combination. Adjust the <strong>SWR</strong> <strong>an</strong>alyzer to the<br />
reson<strong>an</strong>t frequency of the circuit. The L-C<br />
circuit may be coupled to a link coil on the<br />
8 QEX – J<strong>an</strong>uary/February 2012