Nassau County - Northeast Florida Regional Council
Nassau County - Northeast Florida Regional Council
Nassau County - Northeast Florida Regional Council

You also want an ePaper? Increase the reach of your titles
YUMPU automatically turns print PDFs into web optimized ePapers that Google loves.
<strong>Florida</strong> Statewide<br />
<strong>Regional</strong> Evacuation<br />
Study Program<br />
Storm Tide<br />
Atlas<br />
<strong>Nassau</strong> <strong>County</strong><br />
Volume 7-4<br />
Book 4 of 6<br />
<strong>Florida</strong> Division of<br />
Emergency Management<br />
<strong>Northeast</strong> <strong>Florida</strong><br />
<strong>Regional</strong> <strong>Council</strong><br />
<strong>Northeast</strong> <strong>Florida</strong> Region<br />
Includes Hurricane Evacuation Study
Volume VII-4 <strong>Northeast</strong> <strong>Florida</strong><br />
Statewide <strong>Regional</strong> Evacuation Studies Program<br />
NORTHEAST FLORIDA<br />
STORM TIDE ATLAS<br />
Volume VII-4<br />
Book 4<br />
<strong>Nassau</strong> <strong>County</strong><br />
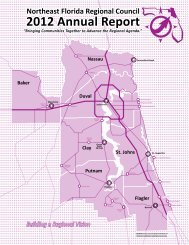
This Book is part of Volume VII of the Statewide <strong>Regional</strong> Evacuation Study (SRES) Program<br />
and one of five county books in the <strong>Northeast</strong> <strong>Florida</strong> Storm Tide Atlas Series. Book 1 covers Clay<br />
<strong>County</strong>; Book 2 covers Duval <strong>County</strong>; Book 3 covers Flagler <strong>County</strong>, Book 4 covers <strong>Nassau</strong> <strong>County</strong>;<br />
Book 5 covers Putnam <strong>County</strong> and Book 6 covers St. Johns <strong>County</strong>. The Atlas maps identify those<br />
areas subject to potential storm tide flooding from the five categories of hurricane on the Saffir<br />
Simpson Hurricane Wind Scale as determined by NOAA’s numerical storm surge model, SLOSH.<br />
The Storm Tide Atlas, published in 2010, is the foundation of the hazards analysis for storm tide<br />
and a key component of the SRES. The Technical Data Report (Volume I) builds upon this analysis<br />
and includes the revised evacuation zones and population estimates, results of the evacuation<br />
behavioral data, shelter analysis and evacuation transportation analyses. The Study, which provides<br />
vital information to state and local emergency management, forms the basis for county evacuation<br />
plans. The final documents with summary information will be published and made available on the<br />
Internet (www.nefrc.org) in December 2010.<br />
The Atlas was produced by the <strong>Northeast</strong> <strong>Florida</strong> <strong>Regional</strong> <strong>Council</strong> with funding by the <strong>Florida</strong><br />
Legislature and the Federal Emergency Management Agency through the <strong>Florida</strong> Division of<br />
Emergency Management.<br />
This Atlas was prepared and published by the <strong>Northeast</strong> <strong>Regional</strong> <strong>Council</strong>,<br />
6850 Belfort Oaks Place, Jacksonville, Fl 32216. Telephone: (904) 279-0880<br />
Fax: (904) 279-0881: Email: epayne@nefrc.org or jalexander@nefrc.org<br />
Web site: www.nefrc.org<br />
Volume VII: Storm Tide Atlas Page 1
Volume VII-4 <strong>Northeast</strong> <strong>Florida</strong><br />
Statewide <strong>Regional</strong> Evacuation Studies Program<br />
VOLUME VII-4<br />
NORTHEAST<br />
FLORIDA<br />
STORM TIDE ATLAS<br />
TABLE OF CONTENTS<br />
Book 4<br />
<strong>Nassau</strong> <strong>County</strong><br />
INTRODUCTION ..................................................................................................... 6<br />
THE SLOSH MODEL ................................................................................................ 7<br />
Hypothetical Storm Simulations ............................................................................ 7<br />
The Grid for the <strong>Northeast</strong> <strong>Florida</strong> SLOSH Model .................................................. 10<br />
Storm Scenario Determinations........................................................................... 10<br />
CREATION OF THE STORM TIDE ZONES ................................................................ 12<br />
Determining Storm Tide Height and Flooding Depth ............................................. 12<br />
Storm Tide Post-Processing ................................................................................ 13<br />
VARIATIONS TO CONSIDER .................................................................................. 15<br />
Storm tide & Wave Height.................................................................................. 15<br />
Forward Speed.................................................................................................. 15<br />
Astronomical Tides ............................................................................................ 15<br />
Accuracy........................................................................................................... 15<br />
POINTS OF REFERENCE ........................................................................................ 16<br />
STORM TIDE ATLAS.............................................................................................. 18<br />
LIST OF TABLES<br />
Table 1 Saffir-Simpson Hurricane Wind Scale........................................................ 8<br />
Table 2 <strong>Northeast</strong> <strong>Florida</strong> Basin Hypothetical Storm Parameters............................. 9<br />
Table 3 Potential Storm Tide Height (s) by <strong>County</strong> ............................................. 11<br />
Table 4 Selected Points of Reference................................................................. 17<br />
Page 2<br />
Volume VII: Storm Tide Atlas
Volume VII-4 <strong>Northeast</strong> <strong>Florida</strong><br />
LIST OF FIGURES<br />
Statewide <strong>Regional</strong> Evacuation Studies Program<br />
Figure 1 The <strong>Northeast</strong> <strong>Florida</strong> Region..................................................................... 6<br />
Figure 2 <strong>Northeast</strong> <strong>Florida</strong> Basin Grid .................................................................... 10<br />
Figure 3 SLOSH Grid with Surge Values ................................................................. 10<br />
Figure 4 Digital Elevation from LIDAR.................................................................... 12<br />
Figure 5 SLOSH Display........................................................................................ 13<br />
Figure 6 SLOSH Display Post-Processing ................................................................ 13<br />
Figure 7 Storm Tide Limits for the <strong>Northeast</strong> <strong>Florida</strong> Region .................................... 14<br />
Figure 8 Atlas Map Index...................................................................................... 19<br />
LIST OF MAPS<br />
Map 17…………………………………21<br />
Map 22…………………………………22<br />
Map 23…………………………………23<br />
Map 28…………………………………24<br />
Map 29…………………………………25<br />
Map 30…………………………………26<br />
Map 31…………………………………27<br />
Map 32…………………………………28<br />
Map 33…………………………………29<br />
Map 34…………………………………30<br />
Map 35…………………………………31<br />
Map 36…………………………………32<br />
Map 41…………………………………33<br />
Map 42…………………………………34<br />
Map 43…………………………………35<br />
Map 44…………………………………36<br />
Map 45…………………………………37<br />
Map 46…………………………………38<br />
Map 47…………………………………39<br />
Map 48…………………………………40<br />
Map 49…………………………………41<br />
Map 50…………………………………42<br />
Map 51…………………………………43<br />
Map 56…………………………………44<br />
Map 57…………………………………45<br />
Map 58…………………………………46<br />
Map 59…………………………………47<br />
Map 60…………………………………48<br />
Map 61…………………………………49<br />
Map 62…………………………………50<br />
Map 63…………………………………51<br />
Map 64…………………………………52<br />
Map 65…………………………………53<br />
Map 66…………………………………54<br />
Map 72…………………………………55<br />
Map 73…………………………………56<br />
Map 74…………………………………57<br />
Map 75…………………………………58<br />
Map 76…………………………………59<br />
Map 77…………………………………60<br />
Map 78…………………………………61<br />
Map 79…………………………………62<br />
Map 80…………………………………63<br />
Map 81…………………………………64<br />
Map 82…………………………………65<br />
Map 87…………………………..…….66<br />
Map 88…………………………………67<br />
Map 89…………………………………68<br />
Map 90…………………………………69<br />
Map 91…………………………………70<br />
Map 92…………………………………71<br />
Map 93 ………………………………..72<br />
Volume VII: Storm Tide Atlas Page 3
Volume VII-4 <strong>Northeast</strong> <strong>Florida</strong><br />
LIST OF MAPS (cont.)<br />
Statewide <strong>Regional</strong> Evacuation Studies Program<br />
Map 94………………………………….73<br />
Map 95………………………………….74<br />
Map 96………………………………….75<br />
Map 97………………………………….76<br />
Map 98………………………………….77<br />
Map 102…………………………………78<br />
Map 103…………………………………79<br />
Map 104…………………………………80<br />
Map 105…………………………………81<br />
Map 106…………………………………82<br />
Map 107…………………………………83<br />
Map 108…………………………………84<br />
Map 111…………………………………85<br />
Map 112…………………………………86<br />
Map 113…………………………………87<br />
Map 114…………………………………88<br />
Map 115…………………………………89<br />
Map 116…………………………………90<br />
Map 117…………………………………91<br />
Page 4<br />
Volume VII: Storm Tide Atlas
Volume VII-4 <strong>Northeast</strong> <strong>Florida</strong><br />
Statewide <strong>Regional</strong> Evacuation Studies Program<br />
CREDITS & ACKNOWLEDGEMENTS<br />
Funding was authorized by the <strong>Florida</strong> Legislature through House Bill 7121,<br />
as a result of the 2004 and 2005 hurricane seasons. Provisions of this bill<br />
require the Division of Emergency Management to update all <strong>Regional</strong><br />
Evacuation Studies in the State and inexorably tied the Evacuation Studies<br />
and Growth Management. As a result, this study addresses both<br />
Emergency Management and Growth Management data needs. Funds were<br />
also provided by the Federal Emergency Management Agency (FEMA) with<br />
all money administered through the <strong>Florida</strong> Division of Emergency<br />
Management (FDEM), 2555 Shumard Oak Blvd., Tallahassee, 32399. Web<br />
site: www.floridadisaster.org. Local match was provided by the counties of Baker, Clay, Duval, Flagler,<br />
<strong>Nassau</strong>, Putnam and St. Johns.<br />
The <strong>Council</strong> acknowledges and extends its appreciation to the following agencies and people for their<br />
cooperation and assistance in the development of this Atlas:<br />
National Oceanic and Atmospheric Administration (NOAA/TPC-NHC) for the SLOSH<br />
numerical storm surge model developed by the late Chester L. Jelesnianski, the<br />
development of the 2009 <strong>Northeast</strong> <strong>Florida</strong> Basin under the management of Jamie Rhome,<br />
and for the storm tide computation and interpretation provided by the NOAA Storm Surge<br />
Modeling team. The National Weather Service, Jacksonville office for their participation,<br />
coordination and support.<br />
<strong>Florida</strong> Division of Emergency Management<br />
David Halstead, Director<br />
Sandy Meyer, Hurricane Planning<br />
Manager<br />
Richard Butgereit, GIS Manager<br />
<strong>Northeast</strong> <strong>Florida</strong> <strong>Regional</strong> <strong>Council</strong><br />
Jeffrey Alexander, Statewide Program Manager<br />
<strong>Florida</strong> Emergency Preparedness Association<br />
For their support in this statewide effort<br />
<strong>County</strong> Emergency Management Agencies<br />
Adam Faircloth, Director of Baker <strong>County</strong><br />
Emergency Management<br />
Lorin Mock, Director of Clay <strong>County</strong> Emergency<br />
Management<br />
James Corbin, Former Director of Clay <strong>County</strong><br />
Emergency Management<br />
Martin Senterfitt, Director of Duval <strong>County</strong><br />
Emergency Management<br />
Troy Harper, Director of Flagler <strong>County</strong> Emergency<br />
Management<br />
Tom Kochheiser, Director of <strong>Nassau</strong> <strong>County</strong><br />
Emergency Management<br />
Quin Romay, Director of Putnam <strong>County</strong><br />
Emergency Management<br />
E.R. Ashton, Director of St. Johns <strong>County</strong><br />
Emergency Management<br />
Volume VII: Storm Tide Atlas Page 5
Volume VII-4 <strong>Northeast</strong> <strong>Florida</strong><br />
INTRODUCTION<br />
Statewide <strong>Regional</strong> Evacuation Studies Program<br />
A comprehensive emergency management program requires attention to four (4) key inter-related<br />
components: preparedness, response, recovery and mitigation. Preparing and avoiding or reducing<br />
potential loss of life and property damage - preparedness and mitigation - requires accurate<br />
and precise hazard and vulnerability analyses. These analyses are the foundation for evacuation and<br />
disaster response planning, as well as the development of local mitigation strategies designed to<br />
reduce the community’s overall risk to disasters. This Atlas series provides information to state,<br />
county and local emergency management officials and planners for use in hurricane preparedness<br />
and coastal management in the <strong>Northeast</strong> <strong>Florida</strong> Region including Baker, Clay, Duval, Flagler,<br />
<strong>Nassau</strong>, Putnam and St. Johns counties (Figure 1). It was<br />
part of a statewide effort to enhance our ability to respond<br />
to a hurricane threat, facilitate the evacuation of<br />
vulnerable residents to a point of relative safety and<br />
mitigate our vulnerability in the future. The Statewide<br />
<strong>Regional</strong> Evacuation Study Program provides a<br />
consistent, coordinated and improved approach to<br />
addressing the state and regional vulnerability to the<br />
hurricane threat.<br />
The specific purpose of this Atlas is to provide maps which<br />
depict storm tide heights and the extent of stillwater,<br />
storm surge coastal flooding inundation from hurricanes of<br />
five different intensities in the <strong>Northeast</strong> <strong>Florida</strong> area. The<br />
Atlas was prepared by the <strong>Northeast</strong> <strong>Florida</strong> <strong>Regional</strong><br />
<strong>Council</strong> as part of the Statewide <strong>Regional</strong> Evacuation<br />
Study Program. The Study is a cooperative effort of the<br />
<strong>Florida</strong> Department of Community Affairs, Division of<br />
Emergency Management, the <strong>Florida</strong> <strong>Regional</strong> Planning<br />
<strong>Council</strong>s and the county emergency management<br />
agencies.<br />
Figure 1: The <strong>Northeast</strong> <strong>Florida</strong> Region<br />
Page 6<br />
Volume VII: Storm Tide Atlas
Volume VII-4 <strong>Northeast</strong> <strong>Florida</strong><br />
Statewide <strong>Regional</strong> Evacuation Studies Program<br />
THE SLOSH MODEL<br />
The principal tool utilized in this study for<br />
analyzing the expected hazards from<br />
potential hurricanes affecting the study<br />
area is the Sea, Lake and Overland<br />
Surges from Hurricane (SLOSH)<br />
numerical storm surge prediction model.<br />
The SLOSH computerized model predicts<br />
the storm tide heights that result from<br />
hypothetical hurricanes with selected various combinations of pressure, size, forward speed, track<br />
and winds. Originally developed for use by the National Hurricane Center (NHC) as a tool to give<br />
geographically specific warnings of expected surge heights during the approach of hurricanes, the<br />
SLOSH model is utilized in regional studies for several key hazard and vulnerability analyses.<br />
The SLOSH modeling system consists of the model source code and the model basin or grid. SLOSH<br />
model grids must be developed for each specific geographic coastal area individually incorporating<br />
the unique local bay and river configuration, water depths, bridges, roads and other physical<br />
features. In addition to open coastline heights, one of the most valuable outputs of the SLOSH<br />
model for evacuation planning is its predictions of surge heights over land into inland areas.<br />
The first SLOSH model basin was completed in 1979 and represented the first application of SLOSH<br />
storm surge dynamics to a major coastal area of the United States. The model was developed by<br />
the Techniques Development Lab of the National Oceanic and Atmospheric Administration (NOAA)<br />
under the direction of the late Dr. Chester P. Jelesnianski. In December 1998 the National Hurricane<br />
Center updated the SLOSH model for the <strong>Northeast</strong> <strong>Florida</strong> basin.<br />
Hypothetical Storm Simulations<br />
Surge height depends strongly on the specifics of a given storm including, forward speed, angle of<br />
approach, intensity or maximum wind speed, storm size, storm shape, and landfall location. The<br />
SLOSH model was used to develop data for various combinations of hurricane strength, wind speed,<br />
and direction of movement. Storm strength was modeled using the central pressure (defined as the<br />
difference between the ambient sea level pressure and the minimum value in the storm's center),<br />
the storm eye size and the radius of maximum winds using the five categories of hurricane intensity<br />
as depicted in the Saffir-Simpson Hurricane Wind Scale (see Table 1).<br />
Volume VII: Storm Tide Atlas Page 7
Volume VII-4 <strong>Northeast</strong> <strong>Florida</strong><br />
Statewide <strong>Regional</strong> Evacuation Studies Program<br />
Table 1<br />
Saffir-Simpson Hurricane Wind Scale<br />
Category Wind Speeds Potential Damage<br />
Category 1<br />
Category 2<br />
Category 3<br />
Category 4<br />
Category 5<br />
(Sustained winds 74-95 mph)<br />
(Sustained winds 96-110 mph)<br />
(Sustained winds 111-130 mph )<br />
(Sustained winds 131-155 mph)<br />
(Sustained winds of 156 mph and<br />
above)<br />
Very dangerous winds will produce<br />
some damage<br />
Extremely dangerous winds will cause<br />
extensive damage<br />
Devastating damage will occur<br />
Catastrophic damage will occur<br />
Catastrophic damage will occur<br />
The modeling for each hurricane category was conducted using the mid-range pressure difference<br />
(p, millibars) for that category. The model also simulates the storm filling (weakening upon<br />
landfall) and radius of maximum winds (RMW) increase.<br />
Eleven storm track headings (WSW, W, WNW, NW, NNW, N, NNE, NE, E, ENE, Parallel) were<br />
selected as being representative of storm behavior in the <strong>Northeast</strong> <strong>Florida</strong> region, based on<br />
observations by forecasters at the National Hurricane Center. And for each set of tracks in a specific<br />
direction storms were run at forward speeds of 5, 15 and 25 mph. A total of 1,890 runs were made<br />
consisting of the different parameters shown in Table 2.<br />
Finally, each scenario was run at astronomical high tide. The tide level is now referenced to North<br />
American Vertical Datum of 1988 (NAVD88) as opposed to the National Geodetic Vertical Datum of<br />
1929 (NGVD29) used in the previous study. A datum conversion in a GIS environment was<br />
performed on the SLOSH basin. The existing MOM (in NGVD29) was converted to centroids. The<br />
centroids were then converted to NAVD88 using the conversion tool VertCON – Version 2.1 resulting<br />
in a conversion factor for each centroid. This conversion factor was applied to each SLOSH value in<br />
each category. The new values in the MOM were then saved as a new polygon shape file to be<br />
utilized in processing.<br />
Page 8<br />
Volume VII: Storm Tide Atlas
Volume VII-4 <strong>Northeast</strong> <strong>Florida</strong><br />
Statewide <strong>Regional</strong> Evacuation Studies Program<br />
Table 2 <strong>Northeast</strong> <strong>Florida</strong> Basin Hypothetical Storm Parameters<br />
Directions, speeds, (Saffir/Simpson) intensities, number of tracks and the number of runs.<br />
Direction<br />
Speeds<br />
(mph) Intensity Tides Tracks Runs<br />
WSW 5,15,25<br />
mph<br />
1 through 5<br />
High<br />
13 195<br />
W 5,15,25<br />
mph<br />
WNW 5,15,25<br />
mph<br />
NW 5,15,25<br />
mph<br />
NNW 5,15,25<br />
mph<br />
N 5,15,25<br />
mph<br />
NNE 5,15,25<br />
mph<br />
NE 5,15,25<br />
mph<br />
ENE 5,15,25<br />
mph<br />
E 5,15,25<br />
mph<br />
Parallel 5,15,25<br />
mph<br />
1 through 5 High<br />
1 through 5 High<br />
1 through 5 High<br />
1 through 5 High<br />
1 through 5 High<br />
1 through 5 High<br />
1 through 5 High<br />
1 through 5 High<br />
1 through 5 High<br />
1 through 5 High<br />
13 195<br />
12 180<br />
10 150<br />
11 165<br />
10 150<br />
9 135<br />
11 165<br />
13 195<br />
13 195<br />
11 165<br />
Volume VII: Storm Tide Atlas Page 9
Volume VII-4 <strong>Northeast</strong> <strong>Florida</strong><br />
The Grid for the <strong>Northeast</strong> <strong>Florida</strong> SLOSH Model<br />
Figure 2 illustrates the area covered by the grid for the<br />
<strong>Northeast</strong> <strong>Florida</strong> SLOSH Model. To determine the<br />
surge values the SLOSH model uses a telescoping<br />
hyperbolic grid as its unit of analysis with 83 arc lengths<br />
(1< I> 83) and 95 radials (1< J> 95). Use of the grid<br />
configuration allows for individual calculations per grid<br />
square which is beneficial in two ways: (1) provides<br />
increased resolution of the storm surge at the coastline<br />
and inside the harbors, bays and rivers, while<br />
decreasing the resolution in the deep water where<br />
detail is not as important; and (2) allows economy in<br />
computation.<br />
Statewide <strong>Regional</strong> Evacuation Studies Program<br />
The grid size for the <strong>Northeast</strong> <strong>Florida</strong> model varies<br />
from approximately 0.08 square miles or 52 acres for<br />
grids along the St Johns River to the grids on the outer<br />
edges (within the depths of the Atlantic Ocean) where<br />
each grid is almost 1 square mile.<br />
Figure 2: <strong>Northeast</strong> <strong>Florida</strong> Basin Grid<br />
Storm Scenario Determinations<br />
As indicated, the SLOSH model is the basis for the<br />
"hazard analysis" portion of coastal hurricane<br />
evacuation plans. Nearly two thousand hypothetical<br />
hurricanes are simulated with various Saffir-Simpson<br />
Wind categories, forward speeds, landfall directions,<br />
and landfall locations. An envelope of high water<br />
containing the maximum value a grid cell attains is<br />
generated at the end of each model run. These<br />
envelopes are combined by the NHC into various<br />
composites which depict the possible flooding.<br />
One useful composite is the MEOW (Maximum<br />
Envelopes of Water) which incorporates all the<br />
envelopes for a particular category, speed, and<br />
Figure 3: SLOSH Grid with Surge Values<br />
landfall direction. Once surge heights have been<br />
determined for the appropriate grids, the maximum surge heights are plotted by storm track and<br />
hurricane category. These plots of maximum surge heights for a given storm category and track are<br />
referred to as Maximum Envelopes of Water (MEOWs). The MEOWs or Reference Hurricanes can be<br />
used in evacuation decision making when and if sufficient forecast information is available to project<br />
storm track or type of storm (different landfalling, paralleling, or exiting storms).<br />
Page 10<br />
Volume VII: Storm Tide Atlas
Volume VII-4 <strong>Northeast</strong> <strong>Florida</strong><br />
Statewide <strong>Regional</strong> Evacuation Studies Program<br />
The MEOWs provide information to the emergency managers in evacuation decision making.<br />
However, in order to determine a scenario which may confront the county in a hurricane threat 24-<br />
48 hours before a storm is expected, a further compositing of the MEOWs into Maximums of the<br />
Maximums (MOMs) is usually required.<br />
The MOM (Maximum of the MEOWs) combines all the MEOWs of a particular category. The MOMs<br />
represent the maximum surge expected to occur at any given location, regardless of the specific<br />
storm track/direction of the hurricane. The only variable is the intensity of the hurricane<br />
represented by category strength (Category 1-5).<br />
All SLOSH runs of the hypothetical hurricanes were based on an initial water height of 3.5 feet<br />
Mean Sea Level (MSL) Ocean or 2.0 feet MSL for the rivers and the resulting calculations of storm<br />
surge represent condition at time of high tide. All elevations are now referenced to the NAVD88<br />
datum.<br />
These surge heights were provided within the SLOSH grid system as illustrated on Figure 2. The<br />
range of maximum surge heights (low to high) for each scenario is provided for each category of<br />
storm (MOM) on Table 3. It should be noted again that these surge heights represent the<br />
maximum surge height recorded in the county from the storm tide analysis including<br />
inland and riverine areas where the surge can be magnified dependent upon storm<br />
parameters.<br />
Table 3 Potential Storm Tide Height (s) by <strong>County</strong><br />
(In Feet above NAVD88)<br />
*Storm<br />
Strength<br />
Category 1<br />
Clay Duval Flagler <strong>Nassau</strong> Putnam St. Johns<br />
Up to 3.6’ Up to 6.9’ Up to 6.5’ Up to 7.1’ Up to 4.4’ Up to 6.8’<br />
Category 2 Up to 5.0’ Up to 11.1’ Up to 10.1’ Up to 11.2’ Up to 5.2’ Up to 10.7’<br />
Category 3 Up to 7.2’ Up to 15.1’ Up to 17.2’ Up to 14.9’ Up to 6.7’ Up to 18.2’<br />
Category 4 Up to 8.2’ Up to 20.1’ Up to 19.1’ Up to 19.0’ Up to 7.4’ Up to 22.3’<br />
Category 5 Up to 8.6’ Up to 23.9’ Up to 22.8’ Up to 23.5’ Up to 7.8’ Up to 23.9’<br />
*Based on the category of storm on the Saffir-Simpson Hurricane Wind Scale<br />
** Surge heights represent the maximum values from SLOSH MOMs<br />
Volume VII: Storm Tide Atlas Page 11
Volume VII-4 <strong>Northeast</strong> <strong>Florida</strong><br />
Statewide <strong>Regional</strong> Evacuation Studies Program<br />
CREATION OF THE STORM TIDE ZONES<br />
The maps in this atlas depict SLOSH-modeled heights of storm tide and extent of flood inundation<br />
for hurricanes of five different intensities. As indicate above, the storm tide was modeled using the<br />
Maximum of Maximums (MOMs) representing the potential flooding from the five categories of<br />
storm intensity of the Saffir/Simpson Hurricane Wind Scale.<br />
Determining Storm Tide Height and Flooding Depth<br />
SLOSH and SLOSH-related products reference storm tide<br />
heights relative to the model vertical datum, NAVD88. In<br />
order to determine the inundation depth of surge flooding<br />
at a particular location the ground elevation (relative to<br />
NAVD88) at that location must be subtracted from the<br />
potential surge height. 1<br />
Surge elevation, or water height, is the output of the<br />
SLOSH model. At each SLOSH grid point, the maximum<br />
surge height is computed at that point.<br />
Within the SLOSH model an average elevation is assumed<br />
within each grid square. Height of water above terrain<br />
was not calculated using the SLOSH average grid<br />
elevation because terrain height may vary significantly<br />
within a SLOSH grid square. For example, the altitude of a<br />
1-mile grid square may be assigned a value of 1.8 meters<br />
(6 feet), but this value represents an average of<br />
land heights that may include values ranging from 0.9 to<br />
2.7 meters (3 to 9 feet). In this case, a surge value of Figure 4: Digital Elevation from LIDAR<br />
2.5 meters (8 feet) in this square would imply a 0.7<br />
meters (2 feet) average depth of water over the grid’s terrain. However, in reality within the grid<br />
area portion of the grid would be “dry” and other parts could experience as much as 1.5 meters (5<br />
feet) of inundation. Therefore, in order to determine the storm tide limits, the depth of surge<br />
flooding above terrain at a specific site in the grid square is the result of subtracting the terrain<br />
height determined by remote sensing from the model-generated storm tide height in that grid<br />
square. 2<br />
1 It is important to note that one must use a consistent vertical datum when post-processing SLOSH storm<br />
surge values<br />
2 Note: This represents the regional post-processing procedure. When users view SLOSH output within<br />
the SLOSH Display Program, the system uses average grid cell height when subtracting land.<br />
Page 12<br />
Volume VII: Storm Tide Atlas
Volume VII-4 <strong>Northeast</strong> <strong>Florida</strong><br />
Statewide <strong>Regional</strong> Evacuation Studies Program<br />
Storm Tide Post-Processing<br />
The Atlas was created using a Toolset wrapped into ESRI’s ArcGIS mapping application, ArcMap.<br />
The surge tool was developed for the Statewide <strong>Regional</strong> Evacuation Study Program by the Tampa<br />
Bay <strong>Regional</strong> Planning <strong>Council</strong>, who had used a similar tool for the previous Evacuation Study<br />
Update (2006). This tool enabled all regions within the state of <strong>Florida</strong> to process the SLOSH and<br />
elevation data with a consistent methodology.<br />
The tool basically performs the operation of translating<br />
the lower resolution SLOSH grid data into a smooth<br />
surface resembling actual storm tide and terrain;<br />
processing it with the high resolution elevation data<br />
derived from LIDAR. The image on the left represents<br />
how the data would look as it appears directly from<br />
SLOSH Model output.<br />
Figure 5: SLOSH Display<br />
Processing all the data in the raster realm, the tool is able<br />
to digest large amounts of data and output detailed<br />
representations of surge inundation.<br />
The program first interpolates the SLOSH height values for each category into a raster surface using<br />
spline interpolation. This type of interpolation is best for smooth surfaces, such as water and slow<br />
changing terrain. The result is a raster surface representing the surge height for a category that<br />
can be processed against the raster Digital Elevation Model from the LIDAR. The “dry” values<br />
(represented as 99.9 in the SLOSH Model) are replaced by an average of the inundated grids<br />
surrounding current processed grid. An algorithm<br />
performs this action utilizing the range of values in the<br />
current category of storm being processed.<br />
Using this methodology, once the elevation is<br />
subtracted from the projected storm tide, the storm<br />
tide limits are determined. The output of the tool is a<br />
merged polygon file holding all the maximum<br />
inundation zones for Category 1 through Category 5.<br />
The output, depicted in this Storm Tide Atlas is<br />
determined consistent with the coastal areas<br />
throughout the state.<br />
Figure 7 presents a compilation of the Storm Tide Atlas<br />
for the region.<br />
Figure 6: SLOSH Display Post-Processing<br />
Volume VII: Storm Tide Atlas Page 13
Volume VII-4 <strong>Northeast</strong> <strong>Florida</strong><br />
Statewide <strong>Regional</strong> Evacuation Studies Program<br />
Figure 7: Storm Tide Limits for the <strong>Northeast</strong> <strong>Florida</strong> Region<br />
Page 14<br />
Volume VII: Storm Tide Atlas
Volume VII-4 <strong>Northeast</strong> <strong>Florida</strong><br />
Statewide <strong>Regional</strong> Evacuation Studies Program<br />
VARIATIONS TO CONSIDER<br />
Variations between modeled versus actual measured storm tide elevations are typical of current<br />
technology in coastal storm surge modeling. In interpreting the data emergency planners should<br />
recognize the uncertainties characteristic of mathematical models and severe weather systems such<br />
as hurricanes. The storm tide elevations developed for this study and presented in the Storm Tide<br />
Atlas should be used as guideline information for planning purposes.<br />
Storm Tide & Wave Height<br />
Regarding interpretation of the data, it is important to understand that the configuration and depth<br />
(bathymetry) of the Atlantic Ocean bottom will have a bearing on surge and wave heights. A narrow<br />
shelf, or one that drops steeply from the shoreline and subsequently produces deep water in close<br />
proximity to the shoreline, tends to produce a lower surge but a higher and more powerful wave.<br />
Those regions, like the <strong>Northeast</strong> <strong>Florida</strong> Region, which have a gently sloping shelf and shallower<br />
normal water depths, can expect a higher surge but smaller waves. The reason this occurs is<br />
because a surge in deeper water can be dispersed down and out away from the hurricane.<br />
However, once that surge reaches a shallow gently sloping shelf it can no longer be dispersed away<br />
from the hurricane, consequently water piles up as it is driven ashore by the wind stresses of the<br />
hurricane. Wave height is NOT calculated by the SLOSH model and is not reflected within the storm<br />
tide delineations.<br />
Forward Speed<br />
Under actual storm conditions it may be expected that a hurricane moving at a slower speed could<br />
have higher coastal storm tides than those depicted from model results. At the same time, a fast<br />
moving hurricane would have less time to move storm surge water up river courses to more inland<br />
areas.<br />
Astronomical Tides<br />
Surge heights were provided by NOAA at high tide. The tide level is referenced to North American<br />
Vertical Datum of 1988. The storm tide limits reflect high tide in the region.<br />
Accuracy<br />
As part of the Statewide <strong>Regional</strong> Evacuation Study, all coastal areas as well as areas surrounding<br />
Lake Okeechobee were mapped using remote-sensing laser terrains mapping (LIDAR 3 ) providing<br />
the most comprehensive, accurate and precise topographic data for this analysis. As a general rule,<br />
the vertical accuracy of the laser mapping is within a 15 centimeter tolerance. However, it should<br />
be noted that the accuracy of these elevations is limited to the precision and tolerance in which the<br />
horizontal accuracy for any given point is recorded. Other factors such as artifact removal<br />
algorithms (that remove buildings and trees) can affect the recorded elevation in a particular<br />
location. For the purposes of this study, the horizontal accuracy cannot be assumed to be greater<br />
3 Light Imaging Detection and Ranging<br />
Volume VII: Storm Tide Atlas Page 15
Volume VII-4 <strong>Northeast</strong> <strong>Florida</strong><br />
Statewide <strong>Regional</strong> Evacuation Studies Program<br />
than that of a standard USGS 7 minute quadrangle map, or a scale of 1:24,000.<br />
POINTS OF REFERENCE<br />
<strong>County</strong> emergency management agencies selected reference points which include key facilities or<br />
locations critical for emergency operations. The table below includes the map identification number,<br />
descriptions of the selected points and the elevation of the site. The elevation is based on the digital<br />
elevation data provided by the LIDAR. It should be noted that if the site is large, elevations may<br />
vary significantly. The table also provides the storm tide value from the SLOSH value and the depth<br />
of inundation (storm tide value minus the ground elevation) at the site.<br />
Page 16<br />
Volume VII: Storm Tide Atlas
Volume VII-4 <strong>Northeast</strong> <strong>Florida</strong> Statewide <strong>Regional</strong> Evacuation Studies Program<br />
MAP<br />
ID Name Elevation<br />
Table 4: <strong>Nassau</strong> <strong>County</strong> Selected Points of Reference<br />
C1<br />
DPTH 4<br />
C2<br />
DPTH<br />
C3<br />
DPTH<br />
C4<br />
DPTH<br />
C5<br />
DPTH<br />
C1<br />
SURGE 5<br />
1 St. Mary's River -1.9 7.7 8.7 11.4 14.3 15.9 5.8 6.8 9.5 12.4 14.0<br />
2 Chester -1.0 5.0 7.1 12.1 15.1 21.6 4.0 6.1 11.2 14.2 20.6<br />
3 St. Mary's River -1.9 6.7 9.1 11.9 14.4 20.2 4.8 7.2 10.0 12.5 18.3<br />
4 White Oak Plantation 2.2 0.9 1.2 7.4 9.8 11.8 3.1 3.4 9.6 12.0 14.0<br />
5 St. Mary's River Mouth -2.4 8.5 11.9 15.9 19.9 22.9 6.1 9.5 13.5 17.5 20.5<br />
6 Fort Clinch State Park 11.6 0.0 0.0 2.7 6.5 9.0 6.6 10.6 14.4 18.1 20.6<br />
7 Fernandina -1.9 6.6 9.1 13.5 16.9 22.2 4.7 7.2 11.6 15.0 20.3<br />
8 Shave Bridge -1.9 6.3 10.1 12.8 17.4 22.4 4.4 8.2 10.9 15.5 20.5<br />
9 Sadler Road 6.9 0.0 2.0 6.3 10.0 13.4 5.7 8.9 13.2 16.9 20.3<br />
10 American Beach 14.3 0.0 0.0 0.0 3.6 6.6 6.7 10.5 14.3 17.9 20.9<br />
11 <strong>Nassau</strong>ville 20.3 0.0 0.0 0.0 0.0 0.0 5.1 7.4 11.9 16.1 19.7<br />
12 Lofton Creek -1.9 7.4 9.9 13.0 17.4 21.3 5.5 8.0 11.1 15.5 19.4<br />
13 <strong>Nassau</strong> Sound 5.0 1.9 6.0 9.2 12.3 15.4 6.8 10.9 14.1 17.2 20.3<br />
14 Hedges -1.9 7.4 9.9 12.5 17.3 21.4 5.5 8.0 10.6 15.4 19.5<br />
15 Thomas Creek -0.8 6.7 9.1 11.5 15.8 20.3 5.9 8.3 10.7 15.0 19.6<br />
16 Lannie Road 1.4 4.7 6.7 9.4 14.9 19.6 6.2 8.1 10.9 16.3 21.0<br />
C2<br />
SURGE<br />
C3<br />
SURGE<br />
C4<br />
SURGE<br />
C5<br />
SURGE<br />
4<br />
DPTH refers to the depth of inundation at the site (storm surge value minus the ground elevation)<br />
5<br />
SURGE refers to the storm surge value from the SLOSH Model<br />
Volume VII: Storm Tide Atlas Page 17
Volume VII-4 <strong>Northeast</strong> <strong>Florida</strong><br />
Statewide <strong>Regional</strong> Evacuation Studies Program<br />
STORM TIDE ATLAS<br />
The surge inundation limits (MOM surge heights minus the ground elevations) are provided as GIS<br />
shape files and graphically displayed on maps in the Hurricane Storm Tide Atlas for the <strong>Northeast</strong><br />
<strong>Florida</strong> Region. The Atlas was prepared by <strong>Northeast</strong> <strong>Florida</strong> <strong>Regional</strong> <strong>Council</strong> under contract to the<br />
State of <strong>Florida</strong>, Division of Emergency Management, as part of this study effort. The maps<br />
prepared for the Atlas consist of base maps (1:24000) including topographic, hydrographic and<br />
highway files (updated using 2008 county and state highway data). Detailed shoreline and storm<br />
tide limits for each category of storm were determined using the region's geographic information<br />
system (GIS).<br />
The purpose of the maps contained in this Atlas is to reflect a @worst probable@ scenario of the<br />
hurricane storm tide inundation and to provide a basis for the hurricane evacuation zones and study<br />
analyses. While the storm tide delineations include the addition of an astronomical mean high tide<br />
and tidal anomaly, it should be noted that the data reflects only stillwater saltwater flooding. Local<br />
processes such as waves, rainfall and flooding from overflowing rivers, are usually<br />
included in observations of storm tide height, but are not surge and are not calculated<br />
by the SLOSH model. It is incumbent upon local emergency management officials and<br />
planners to estimate the degree and extent of freshwater flooding as well as to<br />
determine the magnitude of the waves that will accompany the surge.<br />
Figure 8 provides an index of the map series.<br />
Page 18<br />
Volume VII: Storm Tide Atlas
Volume VII-4 <strong>Northeast</strong> <strong>Florida</strong><br />
Statewide <strong>Regional</strong> Evacuation Studies Program<br />
Figure 8 <strong>Nassau</strong> <strong>County</strong> Atlas Map Index<br />
Volume VII: Storm Tide Atlas Page 19
Volume VII-4 <strong>Northeast</strong> <strong>Florida</strong><br />
Statewide <strong>Regional</strong> Evacuation Studies Program<br />
NOTES ON STORM TIDE LIMITS<br />
Historically, the SLOSH storm surge analysis had focused on “average” storm parameters (size and<br />
forward speed), although the intensity and angle of approach was modeled to include direct strikes<br />
and catastrophic intensity. In the 2010 <strong>Regional</strong> Evacuation Study Update, 12,000 hypothetical<br />
hurricanes were included in the SLOSH suite of storms modeled varying forward speeds and the<br />
radii of maximum winds to include the large storm events and different forward speeds. This<br />
allowed for the development of a truer picture of the storm surge vulnerability in the region. The<br />
five categories of hurricane reflect a “worst probable” storm tide limit for hurricanes holding the<br />
wind speed constant (consistent with the Saffir Simpson Hurricane Wind Scale) while varying storm<br />
parameters include size, forward speed, and angle of approach.<br />
This has led to some confusion regarding evacuation decision-making since hurricane evacuations<br />
are based primarily on storm surge vulnerability. The National Oceanic and Atmospheric<br />
Administration (NOAA) is working to enhance the analysis and prediction of storm surge. Direct<br />
estimates of inundation are being communicated in the NHC's Public Advisories and in the Weather<br />
Forecast Office's (WFO) Hurricane Local Statements. NHC's probabilistic storm surge product, which<br />
provides the likelihood of a specific range of storm surge values, became operational in 2009, and<br />
the NWS Meteorological Development Laboratory is providing experimental, probabilistic storm<br />
surge products for 2010. In addition, coastal weather forecast offices will provide experimental<br />
Tropical Cyclone Impacts Graphics in 2010; these include a qualitative graphic on the expected<br />
storm surge impacts. Finally, the NWS is exploring the possibility of issuing explicit Storm Surge<br />
Warnings which could be implemented in the next couple of years. In all of these efforts, the NWS<br />
is working to provide specific and quantitative information to support decision-making at the local<br />
level 1 . NOAA continues to emphasize that the hurricane forecasts are not 100% accurate and<br />
dependent upon many factors.<br />
To the left are the storm tide limits identified for <strong>Nassau</strong> <strong>County</strong> under the five (5) categories of<br />
hurricane on the Saffir Simpson Hurricane Wind Scale. It is<br />
Legend: <strong>Nassau</strong> <strong>County</strong><br />
CATEGORY: OVERALL HGT<br />
1: Up to 7.1 ft<br />
2: Up to 11.2 ft<br />
3: Up to 14.9 ft<br />
4: Up to 19.0 ft<br />
5: Up to 23.5 ft<br />
important to recognize the following:<br />
• The surge tide values represent the highest surge height<br />
elevation above a standard datum (NAVD88) predicted by<br />
the model in the entire county and will only be appropriate<br />
for selected areas.<br />
• Typically the highest surge tide values are NOT the surge<br />
heights predicted at the coast. The highest storm tide<br />
values are typically experienced inside bays and up rivers<br />
and inlets (water above ground).<br />
• Storm Tide ranges by category of storm are presented on<br />
Table 3 on page 11 of this document.<br />
• For surge heights at specific locations, please refer to<br />
Table 4 on page 17 which provides the expected storm<br />
surge elevation at points of reference and the actual<br />
inundation (water depth) at that site.<br />
1 http://www.nhc.noaa.gov/sshws_statement.shtml<br />
Page 20<br />
Volume VII: Storm Tide Atlas
Diamond C Ln<br />
16<br />
81°52'0"W<br />
17<br />
18<br />
81°51'0"W<br />
19<br />
420<br />
81°50'0"W<br />
Acree Rd<br />
33 70 33 70<br />
Thomas Creek<br />
D<br />
17.24 ft<br />
30°27'0"N<br />
69 69<br />
NASSAU COUNTY<br />
30°27'0"N<br />
68 68<br />
Sunowa Springs Trl<br />
30°26'0"N<br />
Corporate Limit 1975<br />
Ford Rd<br />
Corporate Limit 1975<br />
DUVAL COUNTY<br />
67 67<br />
Diamond C Ln<br />
Plummer Rd<br />
Forest Trail Rd<br />
30°26'0"N<br />
Unnamed Street<br />
66 66<br />
33 65 000m. N<br />
30°25'0"N<br />
Unnamed Street<br />
4 16 000m. E<br />
US National Grid<br />
100,000-m Square ID<br />
MP<br />
Grid Zone Designation<br />
17R<br />
Datum = NAD 1983, 1,000-m USNG<br />
Mag. Declination<br />
5 o 41' 24"W<br />
Changing by<br />
4' W per yr<br />
Date 2009<br />
This map is for reference & planning purposes only.<br />
Hurricane evacuation decision-making and growth<br />
management implementation are local responsibilities.<br />
Please consult with local authorities.<br />
#<br />
81°52'0"W<br />
Diagram<br />
Not to Scale<br />
GN<br />
^<br />
17<br />
Notes:<br />
1. Surge limits are based on<br />
still water storm tide height<br />
elevation above NAVD88<br />
at high tide with no wave<br />
setup.<br />
2. Total Storm Tide limits were<br />
derived from Maximum of<br />
Maximums surge heights<br />
over LIDAR based digital<br />
elevation.<br />
3. The Points of Reference are<br />
locations determined to be<br />
relevant to emergency managment<br />
officials.<br />
18<br />
81°51'0"W<br />
ATLAS LEGEND<br />
®v HOSPITAL<br />
%2 Points of Reference<br />
Evacuation Route<br />
City Limits<br />
NHD Lakes<br />
NHD Major Water<br />
Cat<br />
1<br />
2<br />
3<br />
4<br />
5<br />
19<br />
Storm Tide Zones<br />
<strong>Nassau</strong> <strong>County</strong>, 2010<br />
Scale - 1:24,000<br />
Feet<br />
0 2,000<br />
USNG Page 17R MP 16 65<br />
Map Plate 17<br />
Trout River<br />
81°50'0"W<br />
4 20<br />
30°25'0"N<br />
116 117<br />
109 110 111 112 113 114 115<br />
99 100 101 105 106 107 102 103 104 108<br />
83 84 85 86 87 88 89 90 91 92 93 94 95 96 97 98<br />
67 68 69 70 71 72 73 74 75 76 77 78 79 80 81 82<br />
52 53 54 55 56 57 58 59 60 61 62 63 64 65 66<br />
37 38 39 40 41 42 43 44 45 46 47 48 49 50 51<br />
24 25 26 27 28 29 30 31<br />
32 33 34 35 36<br />
18 19 20 21 22 23<br />
12 13 14 15 16 17<br />
7 8 9 10 11<br />
4 5 6<br />
1 2 3<br />
65<br />
Produced by <strong>Northeast</strong> <strong>Florida</strong> <strong>Regional</strong> <strong>Council</strong> for <strong>Florida</strong> Division of Emergency Management, 2009-2010<br />
Page 21<br />
Printed Pages in Yellow
Unnamed Street<br />
Unnamed Street<br />
16<br />
81°52'0"W<br />
17<br />
18<br />
81°51'0"W<br />
19<br />
420<br />
81°50'0"W<br />
Larsen Rd<br />
Thomas Creek Rd<br />
75 75<br />
Larsen Rd<br />
30°30'0"N<br />
30°30'0"N<br />
Unnamed Street<br />
Unnamed Street<br />
74 74<br />
Thomas Creek Rd<br />
Blair Ct<br />
H & H Ln<br />
Evada St<br />
30°29'0"N<br />
Unnamed Street<br />
Meadows Ln<br />
73 73<br />
Meadows St<br />
Unnamed Street<br />
Keen Cemetery Rd<br />
NASSAU COUNTY<br />
Ratliff Rd<br />
Morris Dr<br />
Egger Pl<br />
D<br />
18.5 ft<br />
30°29'0"N<br />
72 72<br />
Harvey Dr<br />
Arenburgh Dr<br />
Ben Branch<br />
Unnamed Street<br />
Sheppard Ln<br />
Larson Rd<br />
Ellis Ave<br />
Crawford Kent Rd<br />
Unnamed S<br />
treet<br />
71 71<br />
30°28'0"N<br />
Pritton Pl<br />
Danson Ln<br />
B and B Dr<br />
Thomas Creek Dr<br />
30°28'0"N<br />
33 70 000m. N<br />
4 16 000m. E<br />
US National Grid<br />
100,000-m Square ID<br />
MP<br />
Grid Zone Designation<br />
17R<br />
Datum = NAD 1983, 1,000-m USNG<br />
Mag. Declination<br />
5 o 41' 24"W<br />
Changing by<br />
4' W per yr<br />
Date 2009<br />
This map is for reference & planning purposes only.<br />
Hurricane evacuation decision-making and growth<br />
management implementation are local responsibilities.<br />
Please consult with local authorities.<br />
81°52'0"W<br />
Produced by <strong>Northeast</strong> <strong>Florida</strong> <strong>Regional</strong> <strong>Council</strong> for <strong>Florida</strong> Division of Emergency Management, 2009-2010<br />
#<br />
Diagram<br />
Not to Scale<br />
GN<br />
^<br />
17<br />
Notes:<br />
1. Surge limits are based on<br />
still water storm tide height<br />
elevation above NAVD88<br />
at high tide with no wave<br />
setup.<br />
2. Total Storm Tide limits were<br />
derived from Maximum of<br />
Maximums surge heights<br />
over LIDAR based digital<br />
elevation.<br />
3. The Points of Reference are<br />
locations determined to be<br />
relevant to emergency managment<br />
officials.<br />
18<br />
ATLAS LEGEND<br />
®v HOSPITAL<br />
%2 Points of Reference<br />
Evacuation Route<br />
City Limits<br />
NHD Lakes<br />
NHD Major Water<br />
Page 22<br />
81°51'0"W<br />
Cat<br />
1<br />
2<br />
3<br />
4<br />
5<br />
DUVAL COUNTY<br />
19<br />
Storm Tide Zones<br />
D<br />
<strong>Nassau</strong> <strong>County</strong>, 2010<br />
Scale - 1:24,000<br />
Feet<br />
0 2,000<br />
USNG Page 17R MP 16 70<br />
Map Plate 22<br />
Thomas Creek<br />
81°50'0"W<br />
4 20<br />
Acree Rd<br />
116 117<br />
109 110 111 112 113 114 115<br />
99 100 101 105 106 107 102 103 104 108<br />
83 84 85 86 87 88 89 90 91 92 93 94 95 96 97 98<br />
67 68 69 70 71 72 73 74 75 76 77 78 79 80 81 82<br />
52 53 54 55 56 57 58 59 60 61 62 63 64 65 66<br />
37 38 39 40 41 42 43 44 45 46 47 48 49 50 51<br />
24 25 26 27 28 29 30 31<br />
32 33 34 35 36<br />
18 19 20 21 22 23<br />
12 13 14 15 16 17<br />
7 8 9 10 11<br />
4 5 6<br />
1 2 3<br />
Printed Pages in Yellow<br />
33 70
420<br />
81°50'0"W<br />
21<br />
81°49'0"W<br />
22<br />
23<br />
81°48'0"W<br />
24<br />
30°30'0"N<br />
Unnamed Street<br />
Unnamed Street<br />
Woodland Hts<br />
Woodridge Dr<br />
Oakwood Ln<br />
Woodland Ave<br />
75 75<br />
Maplewood Ct<br />
Jarrett Rd<br />
Koreys Ln<br />
Riley Rd<br />
£¤ 1<br />
£¤ 1<br />
US Hwy 1<br />
£¤ 1<br />
30°30'0"N<br />
Pinewood Ct<br />
Hilltop Ln<br />
Old Kings Rd<br />
74 74<br />
Woodland Ln<br />
NASSAU COUNTY<br />
Ratliff Rd<br />
Plantation Dr<br />
D<br />
8.43 ft<br />
Thomas Creek<br />
Plantation Dr<br />
73 73<br />
D<br />
18.5 ft<br />
Ben Branch<br />
30°29'0"N<br />
30°29'0"N<br />
Larson Rd<br />
72 72<br />
D<br />
10.7 ft<br />
D<br />
10.82 ft<br />
DUVAL COUNTY<br />
71 71<br />
30°28'0"N<br />
Danson Ln<br />
30°28'0"N<br />
Acree Rd<br />
33 70 000m. N<br />
81°50'0"W<br />
4 20 000m. E<br />
US National Grid<br />
100,000-m Square ID<br />
MP<br />
Grid Zone Designation<br />
17R<br />
Datum = NAD 1983, 1,000-m USNG<br />
Mag. Declination<br />
5 o 41' 24"W<br />
Changing by<br />
4' W per yr<br />
Date 2009<br />
This map is for reference & planning purposes only.<br />
Hurricane evacuation decision-making and growth<br />
management implementation are local responsibilities.<br />
Please consult with local authorities.<br />
#<br />
Diagram<br />
Not to Scale<br />
GN<br />
^<br />
21<br />
Notes:<br />
1. Surge limits are based on<br />
still water storm tide height<br />
elevation above NAVD88<br />
at high tide with no wave<br />
setup.<br />
2. Total Storm Tide limits were<br />
derived from Maximum of<br />
Maximums surge heights<br />
over LIDAR based digital<br />
elevation.<br />
3. The Points of Reference are<br />
locations determined to be<br />
relevant to emergency managment<br />
officials.<br />
81°49'0"W<br />
22<br />
ATLAS LEGEND<br />
®v HOSPITAL<br />
%2 Points of Reference<br />
Evacuation Route<br />
City Limits<br />
NHD Lakes<br />
NHD Major Water<br />
Cat<br />
1<br />
2<br />
3<br />
4<br />
5<br />
23<br />
81°48'0"W<br />
Storm Tide Zones<br />
<strong>Nassau</strong> <strong>County</strong>, 2010<br />
Scale - 1:24,000<br />
Feet<br />
0 2,000<br />
USNG Page 17R MP 20 70<br />
Map Plate 23<br />
24<br />
116 117<br />
109 110 111 112 113 114 115<br />
99 100 101 105 106 107 102 103 104 108<br />
83 84 85 86 87 88 89 90 91 92 93 94 95 96 97 98<br />
67 68 69 70 71 72 73 74 75 76 77 78 79 80 81 82<br />
52 53 54 55 56 57 58 59 60 61 62 63 64 65 66<br />
37 38 39 40 41 42 43 44 45 46 47 48 49 50 51<br />
24 25 26 27 28 29 30 31<br />
32 33 34 35 36<br />
18 19 20 21 22 23<br />
12 13 14 15 16 17<br />
7 8 9 10 11<br />
4 5 6<br />
1 2 3<br />
33 70<br />
Produced by <strong>Northeast</strong> <strong>Florida</strong> <strong>Regional</strong> <strong>Council</strong> for <strong>Florida</strong> Division of Emergency Management, 2009-2010<br />
Page 23<br />
Printed Pages in Yellow
Sandy Ford Rd<br />
Bayberry Ct<br />
Little Sweet Gum Ln<br />
Dales Pl<br />
<strong>Nassau</strong> Ave<br />
16<br />
81°52'0"W<br />
17<br />
18<br />
81°51'0"W<br />
19<br />
420<br />
81°50'0"W<br />
30°33'0"N<br />
Ball Park Rd<br />
33 80 33 80<br />
Bellamy Rd<br />
30°33'0"N<br />
Caleb Ct<br />
Whippoorwill Ln<br />
Commanchee Rd<br />
Unnamed Street<br />
Barber Rd<br />
Caulkins Ln N<br />
79 79<br />
Swallowfork Ave<br />
<strong>Nassau</strong> Ave<br />
Unnamed Street<br />
Unnamed Street<br />
Bryce Ln<br />
Quail Ridge St<br />
Old Baldwin Rd<br />
Sandy F old Rd<br />
Sandy Ford Rd<br />
US Hwy 301<br />
Unnamed Street<br />
NASSAU COUNTY<br />
Unnamed Street<br />
Callahan Ave<br />
30°32'0"N<br />
30°32'0"N<br />
78 78<br />
<strong>Nassau</strong> Ave<br />
Higginbotham Dr<br />
Crawford Industrial Rd<br />
Unnamed Street<br />
Roper Dr<br />
77 77<br />
Unnamed Street<br />
30°31'0"N<br />
30°31'0"N<br />
Unnamed Street<br />
76 76<br />
Dixie Ct<br />
Calico Ct<br />
Thomas Creek Rd<br />
Unnamed Street<br />
Unnamed Street<br />
Larsen Rd<br />
33 75 000m. N<br />
4 16 000m. E<br />
US National Grid<br />
100,000-m Square ID<br />
MP<br />
Grid Zone Designation<br />
17R<br />
Datum = NAD 1983, 1,000-m USNG<br />
Mag. Declination<br />
5 o 41' 24"W<br />
Changing by<br />
4' W per yr<br />
Date 2009<br />
This map is for reference & planning purposes only.<br />
Hurricane evacuation decision-making and growth<br />
management implementation are local responsibilities.<br />
Please consult with local authorities.<br />
#<br />
Diagram<br />
Not to Scale<br />
81°52'0"W<br />
GN<br />
^<br />
17<br />
Notes:<br />
1. Surge limits are based on<br />
still water storm tide height<br />
elevation above NAVD88<br />
at high tide with no wave<br />
setup.<br />
2. Total Storm Tide limits were<br />
derived from Maximum of<br />
Maximums surge heights<br />
over LIDAR based digital<br />
elevation.<br />
3. The Points of Reference are<br />
locations determined to be<br />
relevant to emergency managment<br />
officials.<br />
18<br />
ATLAS LEGEND<br />
®v HOSPITAL<br />
%2 Points of Reference<br />
Evacuation Route<br />
City Limits<br />
NHD Lakes<br />
NHD Major Water<br />
81°51'0"W<br />
Cat<br />
1<br />
2<br />
3<br />
4<br />
5<br />
19<br />
Larsen Rd<br />
Storm Tide Zones<br />
<strong>Nassau</strong> <strong>County</strong>, 2010<br />
Scale - 1:24,000<br />
Feet<br />
0 2,000<br />
USNG Page 17R MP 16 75<br />
Map Plate 28<br />
81°50'0"W<br />
4 20<br />
116 117<br />
109 110 111 112 113 114 115<br />
99 100 101 105 106 107 102 103 104 108<br />
83 84 85 86 87 88 89 90 91 92 93 94 95 96 97 98<br />
67 68 69 70 71 72 73 74 75 76 77 78 79 80 81 82<br />
52 53 54 55 56 57 58 59 60 61 62 63 64 65 66<br />
37 38 39 40 41 42 43 44 45 46 47 48 49 50 51<br />
24 25 26 27 28 29 30 31<br />
32 33 34 35 36<br />
18 19 20 21 22 23<br />
12 13 14 15 16 17<br />
7 8 9 10 11<br />
4 5 6<br />
1 2 3<br />
75<br />
Produced by <strong>Northeast</strong> <strong>Florida</strong> <strong>Regional</strong> <strong>Council</strong> for <strong>Florida</strong> Division of Emergency Management, 2009-2010<br />
Page 24<br />
Printed Pages in Yellow
<strong>Nassau</strong> Ave<br />
Woodland Cir W<br />
Charles St<br />
Sunshine Dr<br />
Plantation Rd<br />
420<br />
81°50'0"W<br />
21<br />
81°49'0"W<br />
22<br />
23<br />
81°48'0"W<br />
24<br />
30°33'0"N<br />
Comandro Rd<br />
Ca ttle B end Ln<br />
Pickett Rd<br />
Bowie Ln<br />
Oak St<br />
Sauls Cir<br />
Sauls Cir<br />
Holm es R d<br />
Holmes Estate Rd<br />
£¤ 1<br />
D anielle Ln<br />
Archer Ln<br />
Rebecca Ln<br />
Bo Blvd<br />
ll Ln<br />
Be<br />
Unnamed Street<br />
Cravey Rd<br />
Wilbur Jones Rd<br />
Owls Nest Ct<br />
State Hwy 115<br />
33 80 33 80<br />
30°33'0"N<br />
£¤ 1 £¤ 1<br />
Lamar Av e<br />
Swallowfork Ave<br />
Bryce Ln<br />
<strong>Nassau</strong> Ave<br />
Maude St<br />
Unna med Street<br />
Cushman Dr<br />
Unnamed S<br />
treet<br />
US Hwy 1<br />
79 79<br />
£¤ 1<br />
Keme Rd<br />
Deer Run Pl<br />
Pinebreeze Blvd<br />
Thomas Creek<br />
Unnamed Street<br />
30°32'0"N<br />
<strong>Nassau</strong> Ave<br />
78 78<br />
Unnamed Street<br />
NASSAU COUNTY<br />
Artesian Blvd<br />
Boekoff Rd<br />
Charwood Dr<br />
McKendree Dr<br />
Wills St<br />
Dairy Rd<br />
Ann Dr<br />
Lee Dr<br />
Becker Ave<br />
Zinnia Ln<br />
Belushi Grove Rd<br />
Church Rd<br />
Cravey Rd<br />
Jacks Pl<br />
30°32'0"N<br />
US Hwy 1<br />
Heron Rd<br />
77 77<br />
Faraway Pl<br />
Pelican Rd<br />
Seagull Dr<br />
30°31'0"N<br />
Unnamed Street<br />
Paulas Ct<br />
Parks Rd<br />
30°31'0"N<br />
76 76<br />
Unnamed Street<br />
Maplewood Ct<br />
Hurst Rd<br />
Caties Way<br />
Hunter R d<br />
Ratliff Rd<br />
RATLIFF<br />
£¤ 1<br />
Roy Booth Rd<br />
33 75 000m. N<br />
81°50'0"W<br />
4 20 000m. E<br />
US National Grid<br />
100,000-m Square ID<br />
MP<br />
Grid Zone Designation<br />
17R<br />
Datum = NAD 1983, 1,000-m USNG<br />
Mag. Declination<br />
5 o 41' 24"W<br />
Changing by<br />
4' W per yr<br />
Date 2009<br />
This map is for reference & planning purposes only.<br />
Hurricane evacuation decision-making and growth<br />
management implementation are local responsibilities.<br />
Please consult with local authorities.<br />
21<br />
Woodridge Dr<br />
Produced by <strong>Northeast</strong> <strong>Florida</strong> <strong>Regional</strong> <strong>Council</strong> for <strong>Florida</strong> Division of Emergency Management, 2009-2010<br />
#<br />
Diagram<br />
Not to Scale<br />
GN<br />
^<br />
Woodland Ave<br />
Notes:<br />
1. Surge limits are based on<br />
still water storm tide height<br />
elevation above NAVD88<br />
at high tide with no wave<br />
setup.<br />
2. Total Storm Tide limits were<br />
derived from Maximum of<br />
Maximums surge heights<br />
over LIDAR based digital<br />
elevation.<br />
3. The Points of Reference are<br />
locations determined to be<br />
relevant to emergency managment<br />
officials.<br />
Oakwood Ln<br />
81°49'0"W<br />
22<br />
ATLAS LEGEND<br />
®v HOSPITAL<br />
%2 Points of Reference<br />
Evacuation Route<br />
City Limits<br />
NHD Lakes<br />
NHD Major Water<br />
Page 25<br />
Jarrett Rd<br />
Cat<br />
1<br />
2<br />
3<br />
4<br />
5<br />
Hen dricks Trl<br />
Thomas Creek<br />
DUVAL COUNTY<br />
23<br />
81°48'0"W<br />
Storm Tide Zones<br />
<strong>Nassau</strong> <strong>County</strong>, 2010<br />
Scale - 1:24,000<br />
Feet<br />
0 2,000<br />
USNG Page 17R MP 20 75<br />
Map Plate 29<br />
24<br />
£¤ 1<br />
116 117<br />
109 110 111 112 113 114 115<br />
99 100 101 105 106 107 102 103 104 108<br />
83 84 85 86 87 88 89 90 91 92 93 94 95 96 97 98<br />
67 68 69 70 71 72 73 74 75 76 77 78 79 80 81 82<br />
52 53 54 55 56 57 58 59 60 61 62 63 64 65 66<br />
37 38 39 40 41 42 43 44 45 46 47 48 49 50 51<br />
24 25 26 27 28 29 30 31<br />
32 33 34 35 36<br />
18 19 20 21 22 23<br />
12 13 14 15 16 17<br />
7 8 9 10 11<br />
4 5 6<br />
1 2 3<br />
Printed Pages in Yellow<br />
75
Sunshine Dr<br />
Plantation Rd<br />
Vikki Rd<br />
Jeannie Rd<br />
24<br />
81°47'0"W<br />
25<br />
26<br />
81°46'0"W<br />
27<br />
28<br />
81°45'0"W<br />
30°33'0"N<br />
33 80 33 80<br />
State Hwy 115<br />
30°33'0"N<br />
Owls Nest Ct<br />
Unnamed Street<br />
Gordon Rd<br />
30°32'0"N<br />
30°31'0"N<br />
Cravey Rd<br />
US Hwy 1<br />
Thomas Creek<br />
Unnamed Street<br />
Jacks Pl<br />
Honeysuckle Ln<br />
Stalvey Matthews Ln<br />
Heron Rd<br />
Pelican Rd<br />
Seagull Dr<br />
Church Rd<br />
Thomas Creek<br />
10.06 ft<br />
76 D<br />
76<br />
£¤ 1 NASSAU COUNTY<br />
Roy Booth Rd<br />
Hall<br />
Flamingo Rd<br />
Point Sout h Dr<br />
Catherine Ct<br />
Sheffield Rd N<br />
Debra Ln<br />
Jessica Pl<br />
Jamie Dr<br />
Charlotte Dr<br />
Jenelle Ct<br />
Hazel Jones Rd<br />
Heller Rd<br />
Jerra Rd<br />
Trooper Ct<br />
Rock Trl<br />
Cornelia Ct<br />
Dornbush Rd<br />
Armstrong Rd S<br />
Michelle Ln<br />
Debbie Ct<br />
Howard Rd<br />
Debbie Rd<br />
Snyder Rd<br />
Edwards Ln<br />
Sheffield Rd<br />
Bea Rd<br />
Armstrong Rd<br />
Marlee Rd<br />
Jonas Dr S<br />
Deerfield Country Club Rd<br />
Dornbush Ave<br />
Lisa Dr<br />
Jonas Dr<br />
Unnamed Street<br />
Jonas Way<br />
Janice Dr<br />
Catherine Dr<br />
Vontz Pl<br />
Snyder Rd<br />
McVey Ln<br />
Maria Ave<br />
Unnamed Street<br />
Cynthia Ave<br />
Larry Ln<br />
Vontz Rd<br />
Fouraker Dr<br />
Lee Stoner Rd E<br />
Fouraker Cir<br />
Ogilvie Rd<br />
D<br />
6.74 ft<br />
U nnamed Street<br />
Unnamed Street<br />
79 79<br />
78 78<br />
77 77<br />
DUVAL COUNTY<br />
Trantham Dr<br />
Lannie Rd<br />
30°32'0"N<br />
30°31'0"N<br />
Lannie Rd<br />
£¤ 1<br />
State Hwy 115<br />
US Hwy 1<br />
33 75 000m. N<br />
£¤ 1<br />
4 24 000m. E<br />
US National Grid<br />
100,000-m Square ID<br />
MP<br />
Grid Zone Designation<br />
17R<br />
Datum = NAD 1983, 1,000-m USNG<br />
Mag. Declination<br />
5 o 41' 24"W<br />
Changing by<br />
4' W per yr<br />
Date 2009<br />
This map is for reference & planning purposes only.<br />
Hurricane evacuation decision-making and growth<br />
management implementation are local responsibilities.<br />
Please consult with local authorities.<br />
#<br />
Diagram<br />
Not to Scale<br />
81°47'0"W<br />
GN<br />
^<br />
25<br />
Notes:<br />
1. Surge limits are based on<br />
still water storm tide height<br />
elevation above NAVD88<br />
at high tide with no wave<br />
setup.<br />
2. Total Storm Tide limits were<br />
derived from Maximum of<br />
Maximums surge heights<br />
over LIDAR based digital<br />
elevation.<br />
3. The Points of Reference are<br />
locations determined to be<br />
relevant to emergency managment<br />
officials.<br />
26<br />
ATLAS LEGEND<br />
®v HOSPITAL<br />
%2 Points of Reference<br />
Evacuation Route<br />
City Limits<br />
NHD Lakes<br />
NHD Major Water<br />
81°46'0"W<br />
Cat<br />
1<br />
2<br />
3<br />
4<br />
5<br />
27<br />
Storm Tide Zones<br />
<strong>Nassau</strong> <strong>County</strong>, 2010<br />
Scale - 1:24,000<br />
Feet<br />
0 2,000<br />
USNG Page 17R MP 24 75<br />
Map Plate 30<br />
81°45'0"W<br />
28<br />
116 117<br />
109 110 111 112 113 114 115<br />
99 100 101 105 106 107 102 103 104 108<br />
83 84 85 86 87 88 89 90 91 92 93 94 95 96 97 98<br />
67 68 69 70 71 72 73 74 75 76 77 78 79 80 81 82<br />
52 53 54 55 56 57 58 59 60 61 62 63 64 65 66<br />
37 38 39 40 41 42 43 44 45 46 47 48 49 50 51<br />
24 25 26 27 28 29 30 31<br />
32 33 34 35 36<br />
18 19 20 21 22 23<br />
12 13 14 15 16 17<br />
7 8 9 10 11<br />
4 5 6<br />
1 2 3<br />
75<br />
Produced by <strong>Northeast</strong> <strong>Florida</strong> <strong>Regional</strong> <strong>Council</strong> for <strong>Florida</strong> Division of Emergency Management, 2009-2010<br />
Page 26<br />
Printed Pages in Yellow
Blyler Rd<br />
Hargett Rd<br />
28<br />
81°45'0"W<br />
29<br />
81°44'0"W<br />
430<br />
31<br />
81°43'0"W<br />
32<br />
30°33'0"N<br />
33 80 33 80<br />
Ogilvie Rd<br />
Ethel Rd<br />
30°33'0"N<br />
Thomas Creek<br />
NASSAU COUNTY<br />
79 79<br />
Unnamed Street<br />
D<br />
%2<br />
2.04 ft<br />
16<br />
30°32'0"N<br />
78 78<br />
Ressie Dr<br />
30°32'0"N<br />
Johannessen Ln<br />
Puskita Trl<br />
Ressie Dr W<br />
Lannie Rd<br />
DUVAL COUNTY<br />
77 77<br />
Younis Rd<br />
Parete Rd<br />
Dewanna Rd<br />
Sears Rd<br />
Younis Rd W<br />
Parete Cir N<br />
Parete Cir E<br />
30°31'0"N<br />
Younis Rd<br />
Parete Rd S<br />
30°31'0"N<br />
76 76<br />
Trantham<br />
Vivaldi Rd S<br />
33 75 000m. N<br />
State Hwy 115<br />
81°45'0"W<br />
4 28 000m. E<br />
US National Grid<br />
100,000-m Square ID<br />
MP<br />
Grid Zone Designation<br />
17R<br />
Datum = NAD 1983, 1,000-m USNG<br />
Mag. Declination<br />
5 o 41' 24"W<br />
Changing by<br />
4' W per yr<br />
Date 2009<br />
This map is for reference & planning purposes only.<br />
Hurricane evacuation decision-making and growth<br />
management implementation are local responsibilities.<br />
Please consult with local authorities.<br />
#<br />
Diagram<br />
Not to Scale<br />
GN<br />
^<br />
29<br />
Notes:<br />
1. Surge limits are based on<br />
still water storm tide height<br />
elevation above NAVD88<br />
at high tide with no wave<br />
setup.<br />
2. Total Storm Tide limits were<br />
derived from Maximum of<br />
Maximums surge heights<br />
over LIDAR based digital<br />
elevation.<br />
3. The Points of Reference are<br />
locations determined to be<br />
relevant to emergency managment<br />
officials.<br />
81°44'0"W<br />
4 30<br />
ATLAS LEGEND<br />
®v HOSPITAL<br />
%2 Points of Reference<br />
Evacuation Route<br />
City Limits<br />
NHD Lakes<br />
NHD Major Water<br />
Cat<br />
1<br />
2<br />
3<br />
4<br />
5<br />
31<br />
81°43'0"W<br />
Storm Tide Zones<br />
<strong>Nassau</strong> <strong>County</strong>, 2010<br />
Scale - 1:24,000<br />
Feet<br />
0 2,000<br />
USNG Page 17R MP 28 75<br />
Map Plate 31<br />
75<br />
32<br />
116 117<br />
109 110 111 112 113 114 115<br />
99 100 101 105 106 107 102 103 104 108<br />
83 84 85 86 87 88 89 90 91 92 93 94 95 96 97 98<br />
67 68 69 70 71 72 73 74 75 76 77 78 79 80 81 82<br />
52 53 54 55 56 57 58 59 60 61 62 63 64 65 66<br />
37 38 39 40 41 42 43 44 45 46 47 48 49 50 51<br />
24 25 26 27 28 29 30 31<br />
32 33 34 35 36<br />
18 19 20 21 22 23<br />
12 13 14 15 16 17<br />
7 8 9 10 11<br />
4 5 6<br />
1 2 3<br />
Produced by <strong>Northeast</strong> <strong>Florida</strong> <strong>Regional</strong> <strong>Council</strong> for <strong>Florida</strong> Division of Emergency Management, 2009-2010<br />
Page 27<br />
Printed Pages in Yellow
Wade Rd<br />
440<br />
81°37'0"W<br />
41<br />
42<br />
81°36'0"W<br />
43<br />
44<br />
81°35'0"W<br />
30°33'0"N<br />
Inconstantion Creek<br />
Eagle Bend Blvd<br />
D orad o Cir<br />
Gum L eaf Rd<br />
Gorham St<br />
Beekman Dr<br />
Elsinore Dr<br />
Eagle Bend Ter<br />
33 80 33 80<br />
NASSAU COUNTY<br />
30°33'0"N<br />
Secondina Rd<br />
79 79<br />
Deese Creek<br />
Yellow Bluff Rd<br />
Satsuma St<br />
Deese Rd<br />
Tisonia Rd<br />
30°32'0"N<br />
78 78<br />
30°32'0"N<br />
Moss Hollow Dr<br />
Northside Dr N<br />
Jim Ct<br />
Northside Dr S<br />
Nort hside Dr W<br />
Clay Rd<br />
DUVAL COUNTY<br />
Herbie Ln<br />
Davidson Farm Rd<br />
Ed Johnson Dr<br />
77 77<br />
Jake Rd<br />
Davidson Farm Rd W<br />
30°31'0"N<br />
Pecan Park Rd<br />
US Hwy 17<br />
Norman Ave<br />
Park Ave<br />
Russell Ave<br />
Kirk Rd<br />
Crystal Sands Dr<br />
76 76<br />
Mahou Rd<br />
30°31'0"N<br />
Sewell Rd<br />
Ed Young<br />
Bird Rd<br />
Marshland Dr<br />
Bernard Rd<br />
33 75 000m. N<br />
4 40 000m. E<br />
US National Grid<br />
100,000-m Square ID<br />
MP<br />
Grid Zone Designation<br />
17R<br />
Datum = NAD 1983, 1,000-m USNG<br />
Mag. Declination<br />
5 o 41' 24"W<br />
Changing by<br />
4' W per yr<br />
Date 2009<br />
This map is for reference & planning purposes only.<br />
Hurricane evacuation decision-making and growth<br />
management implementation are local responsibilities.<br />
Please consult with local authorities.<br />
#<br />
Diagram<br />
Not to Scale<br />
Christen Dr N<br />
81°37'0"W<br />
GN<br />
^<br />
41<br />
Notes:<br />
1. Surge limits are based on<br />
still water storm tide height<br />
elevation above NAVD88<br />
at high tide with no wave<br />
setup.<br />
2. Total Storm Tide limits were<br />
derived from Maximum of<br />
Maximums surge heights<br />
over LIDAR based digital<br />
elevation.<br />
3. The Points of Reference are<br />
locations determined to be<br />
relevant to emergency managment<br />
officials.<br />
42<br />
ATLAS LEGEND<br />
®v HOSPITAL<br />
%2 Points of Reference<br />
Evacuation Route<br />
City Limits<br />
NHD Lakes<br />
NHD Major Water<br />
81°36'0"W<br />
Cat<br />
1<br />
2<br />
3<br />
4<br />
5<br />
43<br />
Storm Tide Zones<br />
<strong>Nassau</strong> <strong>County</strong>, 2010<br />
Scale - 1:24,000<br />
Feet<br />
0 2,000<br />
USNG Page 17R MP 40 75<br />
Map Plate 32<br />
81°35'0"W<br />
44<br />
116 117<br />
109 110 111 112 113 114 115<br />
99 100 101 105 106 107 102 103 104 108<br />
83 84 85 86 87 88 89 90 91 92 93 94 95 96 97 98<br />
67 68 69 70 71 72 73 74 75 76 77 78 79 80 81 82<br />
52 53 54 55 56 57 58 59 60 61 62 63 64 65 66<br />
37 38 39 40 41 42 43 44 45 46 47 48 49 50 51<br />
24 25 26 27 28 29 30 31<br />
32 33 34 35 36<br />
18 19 20 21 22 23<br />
12 13 14 15 16 17<br />
7 8 9 10 11<br />
4 5 6<br />
1 2 3<br />
75<br />
Produced by <strong>Northeast</strong> <strong>Florida</strong> <strong>Regional</strong> <strong>Council</strong> for <strong>Florida</strong> Division of Emergency Management, 2009-2010<br />
Page 28<br />
Printed Pages in Yellow
Tiki Ln<br />
44<br />
81°35'0"W<br />
45<br />
81°34'0"W<br />
46<br />
47<br />
81°33'0"W<br />
48<br />
33 80 33 80<br />
30°33'0"N<br />
30°33'0"N<br />
NASSAU COUNTY<br />
alm Cir W<br />
PPalm Cir S<br />
Duck Lake Dr W<br />
D uck Lake D r E<br />
Live Oak Dr W<br />
79 79<br />
30°32'0"N<br />
78 78<br />
30°32'0"N<br />
Ed Johnson Dr<br />
Burton Creek<br />
Jake Rd<br />
77 77<br />
DUVAL COUNTY<br />
Cape Dr N<br />
30°31'0"N<br />
Mahou Rd<br />
Landmark Cir N<br />
Landm ark C<br />
76 76<br />
ir S<br />
30°31'0"N<br />
Cape Dr S<br />
Yellow Bluff Rd<br />
N Reef Dr<br />
Marshland Dr<br />
W<br />
Reef Dr<br />
Reef Ct<br />
Cape Forest Trl<br />
Cape Dr E<br />
Sunset Landing Dr<br />
33 75 000m. N<br />
81°35'0"W<br />
4 44 000m. E<br />
US National Grid<br />
100,000-m Square ID<br />
MP<br />
Grid Zone Designation<br />
17R<br />
Datum = NAD 1983, 1,000-m USNG<br />
Hidden Creek Dr<br />
Mag. Declination<br />
5 o 41' 24"W<br />
Changing by<br />
4' W per yr<br />
Date 2009<br />
This map is for reference & planning purposes only.<br />
Hurricane evacuation decision-making and growth<br />
management implementation are local responsibilities.<br />
Please consult with local authorities.<br />
Compass Dr<br />
C apstan Dr<br />
Produced by <strong>Northeast</strong> <strong>Florida</strong> <strong>Regional</strong> <strong>Council</strong> for <strong>Florida</strong> Division of Emergency Management, 2009-2010<br />
#<br />
Diagram<br />
Not to Scale<br />
GN<br />
^<br />
45<br />
Cape View Dr<br />
Notes:<br />
1. Surge limits are based on<br />
still water storm tide height<br />
elevation above NAVD88<br />
at high tide with no wave<br />
setup.<br />
2. Total Storm Tide limits were<br />
derived from Maximum of<br />
Maximums surge heights<br />
over LIDAR based digital<br />
elevation.<br />
3. The Points of Reference are<br />
locations determined to be<br />
relevant to emergency managment<br />
officials.<br />
81°34'0"W<br />
46<br />
Amelia Bluff Dr<br />
ATLAS LEGEND<br />
®v HOSPITAL<br />
%2 Points of Reference<br />
Evacuation Route<br />
City Limits<br />
NHD Lakes<br />
NHD Major Water<br />
Page 29<br />
Amelia View Dr<br />
Starratt Creek Dr<br />
Cat<br />
1<br />
2<br />
3<br />
4<br />
5<br />
Edwards Creek Rd<br />
47<br />
81°33'0"W<br />
Storm Tide Zones<br />
<strong>Nassau</strong> <strong>County</strong>, 2010<br />
Scale - 1:24,000<br />
Feet<br />
0 2,000<br />
USNG Page 17R MP 44 75<br />
Map Plate 33<br />
75<br />
48<br />
116 117<br />
109 110 111 112 113 114 115<br />
99 100 101 105 106 107 102 103 104 108<br />
83 84 85 86 87 88 89 90 91 92 93 94 95 96 97 98<br />
67 68 69 70 71 72 73 74 75 76 77 78 79 80 81 82<br />
52 53 54 55 56 57 58 59 60 61 62 63 64 65 66<br />
37 38 39 40 41 42 43 44 45 46 47 48 49 50 51<br />
24 25 26 27 28 29 30 31<br />
32 33 34 35 36<br />
18 19 20 21 22 23<br />
12 13 14 15 16 17<br />
7 8 9 10 11<br />
4 5 6<br />
1 2 3<br />
Printed Pages in Yellow
48<br />
81°32'0"W<br />
49<br />
450<br />
81°31'0"W<br />
51<br />
52<br />
81°30'0"W<br />
Live Oak Dr W<br />
33 80 33 80<br />
30°33'0"N<br />
Winterberry Ave<br />
30°33'0"N<br />
Duck Lak e Dr E<br />
Redbud Ln<br />
79 79<br />
NASSAU COUNTY<br />
1.75 ft<br />
D<br />
1.44<br />
30°32'0"N<br />
78 78<br />
D<br />
ft<br />
30°32'0"N<br />
DUVAL COUNTY<br />
77 77<br />
30°31'0"N<br />
76 76<br />
30°31'0"N<br />
33 75 000m. N<br />
4 48 000m. E<br />
US National Grid<br />
100,000-m Square ID<br />
MP<br />
Grid Zone Designation<br />
17R<br />
Datum = NAD 1983, 1,000-m USNG<br />
Mag. Declination<br />
5 o 41' 24"W<br />
Changing by<br />
4' W per yr<br />
Date 2009<br />
This map is for reference & planning purposes only.<br />
Hurricane evacuation decision-making and growth<br />
management implementation are local responsibilities.<br />
Please consult with local authorities.<br />
#<br />
Diagram<br />
Not to Scale<br />
81°32'0"W<br />
GN<br />
^<br />
49<br />
Notes:<br />
1. Surge limits are based on<br />
still water storm tide height<br />
elevation above NAVD88<br />
at high tide with no wave<br />
setup.<br />
2. Total Storm Tide limits were<br />
derived from Maximum of<br />
Maximums surge heights<br />
over LIDAR based digital<br />
elevation.<br />
3. The Points of Reference are<br />
locations determined to be<br />
relevant to emergency managment<br />
officials.<br />
4 50<br />
ATLAS LEGEND<br />
®v HOSPITAL<br />
%2 Points of Reference<br />
Evacuation Route<br />
City Limits<br />
NHD Lakes<br />
NHD Major Water<br />
81°31'0"W<br />
Cat<br />
1<br />
2<br />
3<br />
4<br />
5<br />
51<br />
Storm Tide Zones<br />
<strong>Nassau</strong> <strong>County</strong>, 2010<br />
Scale - 1:24,000<br />
Feet<br />
0 2,000<br />
USNG Page 17R MP 48 75<br />
Map Plate 34<br />
81°30'0"W<br />
52<br />
116 117<br />
109 110 111 112 113 114 115<br />
99 100 101 105 106 107 102 103 104 108<br />
83 84 85 86 87 88 89 90 91 92 93 94 95 96 97 98<br />
67 68 69 70 71 72 73 74 75 76 77 78 79 80 81 82<br />
52 53 54 55 56 57 58 59 60 61 62 63 64 65 66<br />
37 38 39 40 41 42 43 44 45 46 47 48 49 50 51<br />
24 25 26 27 28 29 30 31<br />
32 33 34 35 36<br />
18 19 20 21 22 23<br />
12 13 14 15 16 17<br />
7 8 9 10 11<br />
4 5 6<br />
1 2 3<br />
75<br />
Produced by <strong>Northeast</strong> <strong>Florida</strong> <strong>Regional</strong> <strong>Council</strong> for <strong>Florida</strong> Division of Emergency Management, 2009-2010<br />
Page 30<br />
Printed Pages in Yellow
52<br />
81°30'0"W<br />
53<br />
81°29'0"W<br />
54<br />
55<br />
81°28'0"W<br />
56<br />
33 80 33 80<br />
30°33'0"N<br />
30°33'0"N<br />
Marsh Creek Rd<br />
79 79<br />
NASSAU COUNTY<br />
Waterville Rd<br />
30°32'0"N<br />
78 78<br />
30°32'0"N<br />
Baker Ln N<br />
Baker Ln<br />
Cherokee Hammock Ln<br />
Red Bass Dr<br />
Mangels Ln<br />
Croaker Rd<br />
Sawpit Rd<br />
Trouble Ln<br />
Shellcracker Rd<br />
Yogi Bear Ln<br />
77 77<br />
S hark Rd<br />
Franderson Ln<br />
DUVAL COUNTY<br />
30°31'0"N<br />
S hark Rd W<br />
Flounder Rd<br />
76 76<br />
Iris Lee Ln<br />
30°31'0"N<br />
Shark Rd E<br />
Bream Rd<br />
Shark Rd<br />
State Hwy 105<br />
Sawpit Rd<br />
33 75 000m. N<br />
81°30'0"W<br />
4 52 000m. E<br />
US National Grid<br />
100,000-m Square ID<br />
MP<br />
Grid Zone Designation<br />
17R<br />
Datum = NAD 1983, 1,000-m USNG<br />
Mag. Declination<br />
5 o 41' 24"W<br />
Changing by<br />
4' W per yr<br />
Date 2009<br />
This map is for reference & planning purposes only.<br />
Hurricane evacuation decision-making and growth<br />
management implementation are local responsibilities.<br />
Please consult with local authorities.<br />
Produced by <strong>Northeast</strong> <strong>Florida</strong> <strong>Regional</strong> <strong>Council</strong> for <strong>Florida</strong> Division of Emergency Management, 2009-2010<br />
#<br />
Diagram<br />
Not to Scale<br />
GN<br />
^<br />
53<br />
Notes:<br />
1. Surge limits are based on<br />
still water storm tide height<br />
elevation above NAVD88<br />
at high tide with no wave<br />
setup.<br />
2. Total Storm Tide limits were<br />
derived from Maximum of<br />
Maximums surge heights<br />
over LIDAR based digital<br />
elevation.<br />
3. The Points of Reference are<br />
locations determined to be<br />
relevant to emergency managment<br />
officials.<br />
81°29'0"W<br />
54<br />
ATLAS LEGEND<br />
®v HOSPITAL<br />
%2 Points of Reference<br />
Evacuation Route<br />
City Limits<br />
NHD Lakes<br />
NHD Major Water<br />
Page 31<br />
Cape Dr E<br />
Cat<br />
1<br />
2<br />
3<br />
4<br />
5<br />
55<br />
81°28'0"W<br />
Storm Tide Zones<br />
<strong>Nassau</strong> <strong>County</strong>, 2010<br />
Scale - 1:24,000<br />
Feet<br />
0 2,000<br />
USNG Page 17R MP 52 75<br />
Map Plate 35<br />
75<br />
56<br />
116 117<br />
109 110 111 112 113 114 115<br />
99 100 101 105 106 107 102 103 104 108<br />
83 84 85 86 87 88 89 90 91 92 93 94 95 96 97 98<br />
67 68 69 70 71 72 73 74 75 76 77 78 79 80 81 82<br />
52 53 54 55 56 57 58 59 60 61 62 63 64 65 66<br />
37 38 39 40 41 42 43 44 45 46 47 48 49 50 51<br />
24 25 26 27 28 29 30 31<br />
32 33 34 35 36<br />
18 19 20 21 22 23<br />
12 13 14 15 16 17<br />
7 8 9 10 11<br />
4 5 6<br />
1 2 3<br />
Printed Pages in Yellow
56<br />
81°27'0"W<br />
57<br />
58<br />
81°26'0"W<br />
59<br />
460<br />
81°25'0"W<br />
Royal Tern Rd<br />
33 80 33 80<br />
Painted Bunting<br />
30°33'0"N<br />
Marsh Creek Rd<br />
Unnamed Street<br />
Dunes Ct<br />
30°33'0"N<br />
Marsh Hawk Rd<br />
Beach Walker Rd<br />
State Hwy 105<br />
Marsh Po<br />
79 79<br />
int Rd<br />
Dunes Row<br />
Oak Point Dr<br />
Salt Marsh Dr<br />
Amelia Retreat<br />
Juniper Dr<br />
30°32'0"N<br />
78 78<br />
Sound Point Pl<br />
NASSAU COUNTY<br />
30°32'0"N<br />
Long Point Dr<br />
Sanct u ary Ln<br />
Residence Ct<br />
77 77<br />
30°31'0"N<br />
State Hwy 105<br />
DUVAL COUNTY<br />
%2<br />
13<br />
76 76<br />
30°31'0"N<br />
33 75 000m. N<br />
4 56 000m. E<br />
US National Grid<br />
100,000-m Square ID<br />
MP<br />
Grid Zone Designation<br />
17R<br />
Datum = NAD 1983, 1,000-m USNG<br />
Mag. Declination<br />
5 o 41' 24"W<br />
Changing by<br />
4' W per yr<br />
Date 2009<br />
This map is for reference & planning purposes only.<br />
Hurricane evacuation decision-making and growth<br />
management implementation are local responsibilities.<br />
Please consult with local authorities.<br />
#<br />
Diagram<br />
Not to Scale<br />
81°27'0"W<br />
GN<br />
^<br />
57<br />
Notes:<br />
1. Surge limits are based on<br />
still water storm tide height<br />
elevation above NAVD88<br />
at high tide with no wave<br />
setup.<br />
2. Total Storm Tide limits were<br />
derived from Maximum of<br />
Maximums surge heights<br />
over LIDAR based digital<br />
elevation.<br />
3. The Points of Reference are<br />
locations determined to be<br />
relevant to emergency managment<br />
officials.<br />
58<br />
ATLAS LEGEND<br />
®v HOSPITAL<br />
%2 Points of Reference<br />
Evacuation Route<br />
City Limits<br />
NHD Lakes<br />
NHD Major Water<br />
81°26'0"W<br />
Cat<br />
1<br />
2<br />
3<br />
4<br />
5<br />
59<br />
Storm Tide Zones<br />
<strong>Nassau</strong> <strong>County</strong>, 2010<br />
Scale - 1:24,000<br />
Feet<br />
0 2,000<br />
USNG Page 17R MP 56 75<br />
Map Plate 36<br />
81°25'0"W<br />
4 60<br />
116 117<br />
109 110 111 112 113 114 115<br />
99 100 101 105 106 107 102 103 104 108<br />
83 84 85 86 87 88 89 90 91 92 93 94 95 96 97 98<br />
67 68 69 70 71 72 73 74 75 76 77 78 79 80 81 82<br />
52 53 54 55 56 57 58 59 60 61 62 63 64 65 66<br />
37 38 39 40 41 42 43 44 45 46 47 48 49 50 51<br />
24 25 26 27 28 29 30 31<br />
32 33 34 35 36<br />
18 19 20 21 22 23<br />
12 13 14 15 16 17<br />
7 8 9 10 11<br />
4 5 6<br />
1 2 3<br />
75<br />
Produced by <strong>Northeast</strong> <strong>Florida</strong> <strong>Regional</strong> <strong>Council</strong> for <strong>Florida</strong> Division of Emergency Management, 2009-2010<br />
Page 32<br />
Printed Pages in Yellow
Lance Rd<br />
Karen Rd<br />
Barbara Rd<br />
Whitfield Rd<br />
<strong>Nassau</strong> Ave<br />
16<br />
17<br />
81°52'0"W<br />
18<br />
81°51'0"W<br />
19<br />
420<br />
81°50'0"W<br />
Matthews Pl<br />
85 85<br />
Zidell Rd<br />
Henry Ln<br />
Unnamed Street<br />
30°35'0"N<br />
Tackel Ln<br />
84 84<br />
Keri Blvd<br />
Old Dixie Hwy<br />
Iris Blvd<br />
Gail Dr<br />
Unnamed Street<br />
Keer Blvd<br />
30°35'0"N<br />
Old Dump Rd<br />
Keer Blvd<br />
Gail Dr<br />
Hill Rd<br />
30°34'0"N<br />
Quail Rd<br />
83 83<br />
Browns Farm Rd<br />
Aspen Way<br />
NASSAU COUNTY<br />
82 82<br />
Unnamed Street<br />
Blume Rd<br />
Wardlaw Pass<br />
R Jones Rd<br />
Smith Ln<br />
l<br />
Ar<br />
Morgan Cir<br />
ine R d<br />
Arline<br />
Sandra Ln<br />
Woodlaw Cir<br />
Johnson R d<br />
Roberts Rd<br />
White Rd<br />
US Hwy 1<br />
Alligator Creek<br />
£¤ 1 £¤ 1<br />
Oak St<br />
30°34'0"N<br />
Bennie Hill Rd<br />
New Ogilvie Rd<br />
33 80 000m.<br />
30°33'0"N N<br />
Keith Rd<br />
Ball Park Rd<br />
4 16 000m. E<br />
Sherry Rd<br />
81°52'0"W<br />
Goodbread Rd<br />
Carlisle Pl<br />
Nancy Rd<br />
Timiquan Ave<br />
17<br />
Hathaway Dr<br />
Jones Cemetary Rd<br />
Coquina Way<br />
<strong>County</strong> Hwy 108<br />
81 81<br />
US National Grid<br />
100,000-m Square ID<br />
MP<br />
Grid Zone Designation<br />
17R<br />
Datum = NAD 1983, 1,000-m USNG<br />
Mag. Declination<br />
5 o 41' 24"W<br />
Changing by<br />
4' W per yr<br />
Date 2009<br />
This map is for reference & planning purposes only.<br />
Hurricane evacuation decision-making and growth<br />
management implementation are local responsibilities.<br />
Please consult with local authorities.<br />
Produced by <strong>Northeast</strong> <strong>Florida</strong> <strong>Regional</strong> <strong>Council</strong> for <strong>Florida</strong> Division of Emergency Management, 2009-2010<br />
#<br />
Diagram<br />
Not to Scale<br />
GN<br />
^<br />
Notes:<br />
1. Surge limits are based on<br />
still water storm tide height<br />
elevation above NAVD88<br />
at high tide with no wave<br />
setup.<br />
2. Total Storm Tide limits were<br />
derived from Maximum of<br />
Maximums surge heights<br />
over LIDAR based digital<br />
elevation.<br />
3. The Points of Reference are<br />
locations determined to be<br />
relevant to emergency managment<br />
officials.<br />
18<br />
Caleb Ct<br />
ATLAS LEGEND<br />
®v HOSPITAL<br />
%2 Points of Reference<br />
Evacuation Route<br />
City Limits<br />
NHD Lakes<br />
NHD Major Water<br />
Page 33<br />
81°51'0"W<br />
Cat<br />
1<br />
2<br />
3<br />
4<br />
5<br />
U nnamed Street<br />
Knot Lndg<br />
19<br />
US Hwy 301<br />
Spurlock Ln<br />
O ak Trl<br />
Storm Tide Zones<br />
<strong>Nassau</strong> <strong>County</strong>, 2010<br />
Scale - 1:24,000<br />
Feet<br />
0 2,000<br />
USNG Page 17R MP 16 80<br />
Map Plate 41<br />
Flynn Rd<br />
Commanche Rd<br />
Oak Trl<br />
83<br />
67<br />
84<br />
68<br />
85<br />
69<br />
7 8 9 10 11<br />
4 5 6<br />
1 2 3<br />
86<br />
70<br />
Dixie Ave<br />
<strong>Nassau</strong> St<br />
87<br />
71<br />
88<br />
72<br />
52 53 54 55 56 57<br />
37 38 39 40 41 42<br />
24 25 26 27 28 29<br />
18 19 20 21 22 23<br />
12 13 14 15 16 17<br />
Green Ave<br />
Pickett Rd<br />
81°50'0"W<br />
4 20<br />
116 117<br />
109 110 111 112 113 114 115<br />
99 100 101 105 106 107 102 103 104 108<br />
89<br />
73<br />
90<br />
74<br />
58<br />
43<br />
30<br />
91 92<br />
75 76<br />
59 60<br />
44 45<br />
31<br />
93<br />
77<br />
61<br />
46<br />
94<br />
78<br />
62<br />
47<br />
32<br />
95<br />
79<br />
63<br />
48<br />
33<br />
Printed Pages in Yellow<br />
96<br />
80<br />
64<br />
49<br />
34<br />
97<br />
81<br />
65<br />
50<br />
35<br />
30°33'0"N<br />
98<br />
82<br />
66<br />
51<br />
36<br />
33 80
<strong>Nassau</strong> Ave<br />
Circle Dr<br />
Cook Dr<br />
420<br />
81°50'0"W<br />
21<br />
81°49'0"W<br />
22<br />
23<br />
81°48'0"W<br />
24<br />
£¤ 1 £¤ 1<br />
85 85<br />
Middle Rd<br />
Davis Rd<br />
Dimaria Dr<br />
Jewel Thomas Rd<br />
Pittman Rd<br />
Eula B Rd<br />
Jones Way<br />
G ressman Dairy Rd<br />
Hill Rd<br />
Keer Blvd<br />
Zidell Rd<br />
£¤ 1<br />
Unnamed Street<br />
Unnamed Street<br />
84 84<br />
Petree Rd<br />
Higginbotham Ave<br />
James<br />
State Hwy 200<br />
30°35'0"N<br />
30°35'0"N<br />
Zwiefel Rd<br />
£¤ 1 £¤ 1<br />
Hill Rd<br />
83<br />
3.79 ft<br />
83<br />
D<br />
Roberts Rd<br />
US Hwy 1<br />
Alligator Creek<br />
Johnson Rd<br />
Rhoden Ln<br />
Oak St<br />
Stratton Rd<br />
NASSAU COUNTY<br />
82 82<br />
6.45 ft<br />
D<br />
CALLAHAN<br />
£¤ 1<br />
30°34'0"N<br />
<strong>County</strong> Hwy 108<br />
Dixie Ave<br />
<strong>Nassau</strong> St<br />
N Booth St<br />
Green Ave<br />
US Hwy 301<br />
Warrior Dr<br />
Railroad St<br />
Railroad Ave<br />
Booth St<br />
3rd St W<br />
Page St<br />
Mickler St S<br />
Marvin St<br />
Thomas St<br />
James St<br />
Clemmons Rd<br />
Hodges Rd<br />
Edison Pl<br />
Bismark Ln<br />
Circle Dr<br />
Irvin Rd<br />
Revere St<br />
Bismark Rd<br />
Burgess Rd<br />
Karma Ln<br />
Yellow J acket Dr<br />
81 81<br />
30°34'0"N<br />
Kilpatrick Rd<br />
Pine St<br />
3rd Ave<br />
5th Ave<br />
6th St<br />
S Brown St<br />
Music Ln<br />
Haden Way<br />
Marsh Rd<br />
Spring Lake Dr<br />
Ambrose Cir<br />
Gator Ln<br />
Hart Ter<br />
33 80 000m.<br />
30°33'0"N N<br />
Pickett Rd<br />
81°50'0"W<br />
4 20 000m. E<br />
US National Grid<br />
100,000-m Square ID<br />
MP<br />
Grid Zone Designation<br />
17R<br />
Datum = NAD 1983, 1,000-m USNG<br />
Ca ttle B end Ln<br />
Mag. Declination<br />
5 o 41' 24"W<br />
Changing by<br />
4' W per yr<br />
Date 2009<br />
This map is for reference & planning purposes only.<br />
Hurricane evacuation decision-making and growth<br />
management implementation are local responsibilities.<br />
Please consult with local authorities.<br />
#<br />
Sauls Cir<br />
Diagram<br />
Not to Scale<br />
GN<br />
^<br />
Crocket Pl<br />
Pickett Rd<br />
21<br />
Louranah Ln<br />
Rebecca<br />
Notes:<br />
1. Surge limits are based on<br />
still water storm tide height<br />
elevation above NAVD88<br />
at high tide with no wave<br />
setup.<br />
2. Total Storm Tide limits were<br />
derived from Maximum of<br />
Maximums surge heights<br />
over LIDAR based digital<br />
elevation.<br />
3. The Points of Reference are<br />
locations determined to be<br />
relevant to emergency managment<br />
officials.<br />
81°49'0"W<br />
22<br />
Bell Ln<br />
ATLAS LEGEND<br />
®v HOSPITAL<br />
%2 Points of Reference<br />
Evacuation Route<br />
City Limits<br />
NHD Lakes<br />
NHD Major Water<br />
Cat<br />
1<br />
2<br />
3<br />
4<br />
5<br />
23<br />
Cravey Rd<br />
81°48'0"W<br />
Storm Tide Zones<br />
<strong>Nassau</strong> <strong>County</strong>, 2010<br />
Scale - 1:24,000<br />
Feet<br />
0 2,000<br />
USNG Page 17R MP 20 80<br />
Map Plate 42<br />
State Hwy 115<br />
24<br />
30°33'0"N<br />
116 117<br />
109 110 111 112 113 114 115<br />
99 100 101 105 106 107 102 103 104 108<br />
83 84 85 86 87 88 89 90 91 92 93 94 95 96 97 98<br />
67 68 69 70 71 72 73 74 75 76 77 78 79 80 81 82<br />
52 53 54 55 56 57 58 59 60 61 62 63 64 65 66<br />
37 38 39 40 41 42 43 44 45 46 47 48 49 50 51<br />
24 25 26 27 28 29 30 31<br />
32 33 34 35 36<br />
18 19 20 21 22 23<br />
12 13 14 15 16 17<br />
7 8 9 10 11<br />
4 5 6<br />
1 2 3<br />
33 80<br />
Produced by <strong>Northeast</strong> <strong>Florida</strong> <strong>Regional</strong> <strong>Council</strong> for <strong>Florida</strong> Division of Emergency Management, 2009-2010<br />
Page 34<br />
Printed Pages in Yellow
24<br />
25<br />
81°47'0"W<br />
26<br />
81°46'0"W<br />
27<br />
28<br />
81°45'0"W<br />
85 85<br />
Dimaria Dr<br />
Mount Olive Rd<br />
Jewel Thomas Rd<br />
Thomas Rd<br />
Pittman Rd<br />
State Hwy 200<br />
Zwiefel Rd<br />
Unnamed Street<br />
84 84<br />
D<br />
8.47 ft<br />
30°35'0"N<br />
Alligator Creek<br />
30°35'0"N<br />
D<br />
1.17 ft<br />
Unnamed Street<br />
83 83<br />
Nascar Dr<br />
Pacetti Rd<br />
NASSAU COUNTY<br />
Terrell Farms Rd<br />
Spencerville Rd<br />
82 82<br />
30°34'0"N<br />
Bismark Rd<br />
J Dav<br />
is Trl<br />
Unnamed Street<br />
30°34'0"N<br />
Shug Rd<br />
Hive Ln<br />
Deer Run Rd<br />
Yellow Jacket Dr<br />
Deer Run Dr<br />
Unnamed Street<br />
81 81<br />
D<br />
15.26 ft<br />
Cypress Ct<br />
Dog w ood Ct<br />
Spring Lake Dr<br />
33 80 000m.<br />
30°33'0"N N<br />
State Hwy 115<br />
4 24 000m. E<br />
US National Grid<br />
100,000-m Square ID<br />
MP<br />
Grid Zone Designation<br />
17R<br />
Datum = NAD 1983, 1,000-m USNG<br />
Mag. Declination<br />
5 o 41' 24"W<br />
Changing by<br />
4' W per yr<br />
Date 2009<br />
This map is for reference & planning purposes only.<br />
Hurricane evacuation decision-making and growth<br />
management implementation are local responsibilities.<br />
Please consult with local authorities.<br />
#<br />
Diagram<br />
Not to Scale<br />
81°47'0"W<br />
GN<br />
^<br />
25<br />
Notes:<br />
1. Surge limits are based on<br />
still water storm tide height<br />
elevation above NAVD88<br />
at high tide with no wave<br />
setup.<br />
2. Total Storm Tide limits were<br />
derived from Maximum of<br />
Maximums surge heights<br />
over LIDAR based digital<br />
elevation.<br />
3. The Points of Reference are<br />
locations determined to be<br />
relevant to emergency managment<br />
officials.<br />
26<br />
ATLAS LEGEND<br />
®v HOSPITAL<br />
%2 Points of Reference<br />
Evacuation Route<br />
City Limits<br />
NHD Lakes<br />
NHD Major Water<br />
81°46'0"W<br />
Cat<br />
1<br />
2<br />
3<br />
4<br />
5<br />
27<br />
Storm Tide Zones<br />
<strong>Nassau</strong> <strong>County</strong>, 2010<br />
Scale - 1:24,000<br />
Feet<br />
0 2,000<br />
USNG Page 17R MP 24 80<br />
Map Plate 43<br />
Ogilvie Rd<br />
81°45'0"W<br />
28<br />
30°33'0"N<br />
116 117<br />
109 110 111 112 113 114 115<br />
99 100 101 105 106 107 102 103 104 108<br />
83 84 85 86 87 88 89 90 91 92 93 94 95 96 97 98<br />
67 68 69 70 71 72 73 74 75 76 77 78 79 80 81 82<br />
52 53 54 55 56 57 58 59 60 61 62 63 64 65 66<br />
37 38 39 40 41 42 43 44 45 46 47 48 49 50 51<br />
24 25 26 27 28 29 30 31<br />
32 33 34 35 36<br />
18 19 20 21 22 23<br />
12 13 14 15 16 17<br />
7 8 9 10 11<br />
4 5 6<br />
1 2 3<br />
33 80<br />
Produced by <strong>Northeast</strong> <strong>Florida</strong> <strong>Regional</strong> <strong>Council</strong> for <strong>Florida</strong> Division of Emergency Management, 2009-2010<br />
Page 35<br />
Printed Pages in Yellow
Ogilvie Rd<br />
28<br />
81°45'0"W<br />
29<br />
81°44'0"W<br />
430<br />
31<br />
81°43'0"W<br />
32<br />
85 85<br />
84 84<br />
Alligator Creek<br />
30°35'0"N<br />
30°35'0"N<br />
83 83<br />
Pacetti Rd<br />
NASSAU COUNTY<br />
Unnamed Street<br />
D<br />
8.64 ft<br />
82 82<br />
Thomas Creek<br />
30°34'0"N<br />
30°34'0"N<br />
%2<br />
D<br />
81 81<br />
D<br />
1.35 ft<br />
DUVAL COUNTY<br />
Unnamed Street<br />
Chaddy Ln<br />
33<br />
30°33'0"N 80 000m. N<br />
81°45'0"W<br />
4 28 000m. E<br />
US National Grid<br />
100,000-m Square ID<br />
MP<br />
Grid Zone Designation<br />
17R<br />
Datum = NAD 1983, 1,000-m USNG<br />
Unnamed Street<br />
Mag. Declination<br />
5 o 41' 24"W<br />
Changing by<br />
4' W per yr<br />
Date 2009<br />
This map is for reference & planning purposes only.<br />
Hurricane evacuation decision-making and growth<br />
management implementation are local responsibilities.<br />
Please consult with local authorities.<br />
#<br />
Diagram<br />
Not to Scale<br />
GN<br />
^<br />
29<br />
Notes:<br />
1. Surge limits are based on<br />
still water storm tide height<br />
elevation above NAVD88<br />
at high tide with no wave<br />
setup.<br />
2. Total Storm Tide limits were<br />
derived from Maximum of<br />
Maximums surge heights<br />
over LIDAR based digital<br />
elevation.<br />
3. The Points of Reference are<br />
locations determined to be<br />
relevant to emergency managment<br />
officials.<br />
81°44'0"W<br />
Ethel Rd<br />
4 30<br />
ATLAS LEGEND<br />
®v HOSPITAL<br />
%2 Points of Reference<br />
Evacuation Route<br />
City Limits<br />
NHD Lakes<br />
NHD Major Water<br />
Cat<br />
1<br />
2<br />
3<br />
4<br />
5<br />
31<br />
81°43'0"W<br />
Storm Tide Zones<br />
<strong>Nassau</strong> <strong>County</strong>, 2010<br />
Scale - 1:24,000<br />
Feet<br />
0 2,000<br />
USNG Page 17R MP 28 80<br />
Map Plate 44<br />
Lannie Rd<br />
32<br />
30°33'0"N<br />
116 117<br />
109 110 111 112 113 114 115<br />
99 100 101 105 106 107 102 103 104 108<br />
83 84 85 86 87 88 89 90 91 92 93 94 95 96 97 98<br />
67 68 69 70 71 72 73 74 75 76 77 78 79 80 81 82<br />
52 53 54 55 56 57 58 59 60 61 62 63 64 65 66<br />
37 38 39 40 41 42 43 44 45 46 47 48 49 50 51<br />
24 25 26 27 28 29 30 31<br />
32 33 34 35 36<br />
18 19 20 21 22 23<br />
12 13 14 15 16 17<br />
7 8 9 10 11<br />
4 5 6<br />
1 2 3<br />
33 80<br />
Produced by <strong>Northeast</strong> <strong>Florida</strong> <strong>Regional</strong> <strong>Council</strong> for <strong>Florida</strong> Division of Emergency Management, 2009-2010<br />
Page 36<br />
Printed Pages in Yellow
32<br />
81°42'0"W<br />
33<br />
34<br />
81°41'0"W<br />
35<br />
36<br />
81°40'0"W<br />
Police Lodge Rd<br />
85 85<br />
Royal Palm Dr<br />
Edwards Rd<br />
Randy Rd<br />
Newell Rd<br />
Edwards St<br />
D<br />
1.78 ft<br />
Mills Creek<br />
84 84<br />
30°35'0"N<br />
Alligator Creek<br />
30°35'0"N<br />
NASSAU COUNTY<br />
83 83<br />
<strong>Nassau</strong> River<br />
Unnamed Street<br />
82 82<br />
30°34'0"N<br />
Thomas Creek<br />
30°34'0"N<br />
%2<br />
15<br />
D<br />
2.21 ft<br />
81 81<br />
DUVAL COUNTY<br />
Chaddy Ln<br />
33<br />
30°33'0"N 80 000m. N<br />
4 32 000m. E<br />
US National Grid<br />
100,000-m Square ID<br />
MP<br />
Grid Zone Designation<br />
17R<br />
Datum = NAD 1983, 1,000-m USNG<br />
Mag. Declination<br />
5 o 41' 24"W<br />
Changing by<br />
4' W per yr<br />
Date 2009<br />
This map is for reference & planning purposes only.<br />
Hurricane evacuation decision-making and growth<br />
management implementation are local responsibilities.<br />
Please consult with local authorities.<br />
#<br />
Lannie Rd<br />
Diagram<br />
Not to Scale<br />
81°42'0"W<br />
GN<br />
^<br />
33<br />
Notes:<br />
1. Surge limits are based on<br />
still water storm tide height<br />
elevation above NAVD88<br />
at high tide with no wave<br />
setup.<br />
2. Total Storm Tide limits were<br />
derived from Maximum of<br />
Maximums surge heights<br />
over LIDAR based digital<br />
elevation.<br />
3. The Points of Reference are<br />
locations determined to be<br />
relevant to emergency managment<br />
officials.<br />
34<br />
ATLAS LEGEND<br />
®v HOSPITAL<br />
%2 Points of Reference<br />
Evacuation Route<br />
City Limits<br />
NHD Lakes<br />
NHD Major Water<br />
81°41'0"W<br />
Cat<br />
1<br />
2<br />
3<br />
4<br />
5<br />
35<br />
Storm Tide Zones<br />
<strong>Nassau</strong> <strong>County</strong>, 2010<br />
Scale - 1:24,000<br />
Feet<br />
0 2,000<br />
USNG Page 17R MP 32 80<br />
Map Plate 45<br />
81°40'0"W<br />
36<br />
30°33'0"N<br />
116 117<br />
109 110 111 112 113 114 115<br />
99 100 101 105 106 107 102 103 104 108<br />
83 84 85 86 87 88 89 90 91 92 93 94 95 96 97 98<br />
67 68 69 70 71 72 73 74 75 76 77 78 79 80 81 82<br />
52 53 54 55 56 57 58 59 60 61 62 63 64 65 66<br />
37 38 39 40 41 42 43 44 45 46 47 48 49 50 51<br />
24 25 26 27 28 29 30 31<br />
32 33 34 35 36<br />
18 19 20 21 22 23<br />
12 13 14 15 16 17<br />
7 8 9 10 11<br />
4 5 6<br />
1 2 3<br />
33 80<br />
Produced by <strong>Northeast</strong> <strong>Florida</strong> <strong>Regional</strong> <strong>Council</strong> for <strong>Florida</strong> Division of Emergency Management, 2009-2010<br />
Page 37<br />
Printed Pages in Yellow
36<br />
81°40'0"W<br />
37<br />
81°39'0"W<br />
38<br />
39<br />
81°38'0"W<br />
440<br />
85 85<br />
Unnamed Street<br />
Mentoria Rd<br />
30°35'0"N<br />
Randy R d<br />
Edwards St<br />
Newell Rd<br />
NASSAU COUNTY<br />
Plummer Creek<br />
Plummer Creek<br />
84 84<br />
I 95<br />
§¨¦ 95<br />
83 83<br />
§¨¦ 95<br />
§¨¦ 95<br />
30°35'0"N<br />
30°34'0"N<br />
D<br />
2.97 ft<br />
I 95 I 95<br />
82 82<br />
§¨¦ 95<br />
30°34'0"N<br />
DUVAL COUNTY<br />
Inconstantion Creek<br />
81 81<br />
Thomas C reek<br />
I 95<br />
Seato n Creek<br />
33<br />
30°33'0"N 80 000m. N<br />
81°40'0"W<br />
4 36 000m. E<br />
US National Grid<br />
100,000-m Square ID<br />
MP<br />
Grid Zone Designation<br />
17R<br />
Datum = NAD 1983, 1,000-m USNG<br />
Mag. Declination<br />
5 o 41' 24"W<br />
Changing by<br />
4' W per yr<br />
Date 2009<br />
This map is for reference & planning purposes only.<br />
Hurricane evacuation decision-making and growth<br />
management implementation are local responsibilities.<br />
Please consult with local authorities.<br />
#<br />
Diagram<br />
Not to Scale<br />
GN<br />
^<br />
37<br />
Notes:<br />
1. Surge limits are based on<br />
still water storm tide height<br />
elevation above NAVD88<br />
at high tide with no wave<br />
setup.<br />
2. Total Storm Tide limits were<br />
derived from Maximum of<br />
Maximums surge heights<br />
over LIDAR based digital<br />
elevation.<br />
3. The Points of Reference are<br />
locations determined to be<br />
relevant to emergency managment<br />
officials.<br />
81°39'0"W<br />
38<br />
ATLAS LEGEND<br />
®v HOSPITAL<br />
%2 Points of Reference<br />
Evacuation Route<br />
City Limits<br />
NHD Lakes<br />
NHD Major Water<br />
Cat<br />
1<br />
2<br />
3<br />
4<br />
5<br />
39<br />
81°38'0"W<br />
Storm Tide Zones<br />
<strong>Nassau</strong> <strong>County</strong>, 2010<br />
Scale - 1:24,000<br />
Feet<br />
0 2,000<br />
USNG Page 17R MP 36 80<br />
Map Plate 46<br />
4 40<br />
30°33'0"N<br />
116 117<br />
109 110 111 112 113 114 115<br />
99 100 101 105 106 107 102 103 104 108<br />
83 84 85 86 87 88 89 90 91 92 93 94 95 96 97 98<br />
67 68 69 70 71 72 73 74 75 76 77 78 79 80 81 82<br />
52 53 54 55 56 57 58 59 60 61 62 63 64 65 66<br />
37 38 39 40 41 42 43 44 45 46 47 48 49 50 51<br />
24 25 26 27 28 29 30 31<br />
32 33 34 35 36<br />
18 19 20 21 22 23<br />
12 13 14 15 16 17<br />
7 8 9 10 11<br />
4 5 6<br />
1 2 3<br />
33 80<br />
Produced by <strong>Northeast</strong> <strong>Florida</strong> <strong>Regional</strong> <strong>Council</strong> for <strong>Florida</strong> Division of Emergency Management, 2009-2010<br />
Page 38<br />
Printed Pages in Yellow
440<br />
81°37'0"W<br />
41<br />
42<br />
81°36'0"W<br />
43<br />
44<br />
81°35'0"W<br />
Telephone Ln<br />
Broo ke St<br />
85 85<br />
Crady Lake Dr<br />
Harts Rd<br />
Windy Oaks Ln<br />
Alene Rd<br />
Theresa Ave<br />
Joann Rd<br />
E Harts Rd<br />
Madeline Rd<br />
Lindsey Kay Ct<br />
Lumber Creek<br />
Eady Ln<br />
Haddock Rd<br />
David Rd<br />
84 84<br />
Harts Ln<br />
Casey Trl<br />
Oak Grove Pl<br />
Wilson Neck Rd<br />
Lana Ct<br />
Lana Ct N<br />
Lana Rd<br />
30°35'0"N<br />
D<br />
2.35 ft<br />
US Hwy 17<br />
Claxton Rd<br />
NASSAU COUNTY<br />
83 83<br />
Derrick Rd<br />
Sara Rd<br />
Faye Rd<br />
Alger Rd<br />
Claxton Rd S<br />
Deleene Rd<br />
30°35'0"N<br />
%2<br />
14<br />
D<br />
1.54 ft<br />
82 82<br />
30°34'0"N<br />
US Hwy 17<br />
Lankford Ave<br />
Schlosser's Path<br />
30°34'0"N<br />
81 81<br />
Montessa Ter<br />
33<br />
30°33'0"N 80 000m. N<br />
4 40 000m. E<br />
US National Grid<br />
100,000-m Square ID<br />
MP<br />
Grid Zone Designation<br />
17R<br />
Datum = NAD 1983, 1,000-m USNG<br />
Mag. Declination<br />
5 o 41' 24"W<br />
Changing by<br />
4' W per yr<br />
Date 2009<br />
This map is for reference & planning purposes only.<br />
Hurricane evacuation decision-making and growth<br />
management implementation are local responsibilities.<br />
Please consult with local authorities.<br />
Inconstantion Creek<br />
81°37'0"W<br />
Produced by <strong>Northeast</strong> <strong>Florida</strong> <strong>Regional</strong> <strong>Council</strong> for <strong>Florida</strong> Division of Emergency Management, 2009-2010<br />
#<br />
Diagram<br />
Not to Scale<br />
GN<br />
^<br />
41<br />
Notes:<br />
1. Surge limits are based on<br />
still water storm tide height<br />
elevation above NAVD88<br />
at high tide with no wave<br />
setup.<br />
2. Total Storm Tide limits were<br />
derived from Maximum of<br />
Maximums surge heights<br />
over LIDAR based digital<br />
elevation.<br />
3. The Points of Reference are<br />
locations determined to be<br />
relevant to emergency managment<br />
officials.<br />
42<br />
Dorado Cir<br />
River Isle Cir<br />
ATLAS LEGEND<br />
®v HOSPITAL<br />
%2 Points of Reference<br />
Evacuation Route<br />
City Limits<br />
NHD Lakes<br />
NHD Major Water<br />
Page 39<br />
Eagle Bend Blvd<br />
Eagle Bend Ct<br />
DUVAL COUNTY<br />
Gorham St<br />
81°36'0"W<br />
Cat<br />
1<br />
2<br />
3<br />
4<br />
5<br />
Aruba Ct<br />
Holmes Mill Ave<br />
43<br />
Eagle Bend Ter<br />
Storm Tide Zones<br />
<strong>Nassau</strong> <strong>County</strong>, 2010<br />
Scale - 1:24,000<br />
Feet<br />
0 2,000<br />
USNG Page 17R MP 40 80<br />
Map Plate 47<br />
81°35'0"W<br />
44<br />
30°33'0"N<br />
116 117<br />
109 110 111 112 113 114 115<br />
99 100 101 105 106 107 102 103 104 108<br />
83 84 85 86 87 88 89 90 91 92 93 94 95 96 97 98<br />
67 68 69 70 71 72 73 74 75 76 77 78 79 80 81 82<br />
52 53 54 55 56 57 58 59 60 61 62 63 64 65 66<br />
37 38 39 40 41 42 43 44 45 46 47 48 49 50 51<br />
24 25 26 27 28 29 30 31<br />
32 33 34 35 36<br />
18 19 20 21 22 23<br />
12 13 14 15 16 17<br />
7 8 9 10 11<br />
4 5 6<br />
1 2 3<br />
Printed Pages in Yellow<br />
33 80
Loflon St<br />
Gregory Ave<br />
Karen Walk<br />
44<br />
81°35'0"W<br />
45<br />
81°34'0"W<br />
46<br />
47<br />
81°33'0"W<br />
48<br />
85 85<br />
Alene Rd<br />
Theresa Ave<br />
Joann Rd<br />
Haddock Rd<br />
Dick King Rd<br />
Blackmon Rd<br />
Unnamed Street<br />
Unnamed Street<br />
Madeline Rd<br />
Phillips Rd<br />
Amanda Ct<br />
David Rd<br />
Lana Ct N<br />
Angie Rd<br />
Lana Ct<br />
Stephen Rd<br />
David Rd<br />
84 84<br />
Wilson Neck Rd<br />
Lana Rd<br />
30°35'0"N<br />
Sara Rd<br />
Faye Rd<br />
Alger Rd<br />
Claxton Rd S<br />
Deleene Rd<br />
Linda Rd<br />
Elise Rd S<br />
Wesley Rd<br />
Elise Rd<br />
Avant Rd<br />
83 83<br />
Stevens Rd<br />
30°35'0"N<br />
Jamie Rd<br />
Elise Rd W<br />
%2<br />
12<br />
3.23 ft<br />
D<br />
8.19<br />
NASSAU COUNTY<br />
Unnamed Street<br />
Mobley Heights Rd<br />
82 82<br />
Crews Rd<br />
30°34'0"N<br />
Burmeister Ct<br />
Lil William Rd<br />
Lonnie Crews Rd<br />
Unnamed Street<br />
Patricia Ct<br />
30°34'0"N<br />
DUVAL COUNTY<br />
81 81<br />
D<br />
ft<br />
Lina Ct<br />
Lina Rd<br />
Burmeister Rd<br />
Owens Rd<br />
Live Oak Dr<br />
Unnamed Street<br />
Linda Hall Rd<br />
Cook Rd<br />
Shubert Rd<br />
33<br />
30°33'0"N 80 000m. N<br />
81°35'0"W<br />
4 44 000m. E<br />
US National Grid<br />
100,000-m Square ID<br />
MP<br />
Grid Zone Designation<br />
17R<br />
Datum = NAD 1983, 1,000-m USNG<br />
Mag. Declination<br />
5 o 41' 24"W<br />
Changing by<br />
4' W per yr<br />
Date 2009<br />
This map is for reference & planning purposes only.<br />
Hurricane evacuation decision-making and growth<br />
management implementation are local responsibilities.<br />
Please consult with local authorities.<br />
#<br />
Diagram<br />
Not to Scale<br />
GN<br />
^<br />
45<br />
Notes:<br />
1. Surge limits are based on<br />
still water storm tide height<br />
elevation above NAVD88<br />
at high tide with no wave<br />
setup.<br />
2. Total Storm Tide limits were<br />
derived from Maximum of<br />
Maximums surge heights<br />
over LIDAR based digital<br />
elevation.<br />
3. The Points of Reference are<br />
locations determined to be<br />
relevant to emergency managment<br />
officials.<br />
81°34'0"W<br />
46<br />
ATLAS LEGEND<br />
®v HOSPITAL<br />
%2 Points of Reference<br />
Evacuation Route<br />
City Limits<br />
NHD Lakes<br />
NHD Major Water<br />
Cat<br />
1<br />
2<br />
3<br />
4<br />
5<br />
47<br />
81°33'0"W<br />
Storm Tide Zones<br />
<strong>Nassau</strong> <strong>County</strong>, 2010<br />
Scale - 1:24,000<br />
Feet<br />
0 2,000<br />
USNG Page 17R MP 44 80<br />
Map Plate 48<br />
Spoonbill Way<br />
Duck Lake Dr E<br />
Live Oak Dr W<br />
48<br />
30°33'0"N<br />
116 117<br />
109 110 111 112 113 114 115<br />
99 100 101 105 106 107 102 103 104 108<br />
83 84 85 86 87 88 89 90 91 92 93 94 95 96 97 98<br />
67 68 69 70 71 72 73 74 75 76 77 78 79 80 81 82<br />
52 53 54 55 56 57 58 59 60 61 62 63 64 65 66<br />
37 38 39 40 41 42 43 44 45 46 47 48 49 50 51<br />
24 25 26 27 28 29 30 31<br />
32 33 34 35 36<br />
18 19 20 21 22 23<br />
12 13 14 15 16 17<br />
7 8 9 10 11<br />
4 5 6<br />
1 2 3<br />
33 80<br />
Produced by <strong>Northeast</strong> <strong>Florida</strong> <strong>Regional</strong> <strong>Council</strong> for <strong>Florida</strong> Division of Emergency Management, 2009-2010<br />
Page 40<br />
Printed Pages in Yellow
Karen Walk<br />
Barbaras Pl<br />
Plum Dr E<br />
Hatton Rd<br />
48<br />
81°32'0"W<br />
49<br />
450<br />
81°31'0"W<br />
51<br />
52<br />
81°30'0"W<br />
Marc Anthony Rd<br />
85 85<br />
Unnamed Street<br />
Frank Ward Rd<br />
Terra Cotta Way<br />
Tammy Trl<br />
Unnamed Street<br />
84 84<br />
Blue Ln<br />
Plum Dr N<br />
Wildwood Dr<br />
30°35'0"N<br />
Stevens Rd<br />
Louise Ct<br />
Richard Dr<br />
D aph n e Dr<br />
Hendricks Rd<br />
30°35'0"N<br />
Oriole St<br />
Loushel Tony Rd<br />
Plum Dr W<br />
Dwight Dr<br />
Leo Dr<br />
Dirt Rd<br />
83 83<br />
NASSAU COUNTY<br />
Big Oak Ln<br />
Tyson Rd<br />
Alligator Creek Rd<br />
Rainbow Acres Rd<br />
Unnamed Street<br />
Gregory Ave<br />
Crews Rd<br />
Douglas Rd<br />
Clearwater Rd<br />
Springhill Rd S<br />
Santa Juana Rd<br />
Wilder St<br />
Denise St<br />
Ellis Landing Rd<br />
%2<br />
11<br />
State Hwy 107-A<br />
Gerald Cir<br />
Wilder Blvd<br />
<strong>Nassau</strong> River Rd<br />
Jessica<br />
Seymore Point Rd<br />
82 82<br />
Oren<br />
Goffinsville Rd<br />
30°34'0"N<br />
Unnamed Street<br />
Lonnie Crews Rd<br />
30°34'0"N<br />
Mobley Heights Rd<br />
Patricia Ct<br />
Owens Rd<br />
Cook Rd<br />
State Hwy 107<br />
81 81<br />
Albert Way<br />
DUVAL COUNTY<br />
Lanier Rd<br />
Live Oak Dr<br />
Bennett Ave<br />
33<br />
30°33'0"N 80 000m. N<br />
Duck Lake Dr E<br />
Live Oak Dr W<br />
4 48 000m. E<br />
Hickory Dr<br />
US National Grid<br />
100,000-m Square ID<br />
MP<br />
Grid Zone Designation<br />
17R<br />
Datum = NAD 1983, 1,000-m USNG<br />
Mag. Declination<br />
5 o 41' 24"W<br />
Changing by<br />
4' W per yr<br />
Date 2009<br />
This map is for reference & planning purposes only.<br />
Hurricane evacuation decision-making and growth<br />
management implementation are local responsibilities.<br />
Please consult with local authorities.<br />
#<br />
Diagram<br />
Not to Scale<br />
81°32'0"W<br />
GN<br />
^<br />
49<br />
Notes:<br />
1. Surge limits are based on<br />
still water storm tide height<br />
elevation above NAVD88<br />
at high tide with no wave<br />
setup.<br />
2. Total Storm Tide limits were<br />
derived from Maximum of<br />
Maximums surge heights<br />
over LIDAR based digital<br />
elevation.<br />
3. The Points of Reference are<br />
locations determined to be<br />
relevant to emergency managment<br />
officials.<br />
4 50<br />
ATLAS LEGEND<br />
®v HOSPITAL<br />
%2 Points of Reference<br />
Evacuation Route<br />
City Limits<br />
NHD Lakes<br />
NHD Major Water<br />
81°31'0"W<br />
Cat<br />
1<br />
2<br />
3<br />
4<br />
5<br />
51<br />
Storm Tide Zones<br />
<strong>Nassau</strong> <strong>County</strong>, 2010<br />
Scale - 1:24,000<br />
Feet<br />
0 2,000<br />
USNG Page 17R MP 48 80<br />
Map Plate 49<br />
81°30'0"W<br />
52<br />
116 117<br />
109 110 111 112 113 114 115<br />
99 100 101 105 106 107 102 103 104 108<br />
83 84 85 86 87 88 89 90 91 92 93 94 95 96 97 98<br />
67 68 69 70 71 72 73 74 75 76 77 78 79 80 81 82<br />
52 53 54 55 56 57 58 59 60 61 62 63 64 65 66<br />
37 38 39 40 41 42 43 44 45 46 47 48 49 50 51<br />
24 25 26 27 28 29 30 31<br />
32 33 34 35 36<br />
18 19 20 21 22 23<br />
12 13 14 15 16 17<br />
7 8 9 10 11<br />
4 5 6<br />
1 2 3<br />
33 80<br />
Produced by <strong>Northeast</strong> <strong>Florida</strong> <strong>Regional</strong> <strong>Council</strong> for <strong>Florida</strong> Division of Emergency Management, 2009-2010<br />
Page 41<br />
Printed Pages in Yellow
52<br />
81°30'0"W<br />
53<br />
81°29'0"W<br />
54<br />
55<br />
81°28'0"W<br />
56<br />
85 85<br />
State Hwy 105A<br />
Glynwoods Ct<br />
U nnamed S treet<br />
AMELIA CITY<br />
Forrest Dr<br />
State Hwy A1A<br />
State Hwy 105<br />
Bluff Rd<br />
84 84<br />
Manucy Rd<br />
Old Bluff Rd<br />
Quattlefield Ln<br />
30°35'0"N<br />
30°35'0"N<br />
83 83<br />
NASSAU COUNTY<br />
Florence Point Dr<br />
Alligator Creek Rd<br />
Seymore Point Rd<br />
82 82<br />
O ren<br />
Seymore Ln<br />
30°34'0"N<br />
30°34'0"N<br />
Sweetwater Oaks Dr<br />
Live Oak<br />
Sea Marsh Rd<br />
81 81<br />
DUVAL COUNTY<br />
33 80 000m. N<br />
81°30'0"W<br />
4 52 000m. E<br />
US National Grid<br />
100,000-m Square ID<br />
MP<br />
Grid Zone Designation<br />
17R<br />
Datum = NAD 1983, 1,000-m USNG<br />
Mag. Declination<br />
5 o 41' 24"W<br />
Changing by<br />
4' W per yr<br />
Date 2009<br />
This map is for reference & planning purposes only.<br />
Hurricane evacuation decision-making and growth<br />
management implementation are local responsibilities.<br />
Please consult with local authorities.<br />
#<br />
Diagram<br />
Not to Scale<br />
GN<br />
^<br />
53<br />
Notes:<br />
1. Surge limits are based on<br />
still water storm tide height<br />
elevation above NAVD88<br />
at high tide with no wave<br />
setup.<br />
2. Total Storm Tide limits were<br />
derived from Maximum of<br />
Maximums surge heights<br />
over LIDAR based digital<br />
elevation.<br />
3. The Points of Reference are<br />
locations determined to be<br />
relevant to emergency managment<br />
officials.<br />
81°29'0"W<br />
54<br />
ATLAS LEGEND<br />
®v HOSPITAL<br />
%2 Points of Reference<br />
Evacuation Route<br />
City Limits<br />
NHD Lakes<br />
NHD Major Water<br />
Cat<br />
1<br />
2<br />
3<br />
4<br />
5<br />
55<br />
81°28'0"W<br />
Storm Tide Zones<br />
<strong>Nassau</strong> <strong>County</strong>, 2010<br />
Scale - 1:24,000<br />
Feet<br />
0 2,000<br />
USNG Page 17R MP 52 80<br />
Map Plate 50<br />
Marsh Creek Rd<br />
56<br />
116 117<br />
109 110 111 112 113 114 115<br />
99 100 101 105 106 107 102 103 104 108<br />
83 84 85 86 87 88 89 90 91 92 93 94 95 96 97 98<br />
67 68 69 70 71 72 73 74 75 76 77 78 79 80 81 82<br />
52 53 54 55 56 57 58 59 60 61 62 63 64 65 66<br />
37 38 39 40 41 42 43 44 45 46 47 48 49 50 51<br />
24 25 26 27 28 29 30 31<br />
32 33 34 35 36<br />
18 19 20 21 22 23<br />
12 13 14 15 16 17<br />
7 8 9 10 11<br />
4 5 6<br />
1 2 3<br />
33 80<br />
Produced by <strong>Northeast</strong> <strong>Florida</strong> <strong>Regional</strong> <strong>Council</strong> for <strong>Florida</strong> Division of Emergency Management, 2009-2010<br />
Page 42<br />
Printed Pages in Yellow
Lee St<br />
Ervin St<br />
Price St<br />
56<br />
81°27'0"W<br />
57<br />
58<br />
81°26'0"W<br />
59<br />
460<br />
81°25'0"W<br />
85 85<br />
State Hwy 105A<br />
Glynwoods Ct<br />
Philips Manor Rd<br />
State Hwy A1A<br />
Genoa Dr<br />
Amelia Island Pkwy<br />
30°35'0"N<br />
Gerbing Rd<br />
Forrest Dr<br />
Manucy Rd<br />
Old Bluff Rd<br />
Quattlefield Ln<br />
Florence Point Dr<br />
Harrison Point Trl<br />
AMELIA CITY<br />
Plantation Oaks Ln<br />
Plantation Point Dr<br />
Moss Oaks Dr<br />
Island Ln<br />
Leeward Cove Dr<br />
Rigging Way<br />
Windward Pl<br />
Sandpiper Ct<br />
Karen St<br />
Orange Ave<br />
Rig ging Dr<br />
Ocean Fo rest Dr<br />
Anthony St<br />
Regina Ave<br />
Maxine St<br />
Avery Rd<br />
Ian Dr<br />
Scott Rd<br />
Stewart Ave<br />
%2<br />
AMERICAN BEACH<br />
Julia St<br />
Lewis St<br />
Unnamed S<br />
Regatta Dr<br />
Why Rd<br />
Elderberry Rd<br />
Auger Ln<br />
Sabel Palm Dr<br />
Fish Hawk Dr<br />
treet<br />
Burnlex Blvd<br />
Arbor Dr<br />
Ocean Village Pl<br />
Summer Beach Blvd<br />
Scott Dr<br />
Unnamed Street<br />
Sea Chase Dr<br />
Ocean Blvd<br />
Sea Watch Dr<br />
84 84<br />
Atlantic Way<br />
Outrigger Dr<br />
83 83<br />
Burney Rd<br />
NASSAU COUNTY<br />
Greeg St<br />
10<br />
82 82<br />
30°35'0"N<br />
Hickory Ln<br />
Laurel Oak Rd<br />
Wild Grape Dr<br />
Foxtail Rd<br />
30°34'0"N<br />
30°34'0"N<br />
Wax Myrtle Rd<br />
Live Oak<br />
Water Oak<br />
Red Maple Rd<br />
Lakehouse Ct<br />
Beachwood Rd<br />
81 81<br />
Sea Marsh Cv<br />
Sea Marsh Rd<br />
State Hwy 105<br />
Marsh Creek Rd<br />
Captains Ct<br />
33 80 000m. N<br />
4 56 000m. E<br />
US National Grid<br />
100,000-m Square ID<br />
MP<br />
Grid Zone Designation<br />
17R<br />
Datum = NAD 1983, 1,000-m USNG<br />
Royal Tern Rd<br />
Mag. Declination<br />
5 o 41' 24"W<br />
Changing by<br />
4' W per yr<br />
Date 2009<br />
This map is for reference & planning purposes only.<br />
Hurricane evacuation decision-making and growth<br />
management implementation are local responsibilities.<br />
Please consult with local authorities.<br />
#<br />
Diagram<br />
Not to Scale<br />
81°27'0"W<br />
GN<br />
^<br />
57<br />
Wood Duck Rd<br />
Notes:<br />
1. Surge limits are based on<br />
still water storm tide height<br />
elevation above NAVD88<br />
at high tide with no wave<br />
setup.<br />
2. Total Storm Tide limits were<br />
derived from Maximum of<br />
Maximums surge heights<br />
over LIDAR based digital<br />
elevation.<br />
3. The Points of Reference are<br />
locations determined to be<br />
relevant to emergency managment<br />
officials.<br />
58<br />
ATLAS LEGEND<br />
®v HOSPITAL<br />
%2 Points of Reference<br />
Evacuation Route<br />
City Limits<br />
NHD Lakes<br />
NHD Major Water<br />
81°26'0"W<br />
Cat<br />
1<br />
2<br />
3<br />
4<br />
5<br />
59<br />
Storm Tide Zones<br />
<strong>Nassau</strong> <strong>County</strong>, 2010<br />
Scale - 1:24,000<br />
Feet<br />
0 2,000<br />
USNG Page 17R MP 56 80<br />
Map Plate 51<br />
81°25'0"W<br />
4 60<br />
116 117<br />
109 110 111 112 113 114 115<br />
99 100 101 105 106 107 102 103 104 108<br />
83 84 85 86 87 88 89 90 91 92 93 94 95 96 97 98<br />
67 68 69 70 71 72 73 74 75 76 77 78 79 80 81 82<br />
52 53 54 55 56 57 58 59 60 61 62 63 64 65 66<br />
37 38 39 40 41 42 43 44 45 46 47 48 49 50 51<br />
24 25 26 27 28 29 30 31<br />
32 33 34 35 36<br />
18 19 20 21 22 23<br />
12 13 14 15 16 17<br />
7 8 9 10 11<br />
4 5 6<br />
1 2 3<br />
33 80<br />
Produced by <strong>Northeast</strong> <strong>Florida</strong> <strong>Regional</strong> <strong>Council</strong> for <strong>Florida</strong> Division of Emergency Management, 2009-2010<br />
Page 43<br />
Printed Pages in Yellow
16<br />
17<br />
81°52'0"W<br />
18<br />
81°51'0"W<br />
19<br />
420<br />
81°50'0"W<br />
£¤ 1<br />
33 90 33 90<br />
US Hwy 1<br />
Unnam ed Street<br />
D<br />
10.15 ft<br />
Drew Ln<br />
Unnamed Street<br />
30°38'0"N<br />
Mills Creek<br />
Sauls Rd<br />
Rabo Rd<br />
30°38'0"N<br />
89 89<br />
Dyal Rd<br />
£¤ 1<br />
Atkinson Ln<br />
US Hwy 1<br />
88 88<br />
Gage Rd<br />
30°37'0"N<br />
NASSAU COUNTY<br />
Live Oak Church Rd<br />
Bourdeau Ln<br />
30°37'0"N<br />
Unnamed Street<br />
87 87<br />
Bordeau Ln<br />
Old Dixie Hwy<br />
Braddock Rd<br />
86 86<br />
Landfill Rd<br />
D<br />
14.41 ft<br />
30°36'0"N<br />
£¤ 1<br />
30°36'0"N<br />
Irvin Ave<br />
33 85 000m. N<br />
4 16 000m. E<br />
US National Grid<br />
100,000-m Square ID<br />
MP<br />
Grid Zone Designation<br />
17R<br />
Datum = NAD 1983, 1,000-m USNG<br />
Mag. Declination<br />
5 o 41' 24"W<br />
Changing by<br />
4' W per yr<br />
Date 2009<br />
This map is for reference & planning purposes only.<br />
Hurricane evacuation decision-making and growth<br />
management implementation are local responsibilities.<br />
Please consult with local authorities.<br />
#<br />
Diagram<br />
Not to Scale<br />
81°52'0"W<br />
GN<br />
^<br />
17<br />
Notes:<br />
1. Surge limits are based on<br />
still water storm tide height<br />
elevation above NAVD88<br />
at high tide with no wave<br />
setup.<br />
2. Total Storm Tide limits were<br />
derived from Maximum of<br />
Maximums surge heights<br />
over LIDAR based digital<br />
elevation.<br />
3. The Points of Reference are<br />
locations determined to be<br />
relevant to emergency managment<br />
officials.<br />
Matthews Pl<br />
18<br />
ATLAS LEGEND<br />
®v HOSPITAL<br />
%2 Points of Reference<br />
Evacuation Route<br />
City Limits<br />
NHD Lakes<br />
NHD Major Water<br />
Zidell Rd<br />
81°51'0"W<br />
Cat<br />
1<br />
2<br />
3<br />
4<br />
5<br />
19<br />
Storm Tide Zones<br />
<strong>Nassau</strong> <strong>County</strong>, 2010<br />
Scale - 1:24,000<br />
Feet<br />
0 2,000<br />
USNG Page 17R MP 16 85<br />
Map Plate 56<br />
4 20<br />
81°50'0"W<br />
116 117<br />
109 110 111 112 113 114 115<br />
99 100 101 105 106 107 102 103 104 108<br />
83 84 85 86 87 88 89 90 91 92 93 94 95 96 97 98<br />
67 68 69 70 71 72 73 74 75 76 77 78 79 80 81 82<br />
52 53 54 55 56 57 58 59 60 61 62 63 64 65 66<br />
37 38 39 40 41 42 43 44 45 46 47 48 49 50 51<br />
24 25 26 27 28 29 30 31<br />
32 33 34 35 36<br />
18 19 20 21 22 23<br />
12 13 14 15 16 17<br />
7 8 9 10 11<br />
4 5 6<br />
1 2 3<br />
85<br />
Produced by <strong>Northeast</strong> <strong>Florida</strong> <strong>Regional</strong> <strong>Council</strong> for <strong>Florida</strong> Division of Emergency Management, 2009-2010<br />
Page 44<br />
Printed Pages in Yellow
420<br />
81°50'0"W<br />
21<br />
81°49'0"W<br />
22<br />
23<br />
81°48'0"W<br />
24<br />
33 90 33 90<br />
Boggy Trl<br />
D<br />
Unnamed Street<br />
Mills Creek<br />
30°38'0"N<br />
Rabo Rd<br />
30°38'0"N<br />
89 D<br />
89<br />
Sauls Rd<br />
4.54 ft<br />
Middle Rd<br />
D<br />
20.42 ft<br />
88 88<br />
Davis Rd<br />
Coulter Hill Ln<br />
30°37'0"N<br />
87 87<br />
30°36'0"N<br />
US Hwy 1<br />
86 86<br />
Landfill Rd<br />
£¤ 1<br />
£¤ 1 NASSAU COUNTY<br />
Unnamed Street<br />
D<br />
21.15 ft<br />
30°37'0"N<br />
30°36'0"N<br />
33 85 000m. N<br />
81°50'0"W<br />
4 20 000m. E<br />
US Hwy 1<br />
US National Grid<br />
100,000-m Square ID<br />
MP<br />
Grid Zone Designation<br />
17R<br />
Datum = NAD 1983, 1,000-m USNG<br />
Mag. Declination<br />
5 o 41' 24"W<br />
Changing by<br />
4' W per yr<br />
Date 2009<br />
This map is for reference & planning purposes only.<br />
Hurricane evacuation decision-making and growth<br />
management implementation are local responsibilities.<br />
Please consult with local authorities.<br />
#<br />
Diagram<br />
Not to Scale<br />
GN<br />
^<br />
21<br />
Notes:<br />
1. Surge limits are based on<br />
still water storm tide height<br />
elevation above NAVD88<br />
at high tide with no wave<br />
setup.<br />
2. Total Storm Tide limits were<br />
derived from Maximum of<br />
Maximums surge heights<br />
over LIDAR based digital<br />
elevation.<br />
3. The Points of Reference are<br />
locations determined to be<br />
relevant to emergency managment<br />
officials.<br />
81°49'0"W<br />
22<br />
Davis Rd<br />
ATLAS LEGEND<br />
®v HOSPITAL<br />
%2 Points of Reference<br />
Evacuation Route<br />
City Limits<br />
NHD Lakes<br />
NHD Major Water<br />
Cat<br />
1<br />
2<br />
3<br />
4<br />
5<br />
23<br />
81°48'0"W<br />
Storm Tide Zones<br />
<strong>Nassau</strong> <strong>County</strong>, 2010<br />
Scale - 1:24,000<br />
Feet<br />
0 2,000<br />
USNG Page 17R MP 20 85<br />
Map Plate 57<br />
Dimaria Dr<br />
Pittman Rd<br />
24<br />
116 117<br />
109 110 111 112 113 114 115<br />
99 100 101 105 106 107 102 103 104 108<br />
83 84 85 86 87 88 89 90 91 92 93 94 95 96 97 98<br />
67 68 69 70 71 72 73 74 75 76 77 78 79 80 81 82<br />
52 53 54 55 56 57 58 59 60 61 62 63 64 65 66<br />
37 38 39 40 41 42 43 44 45 46 47 48 49 50 51<br />
24 25 26 27 28 29 30 31<br />
32 33 34 35 36<br />
18 19 20 21 22 23<br />
12 13 14 15 16 17<br />
7 8 9 10 11<br />
4 5 6<br />
1 2 3<br />
Jewel Thomas Rd<br />
85<br />
Produced by <strong>Northeast</strong> <strong>Florida</strong> <strong>Regional</strong> <strong>Council</strong> for <strong>Florida</strong> Division of Emergency Management, 2009-2010<br />
Page 45<br />
Printed Pages in Yellow
i<br />
24<br />
25<br />
81°47'0"W<br />
26<br />
81°46'0"W<br />
27<br />
28<br />
81°45'0"W<br />
33 90 33 90<br />
Boggy Trl<br />
Hickox Ln<br />
Yulee Rd<br />
D<br />
Mills Creek<br />
Middle Rd<br />
Griffin Rd<br />
30°38'0"N<br />
30°38'0"N<br />
89 89<br />
<strong>Nassau</strong> Oaks Ln<br />
Phoenix Ct<br />
<strong>Nassau</strong> Oaks Dr<br />
Bigs Oak Dr<br />
<strong>Nassau</strong> Oaks Cir<br />
1.74 ft<br />
D<br />
88 88<br />
Davis Rd<br />
30°37'0"N<br />
NASSAU COUNTY<br />
30°37'0"N<br />
87 87<br />
D<br />
12.66 ft<br />
Burns Rd<br />
Brandies St<br />
86 86<br />
Pittman Rd<br />
Wh<br />
te Oak Pl<br />
30°36'0"N<br />
State Hwy 200<br />
30°36'0"N<br />
Unnamed Street<br />
33 85 000m. N<br />
Dimaria Dr<br />
Pittman Rd<br />
4 24 000m. E<br />
US National Grid<br />
100,000-m Square ID<br />
MP<br />
Grid Zone Designation<br />
17R<br />
Datum = NAD 1983, 1,000-m USNG<br />
Jewel Thomas Rd<br />
Mag. Declination<br />
5 o 41' 24"W<br />
Changing by<br />
4' W per yr<br />
Date 2009<br />
This map is for reference & planning purposes only.<br />
Hurricane evacuation decision-making and growth<br />
management implementation are local responsibilities.<br />
Please consult with local authorities.<br />
#<br />
Diagram<br />
Not to Scale<br />
81°47'0"W<br />
GN<br />
^<br />
25<br />
Mount Olive Rd<br />
Notes:<br />
1. Surge limits are based on<br />
still water storm tide height<br />
elevation above NAVD88<br />
at high tide with no wave<br />
setup.<br />
2. Total Storm Tide limits were<br />
derived from Maximum of<br />
Maximums surge heights<br />
over LIDAR based digital<br />
elevation.<br />
3. The Points of Reference are<br />
locations determined to be<br />
relevant to emergency managment<br />
officials.<br />
26<br />
ATLAS LEGEND<br />
®v HOSPITAL<br />
%2 Points of Reference<br />
Evacuation Route<br />
City Limits<br />
NHD Lakes<br />
NHD Major Water<br />
81°46'0"W<br />
Cat<br />
1<br />
2<br />
3<br />
4<br />
5<br />
27<br />
Storm Tide Zones<br />
<strong>Nassau</strong> <strong>County</strong>, 2010<br />
Scale - 1:24,000<br />
Feet<br />
0 2,000<br />
USNG Page 17R MP 24 85<br />
Map Plate 58<br />
28<br />
81°45'0"W<br />
116 117<br />
109 110 111 112 113 114 115<br />
99 100 101 105 106 107 102 103 104 108<br />
83 84 85 86 87 88 89 90 91 92 93 94 95 96 97 98<br />
67 68 69 70 71 72 73 74 75 76 77 78 79 80 81 82<br />
52 53 54 55 56 57 58 59 60 61 62 63 64 65 66<br />
37 38 39 40 41 42 43 44 45 46 47 48 49 50 51<br />
24 25 26 27 28 29 30 31<br />
32 33 34 35 36<br />
18 19 20 21 22 23<br />
12 13 14 15 16 17<br />
7 8 9 10 11<br />
4 5 6<br />
1 2 3<br />
85<br />
Produced by <strong>Northeast</strong> <strong>Florida</strong> <strong>Regional</strong> <strong>Council</strong> for <strong>Florida</strong> Division of Emergency Management, 2009-2010<br />
Page 46<br />
Printed Pages in Yellow
W Berry Ln<br />
28<br />
81°45'0"W<br />
29<br />
81°44'0"W<br />
430<br />
31<br />
81°43'0"W<br />
32<br />
33 90 33 90<br />
30°38'0"N<br />
Yulee Rd<br />
30°38'0"N<br />
89 89<br />
Unnamed Street<br />
Unnamed Street<br />
D<br />
17.83 ft<br />
Griffin Rd<br />
88 88<br />
30°37'0"N<br />
NASSAU COUNTY<br />
ITALIA<br />
30°37'0"N<br />
Gussie Ln<br />
87 87<br />
State Hwy 200<br />
Mills Creek<br />
Burns Rd<br />
D<br />
86 86<br />
D<br />
1.34 ft<br />
3.04 ft<br />
Wh<br />
i te Oak Pl<br />
30°36'0"N<br />
33 85 000m. N<br />
30°36'0"N<br />
81°45'0"W<br />
4 28 000m. E<br />
US National Grid<br />
100,000-m Square ID<br />
MP<br />
Grid Zone Designation<br />
17R<br />
Datum = NAD 1983, 1,000-m USNG<br />
Mag. Declination<br />
5 o 41' 24"W<br />
Changing by<br />
4' W per yr<br />
Date 2009<br />
This map is for reference & planning purposes only.<br />
Hurricane evacuation decision-making and growth<br />
management implementation are local responsibilities.<br />
Please consult with local authorities.<br />
#<br />
Diagram<br />
Not to Scale<br />
GN<br />
^<br />
29<br />
Notes:<br />
1. Surge limits are based on<br />
still water storm tide height<br />
elevation above NAVD88<br />
at high tide with no wave<br />
setup.<br />
2. Total Storm Tide limits were<br />
derived from Maximum of<br />
Maximums surge heights<br />
over LIDAR based digital<br />
elevation.<br />
3. The Points of Reference are<br />
locations determined to be<br />
relevant to emergency managment<br />
officials.<br />
81°44'0"W<br />
4 30<br />
ATLAS LEGEND<br />
®v HOSPITAL<br />
%2 Points of Reference<br />
Evacuation Route<br />
City Limits<br />
NHD Lakes<br />
NHD Major Water<br />
Cat<br />
1<br />
2<br />
3<br />
4<br />
5<br />
31<br />
81°43'0"W<br />
Storm Tide Zones<br />
<strong>Nassau</strong> <strong>County</strong>, 2010<br />
Scale - 1:24,000<br />
Feet<br />
0 2,000<br />
USNG Page 17R MP 28 85<br />
Map Plate 59<br />
85<br />
32<br />
116 117<br />
109 110 111 112 113 114 115<br />
99 100 101 105 106 107 102 103 104 108<br />
83 84 85 86 87 88 89 90 91 92 93 94 95 96 97 98<br />
67 68 69 70 71 72 73 74 75 76 77 78 79 80 81 82<br />
52 53 54 55 56 57 58 59 60 61 62 63 64 65 66<br />
37 38 39 40 41 42 43 44 45 46 47 48 49 50 51<br />
24 25 26 27 28 29 30 31<br />
32 33 34 35 36<br />
18 19 20 21 22 23<br />
12 13 14 15 16 17<br />
7 8 9 10 11<br />
4 5 6<br />
1 2 3<br />
Produced by <strong>Northeast</strong> <strong>Florida</strong> <strong>Regional</strong> <strong>Council</strong> for <strong>Florida</strong> Division of Emergency Management, 2009-2010<br />
Page 47<br />
Printed Pages in Yellow
32<br />
33<br />
81°42'0"W<br />
34<br />
81°41'0"W<br />
35<br />
36<br />
81°40'0"W<br />
33 90 33 90<br />
Wildwood Rd<br />
Fred Miner Estates Dr<br />
30°38'0"N<br />
Yulee Rd<br />
Unnamed Street<br />
89 89<br />
30°38'0"N<br />
Wildwood Rd<br />
D<br />
12.43 ft<br />
Groover Rd<br />
Unnamed Street<br />
88 88<br />
30°37'0"N<br />
NASSAU COUNTY<br />
Plummer Creek<br />
30°37'0"N<br />
State Hwy 200<br />
87 87<br />
D<br />
13.34 ft<br />
Police Lodge Rd<br />
D<br />
86 86<br />
Logan Rd<br />
D<br />
11.24 ft<br />
30°36'0"N<br />
Mills Creek<br />
Edwards Rd<br />
33 85 000m. N<br />
30°36'0"N<br />
4 32 000m. E<br />
US National Grid<br />
100,000-m Square ID<br />
MP<br />
Grid Zone Designation<br />
17R<br />
Datum = NAD 1983, 1,000-m USNG<br />
Mag. Declination<br />
5 o 41' 24"W<br />
Changing by<br />
4' W per yr<br />
Date 2009<br />
This map is for reference & planning purposes only.<br />
Hurricane evacuation decision-making and growth<br />
management implementation are local responsibilities.<br />
Please consult with local authorities.<br />
#<br />
Diagram<br />
Not to Scale<br />
81°42'0"W<br />
GN<br />
^<br />
33<br />
Notes:<br />
1. Surge limits are based on<br />
still water storm tide height<br />
elevation above NAVD88<br />
at high tide with no wave<br />
setup.<br />
2. Total Storm Tide limits were<br />
derived from Maximum of<br />
Maximums surge heights<br />
over LIDAR based digital<br />
elevation.<br />
3. The Points of Reference are<br />
locations determined to be<br />
relevant to emergency managment<br />
officials.<br />
34<br />
ATLAS LEGEND<br />
®v HOSPITAL<br />
%2 Points of Reference<br />
Evacuation Route<br />
City Limits<br />
NHD Lakes<br />
NHD Major Water<br />
81°41'0"W<br />
Cat<br />
1<br />
2<br />
3<br />
4<br />
5<br />
35<br />
Royal Palm Dr<br />
Storm Tide Zones<br />
<strong>Nassau</strong> <strong>County</strong>, 2010<br />
Scale - 1:24,000<br />
Feet<br />
0 2,000<br />
USNG Page 17R MP 32 85<br />
Map Plate 60<br />
81°40'0"W<br />
36<br />
116 117<br />
109 110 111 112 113 114 115<br />
99 100 101 105 106 107 102 103 104 108<br />
83 84 85 86 87 88 89 90 91 92 93 94 95 96 97 98<br />
67 68 69 70 71 72 73 74 75 76 77 78 79 80 81 82<br />
52 53 54 55 56 57 58 59 60 61 62 63 64 65 66<br />
37 38 39 40 41 42 43 44 45 46 47 48 49 50 51<br />
24 25 26 27 28 29 30 31<br />
32 33 34 35 36<br />
18 19 20 21 22 23<br />
12 13 14 15 16 17<br />
7 8 9 10 11<br />
4 5 6<br />
1 2 3<br />
85<br />
Produced by <strong>Northeast</strong> <strong>Florida</strong> <strong>Regional</strong> <strong>Council</strong> for <strong>Florida</strong> Division of Emergency Management, 2009-2010<br />
Page 48<br />
Printed Pages in Yellow
Harper Chapel Rd<br />
36<br />
81°40'0"W<br />
37<br />
81°39'0"W<br />
38<br />
39<br />
81°38'0"W<br />
440<br />
33 90 33 90<br />
Wildwood Rd<br />
30°38'0"N<br />
Yulee Rd<br />
89 89<br />
Unnamed Street<br />
30°38'0"N<br />
Taylor Rd<br />
Groover Rd<br />
§¨¦ 95<br />
Bobby Moore Cir<br />
88 88<br />
State Hwy 200<br />
Wildwood Rd<br />
30°37'0"N<br />
NASSAU COUNTY<br />
I 95<br />
UV 200<br />
87 87<br />
Mentoria Rd<br />
Walthour Pl<br />
William Burge<br />
s Rd<br />
Dove Rd<br />
30°37'0"N<br />
I 95<br />
Briarwood Ave<br />
D<br />
3.96 ft<br />
Plum mer Creek<br />
Unnamed Street<br />
Johnson Lake Rd N<br />
86 86<br />
D<br />
12.78 ft<br />
30°36'0"N<br />
Police Lodge Rd<br />
33 85 000m. N<br />
30°36'0"N<br />
81°40'0"W<br />
4 36 000m. E<br />
US National Grid<br />
100,000-m Square ID<br />
MP<br />
Grid Zone Designation<br />
17R<br />
Datum = NAD 1983, 1,000-m USNG<br />
Mag. Declination<br />
5 o 41' 24"W<br />
Changing by<br />
4' W per yr<br />
Date 2009<br />
This map is for reference & planning purposes only.<br />
Hurricane evacuation decision-making and growth<br />
management implementation are local responsibilities.<br />
Please consult with local authorities.<br />
#<br />
Diagram<br />
Not to Scale<br />
GN<br />
^<br />
37<br />
Notes:<br />
1. Surge limits are based on<br />
still water storm tide height<br />
elevation above NAVD88<br />
at high tide with no wave<br />
setup.<br />
2. Total Storm Tide limits were<br />
derived from Maximum of<br />
Maximums surge heights<br />
over LIDAR based digital<br />
elevation.<br />
3. The Points of Reference are<br />
locations determined to be<br />
relevant to emergency managment<br />
officials.<br />
81°39'0"W<br />
38<br />
ATLAS LEGEND<br />
®v HOSPITAL<br />
%2 Points of Reference<br />
Evacuation Route<br />
City Limits<br />
NHD Lakes<br />
NHD Major Water<br />
Cat<br />
1<br />
2<br />
3<br />
4<br />
5<br />
39<br />
81°38'0"W<br />
Storm Tide Zones<br />
<strong>Nassau</strong> <strong>County</strong>, 2010<br />
Scale - 1:24,000<br />
Feet<br />
0 2,000<br />
USNG Page 17R MP 36 85<br />
Map Plate 61<br />
85<br />
4 40<br />
116 117<br />
109 110 111 112 113 114 115<br />
99 100 101 105 106 107 102 103 104 108<br />
83 84 85 86 87 88 89 90 91 92 93 94 95 96 97 98<br />
67 68 69 70 71 72 73 74 75 76 77 78 79 80 81 82<br />
52 53 54 55 56 57 58 59 60 61 62 63 64 65 66<br />
37 38 39 40 41 42 43 44 45 46 47 48 49 50 51<br />
24 25 26 27 28 29 30 31<br />
32 33 34 35 36<br />
18 19 20 21 22 23<br />
12 13 14 15 16 17<br />
7 8 9 10 11<br />
4 5 6<br />
1 2 3<br />
Produced by <strong>Northeast</strong> <strong>Florida</strong> <strong>Regional</strong> <strong>Council</strong> for <strong>Florida</strong> Division of Emergency Management, 2009-2010<br />
Page 49<br />
Printed Pages in Yellow
440<br />
41<br />
81°37'0"W<br />
42<br />
81°36'0"W<br />
43<br />
44<br />
81°35'0"W<br />
30°38'0"N<br />
Unnamed Street<br />
Taylor Rd<br />
YULEE<br />
89 89<br />
£¤ UV 17 200<br />
UV<br />
UV 200<br />
200<br />
Taylor Rd<br />
State Hwy 200<br />
State Hwy 200<br />
Hamilton St<br />
Old Yulee Rd<br />
Warfield Ave<br />
Goodbread Rd<br />
33 90 33 90<br />
Davis Ave<br />
Jefferson St<br />
Bird Ln<br />
Faye Ln<br />
Lewis Rd<br />
Stillmeadow Ln<br />
Sowell Rd<br />
Crosby Rd<br />
Palmetto St<br />
Oak St<br />
Hickox Rd<br />
<strong>Florida</strong> Ave<br />
Pine Woods Dr<br />
Palm Tree Dr<br />
Rubin Ln<br />
John St<br />
Clyde St<br />
Robert St<br />
Yanie Rd<br />
Williams Ave<br />
Faith Ave<br />
Pages Dairy Rd<br />
Kutana Dr<br />
Cottonwood Ave<br />
Felmor Rd<br />
Kutana A ve<br />
Weldon Rd<br />
Miner Rd<br />
Bladon Rd<br />
30°38'0"N<br />
Bobby Moore Cir<br />
Wren Rd<br />
Macaw Ave<br />
Cardinal St<br />
Robin Rd<br />
W Harts Rd<br />
88 88<br />
Hummingbird Ln<br />
Stevens Rd<br />
30°37'0"N<br />
Lark Rd<br />
Dove Rd<br />
Macaw Rd<br />
NASSAU COUNTY<br />
Finch Rd<br />
Whippoorwill Pl<br />
Spring Meadow Ave<br />
30°37'0"N<br />
Pinewood Dr<br />
US Hwy 17<br />
Sand Hick ory Trl<br />
87 87<br />
Calaway Dr<br />
Jamnik St<br />
Wester Dr<br />
Dorsey Ln<br />
Jacob Carlton Rd<br />
Hester Dr<br />
William Burgess Rd<br />
30°36'0"N<br />
D<br />
Harvester St<br />
86 86<br />
Lumber Creek<br />
2.79 ft<br />
Clyde Higginbotham Rd<br />
Trinity Rd<br />
Trinity Cir<br />
Hall Ln<br />
Moss Oak Dr<br />
Landover Dr<br />
Loretta Ln<br />
Bayview Rd<br />
Sutton Pl<br />
Myrtice Rd<br />
Wilson St<br />
Winona St<br />
Claxton Rd<br />
Milton Rd<br />
Joyce Rd<br />
Radio Ave<br />
Airplane Ln<br />
Wilson Ln<br />
Brooke St<br />
Ashley Ave<br />
Rose Marie Rd<br />
Tinya Rd<br />
Alene Rd<br />
Radio Ct<br />
Theresa Rd<br />
30°36'0"N<br />
Telephone Ln<br />
33 85 000m. N<br />
4 40 000m. E<br />
US National Grid<br />
100,000-m Square ID<br />
MP<br />
Grid Zone Designation<br />
17R<br />
Datum = NAD 1983, 1,000-m USNG<br />
Mag. Declination<br />
5 o 41' 24"W<br />
Changing by<br />
4' W per yr<br />
Date 2009<br />
This map is for reference & planning purposes only.<br />
Hurricane evacuation decision-making and growth<br />
management implementation are local responsibilities.<br />
Please consult with local authorities.<br />
#<br />
Diagram<br />
Not to Scale<br />
81°37'0"W<br />
GN<br />
^<br />
41<br />
Notes:<br />
1. Surge limits are based on<br />
still water storm tide height<br />
elevation above NAVD88<br />
at high tide with no wave<br />
setup.<br />
2. Total Storm Tide limits were<br />
derived from Maximum of<br />
Maximums surge heights<br />
over LIDAR based digital<br />
elevation.<br />
3. The Points of Reference are<br />
locations determined to be<br />
relevant to emergency managment<br />
officials.<br />
Lumber Creek<br />
42<br />
ATLAS LEGEND<br />
®v HOSPITAL<br />
%2 Points of Reference<br />
Evacuation Route<br />
City Limits<br />
NHD Lakes<br />
NHD Major Water<br />
81°36'0"W<br />
Cat<br />
1<br />
2<br />
3<br />
4<br />
5<br />
E Harts Rd<br />
43<br />
Storm Tide Zones<br />
<strong>Nassau</strong> <strong>County</strong>, 2010<br />
Scale - 1:24,000<br />
Feet<br />
0 2,000<br />
USNG Page 17R MP 40 85<br />
Map Plate 62<br />
Theresa Ave<br />
81°35'0"W<br />
44<br />
116 117<br />
109 110 111 112 113 114 115<br />
99 100 101 105 106 107 102 103 104 108<br />
83 84 85 86 87 88 89 90 91 92 93 94 95 96 97 98<br />
67 68 69 70 71 72 73 74 75 76 77 78 79 80 81 82<br />
52 53 54 55 56 57 58 59 60 61 62 63 64 65 66<br />
37 38 39 40 41 42 43 44 45 46 47 48 49 50 51<br />
24 25 26 27 28 29 30 31<br />
32 33 34 35 36<br />
18 19 20 21 22 23<br />
12 13 14 15 16 17<br />
7 8 9 10 11<br />
4 5 6<br />
1 2 3<br />
85<br />
Produced by <strong>Northeast</strong> <strong>Florida</strong> <strong>Regional</strong> <strong>Council</strong> for <strong>Florida</strong> Division of Emergency Management, 2009-2010<br />
Page 50<br />
Printed Pages in Yellow
44<br />
81°35'0"W<br />
Cottonwood Ave<br />
Pages Dairy Rd<br />
Peeples Dr<br />
Jenny L n<br />
45<br />
Blounts Branch<br />
81°34'0"W<br />
46<br />
47<br />
33 90 33 90<br />
Monson Rd<br />
Rayonier Service Rd<br />
Pages Dairy Rd<br />
81°33'0"W<br />
48<br />
30°38'0"N<br />
Felmor Rd<br />
Weldon Rd<br />
Bladon Rd<br />
Harry Green Rd<br />
Merrylene Rd<br />
Rush Rd<br />
89 89<br />
Hopper Ln<br />
Chester Rd<br />
30°38'0"N<br />
Peeples Rd<br />
Kutana Dr<br />
Kutana Ave<br />
Santa Barbara St<br />
UV 200 UV 200<br />
Saint Mark Dr<br />
Saint James Ct<br />
State Hwy 200<br />
State Hwy 200<br />
Unnamed Street<br />
S<br />
Thomas<br />
Saint Paul Blvd<br />
Saint<br />
t<br />
St Pauls Blvd<br />
Saint Mark Trl<br />
San Schell Ln<br />
Riverwood Dr<br />
88 88<br />
Christian Way<br />
Prince Dr N<br />
<strong>Nassau</strong> Pl<br />
Meadowfield Bluffs Rd<br />
Fieldstone Dr<br />
Creekwood Dr<br />
30°37'0"N<br />
Sand Hickory Trl<br />
Evergreen Pl<br />
Maple Leaf Pl<br />
Red Holly Pl<br />
Miner Rd<br />
Creek Dr<br />
Bigleaf Ln<br />
Lofton Ct<br />
Appaloosa Ave<br />
Bear Ln<br />
NASSAU COUNTY<br />
D<br />
13.15 ft<br />
87 87<br />
Flora Parke Blvd<br />
30°37'0"N<br />
Lofton Trl<br />
Loflon St<br />
Duane Ave<br />
Camellia Blf<br />
Renia St<br />
Megan St<br />
30°36'0"N<br />
Radio Ave<br />
Radio Ct<br />
Theresa Rd<br />
86 86<br />
Ashley Ave<br />
Rose Marie Rd<br />
Tinya Rd<br />
Terry Rd<br />
Jeffery Ave<br />
Kirkland Rd<br />
Chinquapin Ln<br />
Flying A Rnch<br />
D<br />
2.46 ft<br />
30°36'0"N<br />
33 85 000m. N<br />
Alene Rd<br />
Theresa Ave<br />
81°35'0"W<br />
4 44 000m. E<br />
US National Grid<br />
100,000-m Square ID<br />
MP<br />
Grid Zone Designation<br />
17R<br />
Datum = NAD 1983, 1,000-m USNG<br />
Joann Rd<br />
Theresa Rd<br />
Mag. Declination<br />
5 o 41' 24"W<br />
Changing by<br />
4' W per yr<br />
Date 2009<br />
This map is for reference & planning purposes only.<br />
Hurricane evacuation decision-making and growth<br />
management implementation are local responsibilities.<br />
Please consult with local authorities.<br />
#<br />
Diagram<br />
Not to Scale<br />
GN<br />
Haddock Rd<br />
^<br />
45<br />
Dick King Rd<br />
Blackmon Rd<br />
Notes:<br />
1. Surge limits are based on<br />
still water storm tide height<br />
elevation above NAVD88<br />
at high tide with no wave<br />
setup.<br />
2. Total Storm Tide limits were<br />
derived from Maximum of<br />
Maximums surge heights<br />
over LIDAR based digital<br />
elevation.<br />
3. The Points of Reference are<br />
locations determined to be<br />
relevant to emergency managment<br />
officials.<br />
81°34'0"W<br />
46<br />
ATLAS LEGEND<br />
®v HOSPITAL<br />
%2 Points of Reference<br />
Evacuation Route<br />
City Limits<br />
NHD Lakes<br />
NHD Major Water<br />
Cat<br />
1<br />
2<br />
3<br />
4<br />
5<br />
47<br />
81°33'0"W<br />
Storm Tide Zones<br />
<strong>Nassau</strong> <strong>County</strong>, 2010<br />
Scale - 1:24,000<br />
Feet<br />
0 2,000<br />
USNG Page 17R MP 44 85<br />
Map Plate 63<br />
85<br />
48<br />
116 117<br />
109 110 111 112 113 114 115<br />
99 100 101 105 106 107 102 103 104 108<br />
83 84 85 86 87 88 89 90 91 92 93 94 95 96 97 98<br />
67 68 69 70 71 72 73 74 75 76 77 78 79 80 81 82<br />
52 53 54 55 56 57 58 59 60 61 62 63 64 65 66<br />
37 38 39 40 41 42 43 44 45 46 47 48 49 50 51<br />
24 25 26 27 28 29 30 31<br />
32 33 34 35 36<br />
18 19 20 21 22 23<br />
12 13 14 15 16 17<br />
7 8 9 10 11<br />
4 5 6<br />
1 2 3<br />
Produced by <strong>Northeast</strong> <strong>Florida</strong> <strong>Regional</strong> <strong>Council</strong> for <strong>Florida</strong> Division of Emergency Management, 2009-2010<br />
Page 51<br />
Printed Pages in Yellow
Unnamed Street<br />
Chester Rd<br />
48<br />
81°32'0"W<br />
49<br />
Pirates Bluff Rd<br />
Water Rd<br />
450<br />
81°31'0"W<br />
Sawgrass Cove Trl<br />
51<br />
River Marsh Dr<br />
33 90 33 90<br />
Palm Bluff Dr<br />
Amelia River<br />
52<br />
81°30'0"W<br />
Scotts Trce<br />
30°38'0"N<br />
<strong>County</strong> Hwy 107<br />
Opal PVT Ave<br />
Lanceford Creek<br />
89 89<br />
Monterey St<br />
Marsh Hen Ln<br />
Silkvine Ln<br />
Barnwell Rd<br />
Twin Oak Ln<br />
Springwood Ln<br />
Piney Island Dr<br />
Piney Island Ct<br />
30°38'0"N<br />
Willow Oak Ln<br />
<strong>Nassau</strong> Pl<br />
Kaplan Ct<br />
Barnwell Ct<br />
Barnwell Cir N<br />
D<br />
12.17 ft<br />
S Piney Island Dr<br />
UV 200 UV 200<br />
88 88<br />
UV<br />
UV 200<br />
NASSAU COUNTY<br />
UV 200<br />
UV 200<br />
UV 200<br />
State Hwy 200<br />
Flora Parke Blvd<br />
Cessna Dr<br />
State Hwy 200<br />
Cessna Ct<br />
Baker Dr<br />
Mount Zion Ave<br />
B arnwell Cir S<br />
L S Morrison Dr<br />
O Neil Scott Rd<br />
Lonnie Ln<br />
Calhoun Rd<br />
Lariat St<br />
Marsh View Dr<br />
Crane Dr<br />
Fiddler Dr<br />
V<br />
Oyster Ct<br />
illage Dr<br />
30°37'0"N<br />
Arrigo Blvd<br />
<strong>Nassau</strong> Lakes Cir<br />
Parlia ment Dr<br />
D<br />
8.48 ft<br />
Duval Rd<br />
N e<br />
Hardy Allen Rd<br />
lson Rd<br />
Staghorn Ln<br />
Pine Grove Rd<br />
Summer Trce<br />
87 87<br />
Palmetto Trl<br />
Hickory Pl<br />
Otte r Run D<br />
Pintail Ct<br />
30°37'0"N<br />
Clements Rd<br />
r<br />
Littleberry Ln<br />
Caym an Cir<br />
86 86<br />
Christy Ct<br />
Audubon Ave<br />
State Hwy 107<br />
Lars Ln<br />
30°36'0"N<br />
Nile St<br />
Marc Anthony Rd<br />
33 85 000m. N<br />
30°36'0"N<br />
4 48 000m. E<br />
US National Grid<br />
100,000-m Square ID<br />
MP<br />
Grid Zone Designation<br />
17R<br />
Datum = NAD 1983, 1,000-m USNG<br />
Mag. Declination<br />
5 o 41' 24"W<br />
Changing by<br />
4' W per yr<br />
Date 2009<br />
This map is for reference & planning purposes only.<br />
Hurricane evacuation decision-making and growth<br />
management implementation are local responsibilities.<br />
Please consult with local authorities.<br />
#<br />
Diagram<br />
Not to Scale<br />
81°32'0"W<br />
GN<br />
^<br />
49<br />
Notes:<br />
1. Surge limits are based on<br />
still water storm tide height<br />
elevation above NAVD88<br />
at high tide with no wave<br />
setup.<br />
2. Total Storm Tide limits were<br />
derived from Maximum of<br />
Maximums surge heights<br />
over LIDAR based digital<br />
elevation.<br />
3. The Points of Reference are<br />
locations determined to be<br />
relevant to emergency managment<br />
officials.<br />
4 50<br />
ATLAS LEGEND<br />
®v HOSPITAL<br />
%2 Points of Reference<br />
Evacuation Route<br />
City Limits<br />
NHD Lakes<br />
NHD Major Water<br />
81°31'0"W<br />
Cat<br />
1<br />
2<br />
3<br />
4<br />
5<br />
51<br />
Storm Tide Zones<br />
<strong>Nassau</strong> <strong>County</strong>, 2010<br />
Scale - 1:24,000<br />
Feet<br />
0 2,000<br />
USNG Page 17R MP 48 85<br />
Map Plate 64<br />
81°30'0"W<br />
52<br />
116 117<br />
109 110 111 112 113 114 115<br />
99 100 101 105 106 107 102 103 104 108<br />
83 84 85 86 87 88 89 90 91 92 93 94 95 96 97 98<br />
67 68 69 70 71 72 73 74 75 76 77 78 79 80 81 82<br />
52 53 54 55 56 57 58 59 60 61 62 63 64 65 66<br />
37 38 39 40 41 42 43 44 45 46 47 48 49 50 51<br />
24 25 26 27 28 29 30 31<br />
32 33 34 35 36<br />
18 19 20 21 22 23<br />
12 13 14 15 16 17<br />
7 8 9 10 11<br />
4 5 6<br />
1 2 3<br />
85<br />
Produced by <strong>Northeast</strong> <strong>Florida</strong> <strong>Regional</strong> <strong>Council</strong> for <strong>Florida</strong> Division of Emergency Management, 2009-2010<br />
Page 52<br />
Printed Pages in Yellow
Bailey Rd<br />
52<br />
81°30'0"W<br />
53<br />
81°29'0"W<br />
54<br />
55<br />
81°28'0"W<br />
56<br />
Amelia River<br />
Clinch Dr<br />
Wax Wing Ln<br />
33 90 33 90<br />
Wren Dr<br />
Woodrow Ct<br />
Pine D r<br />
Oak Dr<br />
Sycamore Ln<br />
Palm Dr<br />
30°38'0"N<br />
Piney Island Ct<br />
S Piney Island Dr<br />
Marsh View Dr<br />
Piney Island Dr<br />
Oyster Ct<br />
UV 200<br />
South Amelia River<br />
%2<br />
UV105A<br />
UV 105A<br />
State Hwy 105A<br />
88 88<br />
UV 200<br />
30°37'0"N<br />
Crane Dr<br />
Fiddler Dr<br />
State Hwy 200<br />
Village Dr<br />
Pintail Ct<br />
Harbor Ct<br />
State Hwy 200<br />
8<br />
NASSAU COUNTY<br />
Excess Rd<br />
Butterfly Ter<br />
Marsh Cv<br />
Rowan Oak<br />
P eters Rd<br />
Russell Rd<br />
W Carter Ln<br />
Bonnieview Rd<br />
Amelia Island Pkwy<br />
Bridal Rd<br />
W Hirth Rd<br />
Friendly Rd<br />
Cashen Rd<br />
J I Taylor Ct<br />
Pinedale Rd<br />
Bonnie Oaks Dr<br />
Pine Rd<br />
Midway Rd<br />
Sunset Rd<br />
Boles Cir<br />
Donnie Ln<br />
Midway Rd<br />
Rayon Rd<br />
Old Amelia Ave<br />
89 89<br />
Gaines Ln<br />
Hirth Rd<br />
Simmons Rd<br />
Airport Rd<br />
Wall St<br />
Adams Rd<br />
Grove Park Cir<br />
Unnamed Street<br />
Oak St<br />
Cashen Dr<br />
Oak Ln<br />
Fountain Dr<br />
Diane Dr<br />
1st Ave<br />
Kenneth Ct<br />
30°38'0"N<br />
30°37'0"N<br />
Woodstork Pl<br />
87 87<br />
Mar sh Lakes Dr<br />
Fernandina Beach Muni<br />
86 86<br />
30°36'0"N<br />
Clements Rd<br />
Marian Dr<br />
State Hwy 105A<br />
Titleist Dr<br />
Canopy Dr<br />
33 85 000m. N<br />
30°36'0"N<br />
81°30'0"W<br />
4 52 000m. E<br />
US National Grid<br />
100,000-m Square ID<br />
MP<br />
Grid Zone Designation<br />
17R<br />
Datum = NAD 1983, 1,000-m USNG<br />
Mag. Declination<br />
5 o 41' 24"W<br />
Changing by<br />
4' W per yr<br />
Date 2009<br />
This map is for reference & planning purposes only.<br />
Hurricane evacuation decision-making and growth<br />
management implementation are local responsibilities.<br />
Please consult with local authorities.<br />
#<br />
Diagram<br />
Not to Scale<br />
GN<br />
^<br />
53<br />
Notes:<br />
1. Surge limits are based on<br />
still water storm tide height<br />
elevation above NAVD88<br />
at high tide with no wave<br />
setup.<br />
2. Total Storm Tide limits were<br />
derived from Maximum of<br />
Maximums surge heights<br />
over LIDAR based digital<br />
elevation.<br />
3. The Points of Reference are<br />
locations determined to be<br />
relevant to emergency managment<br />
officials.<br />
81°29'0"W<br />
54<br />
ATLAS LEGEND<br />
®v HOSPITAL<br />
%2 Points of Reference<br />
Evacuation Route<br />
City Limits<br />
NHD Lakes<br />
NHD Major Water<br />
Cat<br />
1<br />
2<br />
3<br />
4<br />
5<br />
55<br />
81°28'0"W<br />
Storm Tide Zones<br />
<strong>Nassau</strong> <strong>County</strong>, 2010<br />
Scale - 1:24,000<br />
Feet<br />
0 2,000<br />
USNG Page 17R MP 52 85<br />
Map Plate 65<br />
Autum n Trce<br />
Philips Manor Rd<br />
56<br />
116 117<br />
109 110 111 112 113 114 115<br />
99 100 101 105 106 107 102 103 104 108<br />
83 84 85 86 87 88 89 90 91 92 93 94 95 96 97 98<br />
67 68 69 70 71 72 73 74 75 76 77 78 79 80 81 82<br />
52 53 54 55 56 57 58 59 60 61 62 63 64 65 66<br />
37 38 39 40 41 42 43 44 45 46 47 48 49 50 51<br />
24 25 26 27 28 29 30 31<br />
32 33 34 35 36<br />
18 19 20 21 22 23<br />
12 13 14 15 16 17<br />
7 8 9 10 11<br />
4 5 6<br />
1 2 3<br />
85<br />
Produced by <strong>Northeast</strong> <strong>Florida</strong> <strong>Regional</strong> <strong>Council</strong> for <strong>Florida</strong> Division of Emergency Management, 2009-2010<br />
Page 53<br />
Printed Pages in Yellow
Egans Creek<br />
56<br />
81°27'0"W<br />
57<br />
58<br />
81°26'0"W<br />
59<br />
460<br />
81°25'0"W<br />
33 90<br />
UV 200<br />
33 90<br />
Wren Dr<br />
Oak Dr<br />
Woodrow Ct<br />
State Hwy 108<br />
Citrona Dr<br />
Talbot Ct<br />
Drury Rd<br />
Pin e Dr<br />
Palm Dr<br />
Rayon Rd<br />
UV105A<br />
Cashen Dr<br />
Oak St<br />
Holly Dr<br />
Nottingham Dr<br />
Robinhood Dr<br />
Susan Dr<br />
Inverness Rd<br />
Canterbury Ln<br />
Coventry Ln<br />
Penbro<br />
Dr ok<br />
Crescent Rd<br />
Purcell Dr<br />
Whitfield Dr<br />
Ryan Rd<br />
Pirates Bay Dr<br />
Off Shore Dr<br />
Long Boat Dr<br />
A St<br />
B St<br />
C St<br />
D St<br />
9<br />
%2<br />
Clinch Dr<br />
30°38'0"N<br />
Oak Ln<br />
Sanborn Ln<br />
Reatta Ln<br />
Delorean St<br />
Ciera Ln<br />
Lumina Ct<br />
Le Sabre Pl<br />
Fo<br />
rest Rdg<br />
89 89<br />
Askins St<br />
Mizell Ave<br />
30°38'0"N<br />
Will Hardee Rd<br />
Gaines Ln<br />
Hirth Rd<br />
State Hwy 105A<br />
Fountain Dr<br />
Diane Dr<br />
Curnutte Dr<br />
Sea Oates Ave<br />
Robert Oliver Ave<br />
1st Ave<br />
State Hwy A1A<br />
Eastwind Dr<br />
Park Square Pl<br />
Seminole Ave<br />
Tidewater St<br />
Breakers Ct<br />
Ocean Dr<br />
Ocean Dr<br />
Fernandina Rd<br />
88 88<br />
Simmons Rd<br />
Lakeside Dr N<br />
Midway Rd<br />
Amelia Island P kwy<br />
Kenneth Ct<br />
Big Pine Dr<br />
Lakesid e Dr E<br />
Eider Ct<br />
Hutchins Ave<br />
NASSAU COUNTY<br />
30°37'0"N<br />
Airport Rd<br />
Unnamed Street<br />
Altoona Ave<br />
30°37'0"N<br />
87 87<br />
Lynndale Cir<br />
Via del Mar Rd<br />
Alachua Ave<br />
Osceola Ave<br />
Ozello Ave<br />
Fernandina Beach Muni<br />
Lynndale Rd<br />
Amelia Island Pkwy<br />
Via del Rey Rd<br />
Lo s Robles Dr<br />
Zachary Ct<br />
Captains Way<br />
Bill Melton Rd<br />
86 86<br />
30°36'0"N<br />
Marian Dr<br />
Titleist Dr<br />
Canopy Dr<br />
Bean St<br />
r Dr<br />
Spin nak e<br />
Sandpip er Ln<br />
Van D yke Rd<br />
33 85 000m. N<br />
30°36'0"N<br />
4 56 000m. E<br />
US National Grid<br />
100,000-m Square ID<br />
MP<br />
Grid Zone Designation<br />
17R<br />
Datum = NAD 1983, 1,000-m USNG<br />
Philips Manor Rd<br />
Mag. Declination<br />
5 o 41' 24"W<br />
Changing by<br />
4' W per yr<br />
Date 2009<br />
This map is for reference & planning purposes only.<br />
Hurricane evacuation decision-making and growth<br />
management implementation are local responsibilities.<br />
Please consult with local authorities.<br />
#<br />
Diagram<br />
Not to Scale<br />
81°27'0"W<br />
GN<br />
^<br />
57<br />
Notes:<br />
1. Surge limits are based on<br />
still water storm tide height<br />
elevation above NAVD88<br />
at high tide with no wave<br />
setup.<br />
2. Total Storm Tide limits were<br />
derived from Maximum of<br />
Maximums surge heights<br />
over LIDAR based digital<br />
elevation.<br />
3. The Points of Reference are<br />
locations determined to be<br />
relevant to emergency managment<br />
officials.<br />
58<br />
ATLAS LEGEND<br />
®v HOSPITAL<br />
%2 Points of Reference<br />
Evacuation Route<br />
City Limits<br />
NHD Lakes<br />
NHD Major Water<br />
81°26'0"W<br />
Cat<br />
1<br />
2<br />
3<br />
4<br />
5<br />
59<br />
Storm Tide Zones<br />
<strong>Nassau</strong> <strong>County</strong>, 2010<br />
Scale - 1:24,000<br />
Feet<br />
0 2,000<br />
USNG Page 17R MP 56 85<br />
Map Plate 66<br />
81°25'0"W<br />
4 60<br />
116 117<br />
109 110 111 112 113 114 115<br />
99 100 101 105 106 107 102 103 104 108<br />
83 84 85 86 87 88 89 90 91 92 93 94 95 96 97 98<br />
67 68 69 70 71 72 73 74 75 76 77 78 79 80 81 82<br />
52 53 54 55 56 57 58 59 60 61 62 63 64 65 66<br />
37 38 39 40 41 42 43 44 45 46 47 48 49 50 51<br />
24 25 26 27 28 29 30 31<br />
32 33 34 35 36<br />
18 19 20 21 22 23<br />
12 13 14 15 16 17<br />
7 8 9 10 11<br />
4 5 6<br />
1 2 3<br />
85<br />
Produced by <strong>Northeast</strong> <strong>Florida</strong> <strong>Regional</strong> <strong>Council</strong> for <strong>Florida</strong> Division of Emergency Management, 2009-2010<br />
Page 54<br />
Printed Pages in Yellow
Holiday Dr<br />
JW Elliott Dr<br />
Unnamed Street<br />
16<br />
17<br />
81°52'0"W<br />
18<br />
81°51'0"W<br />
19<br />
420<br />
81°50'0"W<br />
95 95<br />
30°41'0"N<br />
30°41'0"N<br />
94 94<br />
30°40'0"N<br />
93 93<br />
30°40'0"N<br />
Unnamed Street<br />
US Hwy 1<br />
92 92<br />
£¤ 1 NASSAU COUNTY<br />
US Hwy 1<br />
M Sikes Rd<br />
30°39'0"N<br />
91 91<br />
30°39'0"N<br />
Holida y Dr E<br />
Kelly Ln<br />
Ivys Pl<br />
£¤ 1<br />
Mills Creek<br />
Unnamed Street<br />
33 90 000m. N<br />
4 16 000m. E<br />
US National Grid<br />
100,000-m Square ID<br />
MP<br />
Grid Zone Designation<br />
17R<br />
Datum = NAD 1983, 1,000-m USNG<br />
Mills Creek<br />
Mag. Declination<br />
5 o 41' 24"W<br />
Changing by<br />
4' W per yr<br />
Date 2009<br />
This map is for reference & planning purposes only.<br />
Hurricane evacuation decision-making and growth<br />
management implementation are local responsibilities.<br />
Please consult with local authorities.<br />
#<br />
Diagram<br />
Not to Scale<br />
GN<br />
81°52'0"W<br />
^<br />
17<br />
£¤ 1<br />
Notes:<br />
1. Surge limits are based on<br />
still water storm tide height<br />
elevation above NAVD88<br />
at high tide with no wave<br />
setup.<br />
2. Total Storm Tide limits were<br />
derived from Maximum of<br />
Maximums surge heights<br />
over LIDAR based digital<br />
elevation.<br />
3. The Points of Reference are<br />
locations determined to be<br />
relevant to emergency managment<br />
officials.<br />
18<br />
ATLAS LEGEND<br />
®v HOSPITAL<br />
%2 Points of Reference<br />
Evacuation Route<br />
City Limits<br />
NHD Lakes<br />
NHD Major Water<br />
81°51'0"W<br />
Cat<br />
1<br />
2<br />
3<br />
4<br />
5<br />
19<br />
D<br />
Storm Tide Zones<br />
<strong>Nassau</strong> <strong>County</strong>, 2010<br />
Scale - 1:24,000<br />
Feet<br />
0 2,000<br />
USNG Page 17R MP 16 90<br />
Map Plate 72<br />
4 20<br />
33 90<br />
81°50'0"W<br />
116 117<br />
109 110 111 112 113 114 115<br />
99 100 101 105 106 107 102 103 104 108<br />
83 84 85 86 87 88 89 90 91 92 93 94 95 96 97 98<br />
67 68 69 70 71 72 73 74 75 76 77 78 79 80 81 82<br />
52 53 54 55 56 57 58 59 60 61 62 63 64 65 66<br />
37 38 39 40 41 42 43 44 45 46 47 48 49 50 51<br />
24 25 26 27 28 29 30 31<br />
32 33 34 35 36<br />
18 19 20 21 22 23<br />
12 13 14 15 16 17<br />
7 8 9 10 11<br />
4 5 6<br />
1 2 3<br />
Produced by <strong>Northeast</strong> <strong>Florida</strong> <strong>Regional</strong> <strong>Council</strong> for <strong>Florida</strong> Division of Emergency Management, 2009-2010<br />
Page 55<br />
Printed Pages in Yellow
Unnamed Street<br />
420<br />
81°50'0"W<br />
21<br />
81°49'0"W<br />
22<br />
23<br />
81°48'0"W<br />
24<br />
95 95<br />
30°41'0"N<br />
30°41'0"N<br />
Middle Rd<br />
94 94<br />
30°40'0"N<br />
93 93<br />
8.2 ft<br />
D<br />
30°40'0"N<br />
NASSAU COUNTY<br />
Unnamed Street<br />
92 92<br />
Unnamed Street<br />
D<br />
6.12 ft<br />
30°39'0"N<br />
Mills Creek<br />
D<br />
5.51 ft<br />
91 91<br />
30°39'0"N<br />
Unnamed Street<br />
D<br />
33 90 000m. N<br />
4 20 000m. E<br />
81°50'0"W<br />
US National Grid<br />
100,000-m Square ID<br />
MP<br />
Grid Zone Designation<br />
17R<br />
Datum = NAD 1983, 1,000-m USNG<br />
Mag. Declination<br />
5 o 41' 24"W<br />
Changing by<br />
4' W per yr<br />
Date 2009<br />
This map is for reference & planning purposes only.<br />
Hurricane evacuation decision-making and growth<br />
management implementation are local responsibilities.<br />
Please consult with local authorities.<br />
#<br />
Diagram<br />
Not to Scale<br />
GN<br />
^<br />
21<br />
Notes:<br />
1. Surge limits are based on<br />
still water storm tide height<br />
elevation above NAVD88<br />
at high tide with no wave<br />
setup.<br />
2. Total Storm Tide limits were<br />
derived from Maximum of<br />
Maximums surge heights<br />
over LIDAR based digital<br />
elevation.<br />
3. The Points of Reference are<br />
locations determined to be<br />
relevant to emergency managment<br />
officials.<br />
81°49'0"W<br />
22<br />
ATLAS LEGEND<br />
®v HOSPITAL<br />
%2 Points of Reference<br />
Evacuation Route<br />
City Limits<br />
NHD Lakes<br />
NHD Major Water<br />
Cat<br />
1<br />
2<br />
3<br />
4<br />
5<br />
23<br />
81°48'0"W<br />
Storm Tide Zones<br />
<strong>Nassau</strong> <strong>County</strong>, 2010<br />
Scale - 1:24,000<br />
Feet<br />
0 2,000<br />
USNG Page 17R MP 20 90<br />
Map Plate 73<br />
Boggy Trl<br />
24<br />
Middle Rd<br />
116 117<br />
109 110 111 112 113 114 115<br />
99 100 101 105 106 107 102 103 104 108<br />
83 84 85 86 87 88 89 90 91 92 93 94 95 96 97 98<br />
67 68 69 70 71 72 73 74 75 76 77 78 79 80 81 82<br />
52 53 54 55 56 57 58 59 60 61 62 63 64 65 66<br />
37 38 39 40 41 42 43 44 45 46 47 48 49 50 51<br />
24 25 26 27 28 29 30 31<br />
32 33 34 35 36<br />
18 19 20 21 22 23<br />
12 13 14 15 16 17<br />
7 8 9 10 11<br />
4 5 6<br />
1 2 3<br />
33 90<br />
Produced by <strong>Northeast</strong> <strong>Florida</strong> <strong>Regional</strong> <strong>Council</strong> for <strong>Florida</strong> Division of Emergency Management, 2009-2010<br />
Page 56<br />
Printed Pages in Yellow
24<br />
25<br />
81°47'0"W<br />
26<br />
81°46'0"W<br />
27<br />
28<br />
81°45'0"W<br />
95 95<br />
30°41'0"N<br />
30°41'0"N<br />
94 94<br />
93 93<br />
30°40'0"N<br />
30°40'0"N<br />
Unnamed Street<br />
NASSAU COUNTY<br />
Braddock Dr<br />
92 92<br />
6.12 ft<br />
D<br />
6.61<br />
Spellcreek Ln<br />
30°39'0"N<br />
Middle Rd<br />
91 ft<br />
91<br />
D<br />
30°39'0"N<br />
33 90 000m. N<br />
Boggy Trl<br />
4 24 000m. E<br />
US National Grid<br />
100,000-m Square ID<br />
MP<br />
Grid Zone Designation<br />
17R<br />
Datum = NAD 1983, 1,000-m USNG<br />
Mag. Declination<br />
5 o 41' 24"W<br />
Changing by<br />
4' W per yr<br />
Date 2009<br />
This map is for reference & planning purposes only.<br />
Hurricane evacuation decision-making and growth<br />
management implementation are local responsibilities.<br />
Please consult with local authorities.<br />
#<br />
Diagram<br />
Not to Scale<br />
GN<br />
81°47'0"W<br />
^<br />
25<br />
Notes:<br />
1. Surge limits are based on<br />
still water storm tide height<br />
elevation above NAVD88<br />
at high tide with no wave<br />
setup.<br />
2. Total Storm Tide limits were<br />
derived from Maximum of<br />
Maximums surge heights<br />
over LIDAR based digital<br />
elevation.<br />
3. The Points of Reference are<br />
locations determined to be<br />
relevant to emergency managment<br />
officials.<br />
26<br />
ATLAS LEGEND<br />
®v HOSPITAL<br />
%2 Points of Reference<br />
Evacuation Route<br />
City Limits<br />
NHD Lakes<br />
NHD Major Water<br />
81°46'0"W<br />
Cat<br />
1<br />
2<br />
3<br />
4<br />
5<br />
27<br />
Storm Tide Zones<br />
<strong>Nassau</strong> <strong>County</strong>, 2010<br />
Scale - 1:24,000<br />
Feet<br />
0 2,000<br />
USNG Page 17R MP 24 90<br />
Map Plate 74<br />
28<br />
81°45'0"W<br />
116 117<br />
109 110 111 112 113 114 115<br />
99 100 101 105 106 107 102 103 104 108<br />
83 84 85 86 87 88 89 90 91 92 93 94 95 96 97 98<br />
67 68 69 70 71 72 73 74 75 76 77 78 79 80 81 82<br />
52 53 54 55 56 57 58 59 60 61 62 63 64 65 66<br />
37 38 39 40 41 42 43 44 45 46 47 48 49 50 51<br />
24 25 26 27 28 29 30 31<br />
32 33 34 35 36<br />
18 19 20 21 22 23<br />
12 13 14 15 16 17<br />
7 8 9 10 11<br />
4 5 6<br />
1 2 3<br />
33 90<br />
Produced by <strong>Northeast</strong> <strong>Florida</strong> <strong>Regional</strong> <strong>Council</strong> for <strong>Florida</strong> Division of Emergency Management, 2009-2010<br />
Page 57<br />
Printed Pages in Yellow
28<br />
81°45'0"W<br />
29<br />
81°44'0"W<br />
430<br />
31<br />
81°43'0"W<br />
32<br />
95 95<br />
Elnora Ln<br />
30°41'0"N<br />
30°41'0"N<br />
94 94<br />
Unnamed Street<br />
D<br />
ft<br />
93 93<br />
30°40'0"N<br />
30°40'0"N<br />
NASSAU COUNTY<br />
13.61<br />
17.09 ft<br />
D<br />
92 92<br />
30°39'0"N<br />
91 91<br />
30°39'0"N<br />
33 90 000m. N<br />
4 28 000m. E<br />
81°45'0"W<br />
US National Grid<br />
100,000-m Square ID<br />
MP<br />
Grid Zone Designation<br />
17R<br />
Datum = NAD 1983, 1,000-m USNG<br />
Mag. Declination<br />
5 o 41' 24"W<br />
Changing by<br />
4' W per yr<br />
Date 2009<br />
This map is for reference & planning purposes only.<br />
Hurricane evacuation decision-making and growth<br />
management implementation are local responsibilities.<br />
Please consult with local authorities.<br />
#<br />
Diagram<br />
Not to Scale<br />
GN<br />
^<br />
29<br />
Notes:<br />
1. Surge limits are based on<br />
still water storm tide height<br />
elevation above NAVD88<br />
at high tide with no wave<br />
setup.<br />
2. Total Storm Tide limits were<br />
derived from Maximum of<br />
Maximums surge heights<br />
over LIDAR based digital<br />
elevation.<br />
3. The Points of Reference are<br />
locations determined to be<br />
relevant to emergency managment<br />
officials.<br />
81°44'0"W<br />
4 30<br />
ATLAS LEGEND<br />
®v HOSPITAL<br />
%2 Points of Reference<br />
Evacuation Route<br />
City Limits<br />
NHD Lakes<br />
NHD Major Water<br />
Cat<br />
1<br />
2<br />
3<br />
4<br />
5<br />
31<br />
81°43'0"W<br />
Storm Tide Zones<br />
<strong>Nassau</strong> <strong>County</strong>, 2010<br />
Scale - 1:24,000<br />
Feet<br />
0 2,000<br />
USNG Page 17R MP 28 90<br />
Map Plate 75<br />
32<br />
116 117<br />
109 110 111 112 113 114 115<br />
99 100 101 105 106 107 102 103 104 108<br />
83 84 85 86 87 88 89 90 91 92 93 94 95 96 97 98<br />
67 68 69 70 71 72 73 74 75 76 77 78 79 80 81 82<br />
52 53 54 55 56 57 58 59 60 61 62 63 64 65 66<br />
37 38 39 40 41 42 43 44 45 46 47 48 49 50 51<br />
24 25 26 27 28 29 30 31<br />
32 33 34 35 36<br />
18 19 20 21 22 23<br />
12 13 14 15 16 17<br />
7 8 9 10 11<br />
4 5 6<br />
1 2 3<br />
33 90<br />
Produced by <strong>Northeast</strong> <strong>Florida</strong> <strong>Regional</strong> <strong>Council</strong> for <strong>Florida</strong> Division of Emergency Management, 2009-2010<br />
Page 58<br />
Printed Pages in Yellow
32<br />
33<br />
81°42'0"W<br />
34<br />
81°41'0"W<br />
35<br />
36<br />
81°40'0"W<br />
95 95<br />
30°41'0"N<br />
30°41'0"N<br />
§¨¦ 95<br />
13.34 ft<br />
D<br />
94 94<br />
I 95<br />
93 93<br />
30°40'0"N<br />
30°40'0"N<br />
I 95<br />
NASSAU COUNTY<br />
92 92<br />
30°39'0"N<br />
91 91<br />
D<br />
4.62 ft<br />
30°39'0"N<br />
Unnamed Street<br />
33 90 000m. N<br />
4 32 000m. E<br />
US National Grid<br />
100,000-m Square ID<br />
MP<br />
Grid Zone Designation<br />
17R<br />
Datum = NAD 1983, 1,000-m USNG<br />
Mag. Declination<br />
5 o 41' 24"W<br />
Changing by<br />
4' W per yr<br />
Date 2009<br />
This map is for reference & planning purposes only.<br />
Hurricane evacuation decision-making and growth<br />
management implementation are local responsibilities.<br />
Please consult with local authorities.<br />
#<br />
Diagram<br />
Not to Scale<br />
GN<br />
81°42'0"W<br />
^<br />
33<br />
Notes:<br />
1. Surge limits are based on<br />
still water storm tide height<br />
elevation above NAVD88<br />
at high tide with no wave<br />
setup.<br />
2. Total Storm Tide limits were<br />
derived from Maximum of<br />
Maximums surge heights<br />
over LIDAR based digital<br />
elevation.<br />
3. The Points of Reference are<br />
locations determined to be<br />
relevant to emergency managment<br />
officials.<br />
34<br />
ATLAS LEGEND<br />
®v HOSPITAL<br />
%2 Points of Reference<br />
Evacuation Route<br />
City Limits<br />
NHD Lakes<br />
NHD Major Water<br />
81°41'0"W<br />
Cat<br />
1<br />
2<br />
3<br />
4<br />
5<br />
35<br />
Storm Tide Zones<br />
<strong>Nassau</strong> <strong>County</strong>, 2010<br />
Scale - 1:24,000<br />
Feet<br />
0 2,000<br />
USNG Page 17R MP 32 90<br />
Map Plate 76<br />
36<br />
Wildwood Rd<br />
81°40'0"W<br />
116 117<br />
109 110 111 112 113 114 115<br />
99 100 101 105 106 107 102 103 104 108<br />
83 84 85 86 87 88 89 90 91 92 93 94 95 96 97 98<br />
67 68 69 70 71 72 73 74 75 76 77 78 79 80 81 82<br />
52 53 54 55 56 57 58 59 60 61 62 63 64 65 66<br />
37 38 39 40 41 42 43 44 45 46 47 48 49 50 51<br />
24 25 26 27 28 29 30 31<br />
32 33 34 35 36<br />
18 19 20 21 22 23<br />
12 13 14 15 16 17<br />
7 8 9 10 11<br />
4 5 6<br />
1 2 3<br />
33 90<br />
Produced by <strong>Northeast</strong> <strong>Florida</strong> <strong>Regional</strong> <strong>Council</strong> for <strong>Florida</strong> Division of Emergency Management, 2009-2010<br />
Page 59<br />
Printed Pages in Yellow
36<br />
81°40'0"W<br />
37<br />
81°39'0"W<br />
38<br />
39<br />
81°38'0"W<br />
440<br />
<strong>County</strong> Hwy 108<br />
95 95<br />
30°41'0"N<br />
Crandall Rd<br />
30°41'0"N<br />
I 95<br />
94 94<br />
Unnamed Street<br />
§¨¦ 95<br />
BECKER<br />
30°40'0"N<br />
NASSAU COUNTY<br />
D<br />
13.53 ft<br />
Parker Rd<br />
Unnamed Street<br />
93 93<br />
30°40'0"N<br />
§¨¦ 95 §¨¦ 95<br />
92 92<br />
Quail Ridge Rd<br />
Tom Burney Rd<br />
US Hwy 17<br />
Unnamed Street<br />
30°39'0"N<br />
91 91<br />
30°39'0"N<br />
33 90 000m. N<br />
4 36 000m. E<br />
Wildwood Rd<br />
81°40'0"W<br />
US National Grid<br />
100,000-m Square ID<br />
MP<br />
Grid Zone Designation<br />
17R<br />
Datum = NAD 1983, 1,000-m USNG<br />
Mag. Declination<br />
5 o 41' 24"W<br />
Changing by<br />
4' W per yr<br />
Date 2009<br />
This map is for reference & planning purposes only.<br />
Hurricane evacuation decision-making and growth<br />
management implementation are local responsibilities.<br />
Please consult with local authorities.<br />
#<br />
Diagram<br />
Not to Scale<br />
GN<br />
^<br />
I 95<br />
37<br />
Notes:<br />
1. Surge limits are based on<br />
still water storm tide height<br />
elevation above NAVD88<br />
at high tide with no wave<br />
setup.<br />
2. Total Storm Tide limits were<br />
derived from Maximum of<br />
Maximums surge heights<br />
over LIDAR based digital<br />
elevation.<br />
3. The Points of Reference are<br />
locations determined to be<br />
relevant to emergency managment<br />
officials.<br />
81°39'0"W<br />
38<br />
ATLAS LEGEND<br />
®v HOSPITAL<br />
%2 Points of Reference<br />
Evacuation Route<br />
City Limits<br />
NHD Lakes<br />
NHD Major Water<br />
Cat<br />
1<br />
2<br />
3<br />
4<br />
5<br />
39<br />
81°38'0"W<br />
Storm Tide Zones<br />
<strong>Nassau</strong> <strong>County</strong>, 2010<br />
Scale - 1:24,000<br />
Feet<br />
0 2,000<br />
USNG Page 17R MP 36 90<br />
Map Plate 77<br />
4 40<br />
116 117<br />
109 110 111 112 113 114 115<br />
99 100 101 105 106 107 102 103 104 108<br />
83 84 85 86 87 88 89 90 91 92 93 94 95 96 97 98<br />
67 68 69 70 71 72 73 74 75 76 77 78 79 80 81 82<br />
52 53 54 55 56 57 58 59 60 61 62 63 64 65 66<br />
37 38 39 40 41 42 43 44 45 46 47 48 49 50 51<br />
24 25 26 27 28 29 30 31<br />
32 33 34 35 36<br />
18 19 20 21 22 23<br />
12 13 14 15 16 17<br />
7 8 9 10 11<br />
4 5 6<br />
1 2 3<br />
33 90<br />
Produced by <strong>Northeast</strong> <strong>Florida</strong> <strong>Regional</strong> <strong>Council</strong> for <strong>Florida</strong> Division of Emergency Management, 2009-2010<br />
Page 60<br />
Printed Pages in Yellow
440<br />
41<br />
81°37'0"W<br />
42<br />
81°36'0"W<br />
43<br />
44<br />
81°35'0"W<br />
95 95<br />
30°41'0"N<br />
30°41'0"N<br />
94 94<br />
Unnamed Street<br />
5.89 ft<br />
D<br />
11.13<br />
Unnamed Street<br />
93 93<br />
30°40'0"N<br />
30°40'0"N<br />
NASSAU COUNTY<br />
92 92<br />
Tom Burney Rd<br />
D<br />
91 91<br />
30°39'0"N<br />
Bird Ln<br />
Deer Ln<br />
Susi Ln<br />
Goodbread Dr<br />
ft<br />
30°39'0"N<br />
Goodbread Rd<br />
D<br />
US Hwy 17<br />
Hamilton Rd<br />
33 90 000m. N<br />
4 40 000m. E<br />
US National Grid<br />
100,000-m Square ID<br />
MP<br />
Grid Zone Designation<br />
17R<br />
Datum = NAD 1983, 1,000-m USNG<br />
Mag. Declination<br />
5 o 41' 24"W<br />
Changing by<br />
4' W per yr<br />
Date 2009<br />
This map is for reference & planning purposes only.<br />
Hurricane evacuation decision-making and growth<br />
management implementation are local responsibilities.<br />
Please consult with local authorities.<br />
#<br />
Diagram<br />
Not to Scale<br />
81°37'0"W<br />
GN<br />
^<br />
41<br />
Hamilton St<br />
Notes:<br />
1. Surge limits are based on<br />
still water storm tide height<br />
elevation above NAVD88<br />
at high tide with no wave<br />
setup.<br />
2. Total Storm Tide limits were<br />
derived from Maximum of<br />
Maximums surge heights<br />
over LIDAR based digital<br />
elevation.<br />
3. The Points of Reference are<br />
locations determined to be<br />
relevant to emergency managment<br />
officials.<br />
42<br />
ATLAS LEGEND<br />
®v HOSPITAL<br />
%2 Points of Reference<br />
Evacuation Route<br />
City Limits<br />
NHD Lakes<br />
NHD Major Water<br />
81°36'0"W<br />
Cat<br />
1<br />
2<br />
3<br />
4<br />
5<br />
43<br />
Storm Tide Zones<br />
<strong>Nassau</strong> <strong>County</strong>, 2010<br />
Scale - 1:24,000<br />
Feet<br />
0 2,000<br />
USNG Page 17R MP 40 90<br />
Map Plate 78<br />
44<br />
81°35'0"W<br />
116 117<br />
109 110 111 112 113 114 115<br />
99 100 101 105 106 107 102 103 104 108<br />
83 84 85 86 87 88 89 90 91 92 93 94 95 96 97 98<br />
67 68 69 70 71 72 73 74 75 76 77 78 79 80 81 82<br />
52 53 54 55 56 57 58 59 60 61 62 63 64 65 66<br />
37 38 39 40 41 42 43 44 45 46 47 48 49 50 51<br />
24 25 26 27 28 29 30 31<br />
32 33 34 35 36<br />
18 19 20 21 22 23<br />
12 13 14 15 16 17<br />
7 8 9 10 11<br />
4 5 6<br />
1 2 3<br />
33 90<br />
Produced by <strong>Northeast</strong> <strong>Florida</strong> <strong>Regional</strong> <strong>Council</strong> for <strong>Florida</strong> Division of Emergency Management, 2009-2010<br />
Page 61<br />
Printed Pages in Yellow
Roses Bluff Rd<br />
%2<br />
44<br />
81°35'0"W<br />
45<br />
81°34'0"W<br />
46<br />
47<br />
81°33'0"W<br />
48<br />
95 95<br />
30°41'0"N<br />
Bell River Rd<br />
Brooker Rd<br />
Gannett Ave<br />
Fen Ave<br />
Lovers Ln<br />
Bellville Ln<br />
30°41'0"N<br />
94 16.51 ft<br />
94<br />
D<br />
Haven Rd<br />
Lente Rd<br />
Solomon Rd<br />
Chester River Rd<br />
Lee Rnch<br />
Radden Rd<br />
Converse Ln<br />
93 93<br />
Water Oak Rd<br />
30°40'0"N<br />
30°40'0"N<br />
Unnamed Street<br />
NASSAU COUNTY<br />
Lee Rd<br />
92 92<br />
Hillvally Ave<br />
Hill Valley Ave<br />
Jean Rd<br />
Melissa Rd<br />
Yulee Hills Rd<br />
Chester Rd<br />
Glen Briar Ln<br />
30°39'0"N<br />
Timber Ridge St<br />
91 91<br />
Debbie Rd<br />
Pamela Rd<br />
Blounts Branch<br />
Rayonier Rd<br />
30°39'0"N<br />
33 90 000m. N<br />
81°35'0"W<br />
4 44 000m. E<br />
US National Grid<br />
100,000-m Square ID<br />
MP<br />
Grid Zone Designation<br />
17R<br />
Datum = NAD 1983, 1,000-m USNG<br />
D<br />
4.77 ft<br />
Mag. Declination<br />
5 o 41' 24"W<br />
Changing by<br />
4' W per yr<br />
Date 2009<br />
This map is for reference & planning purposes only.<br />
Hurricane evacuation decision-making and growth<br />
management implementation are local responsibilities.<br />
Please consult with local authorities.<br />
#<br />
Diagram<br />
Not to Scale<br />
GN<br />
^<br />
45<br />
Yulee Hills Rd E<br />
Bobby Dr<br />
Pages Dairy Rd<br />
Pages Diary Rd<br />
Notes:<br />
1. Surge limits are based on<br />
still water storm tide height<br />
elevation above NAVD88<br />
at high tide with no wave<br />
setup.<br />
2. Total Storm Tide limits were<br />
derived from Maximum of<br />
Maximums surge heights<br />
over LIDAR based digital<br />
elevation.<br />
3. The Points of Reference are<br />
locations determined to be<br />
relevant to emergency managment<br />
officials.<br />
81°34'0"W<br />
46<br />
ATLAS LEGEND<br />
®v HOSPITAL<br />
%2 Points of Reference<br />
Evacuation Route<br />
City Limits<br />
NHD Lakes<br />
NHD Major Water<br />
Rayonier Service Rd<br />
Cat<br />
1<br />
2<br />
3<br />
4<br />
5<br />
47<br />
81°33'0"W<br />
Storm Tide Zones<br />
<strong>Nassau</strong> <strong>County</strong>, 2010<br />
Scale - 1:24,000<br />
Feet<br />
0 2,000<br />
USNG Page 17R MP 44 90<br />
Map Plate 79<br />
48<br />
116 117<br />
109 110 111 112 113 114 115<br />
99 100 101 105 106 107 102 103 104 108<br />
83 84 85 86 87 88 89 90 91 92 93 94 95 96 97 98<br />
67 68 69 70 71 72 73 74 75 76 77 78 79 80 81 82<br />
52 53 54 55 56 57 58 59 60 61 62 63 64 65 66<br />
37 38 39 40 41 42 43 44 45 46 47 48 49 50 51<br />
24 25 26 27 28 29 30 31<br />
32 33 34 35 36<br />
18 19 20 21 22 23<br />
12 13 14 15 16 17<br />
7 8 9 10 11<br />
4 5 6<br />
1 2 3<br />
33 90<br />
Produced by <strong>Northeast</strong> <strong>Florida</strong> <strong>Regional</strong> <strong>Council</strong> for <strong>Florida</strong> Division of Emergency Management, 2009-2010<br />
Page 62<br />
Printed Pages in Yellow
%2<br />
48<br />
49<br />
81°32'0"W<br />
450<br />
81°31'0"W<br />
51<br />
52<br />
81°30'0"W<br />
95 95<br />
Cape St<br />
Bellville Ln<br />
30°41'0"N<br />
Lovers Ln<br />
Chester River Rd<br />
Clover Ln<br />
Lee Rnch<br />
Iris Ln<br />
Hursey Dr<br />
Eagle Ln<br />
Daniel Ln<br />
Mitchell Rd<br />
Daniels Ln<br />
Long Johns Trl<br />
Peg Leg<br />
Blackbeards Way<br />
Morgans Way<br />
94 94<br />
Laffites Way<br />
30°41'0"N<br />
Caravel Trl<br />
Pirates Point Rd<br />
Roses Bluff Rd<br />
Cutlass Way<br />
Italla Way<br />
Doubloon Way<br />
Pirates Way<br />
D<br />
15.55 ft<br />
Glen Ct<br />
30°40'0"N<br />
Water Oak Rd<br />
Lee Rd<br />
Topaz Ct<br />
Diamond St<br />
Amy Dr<br />
Green Pine Rd<br />
Tigers Eye St<br />
Italla Way<br />
Bo Daddy Rd<br />
Bedell Rd<br />
Wisteria Ln<br />
93 93<br />
Cookville Rd<br />
NASSAU COUNTY<br />
Unnamed Street<br />
Cedar Ave<br />
Unnamed Street<br />
Groover Ln<br />
Chandler Ln<br />
92 92<br />
Cedar Ave<br />
30°40'0"N<br />
30°39'0"N<br />
Chester Rd<br />
Sweetbriar Ln N<br />
Sweet b riar Ln S<br />
Rayonier Rd<br />
Conner Ln<br />
Brighton Pl<br />
Glenwood Oaks Rd<br />
Freeman Rd<br />
Unnamed Street<br />
Maranatha Rd<br />
Lang Rd<br />
Lanceford Ln<br />
Heath Point Ln<br />
Barnwell Rd<br />
Cran e St<br />
Oyster Bay Dr<br />
Bay View Dr<br />
Light Wind Dr<br />
91 91<br />
Northshore Dr<br />
30°39'0"N<br />
<strong>County</strong> Hwy 107<br />
Crews Creek Ave<br />
Azalea Ln<br />
33 90 000m. N<br />
4 48 000m. E<br />
US National Grid<br />
100,000-m Square ID<br />
MP<br />
Grid Zone Designation<br />
17R<br />
Datum = NAD 1983, 1,000-m USNG<br />
Mag. Declination<br />
5 o 41' 24"W<br />
Changing by<br />
4' W per yr<br />
Date 2009<br />
This map is for reference & planning purposes only.<br />
Hurricane evacuation decision-making and growth<br />
management implementation are local responsibilities.<br />
Please consult with local authorities.<br />
81°32'0"W<br />
Produced by <strong>Northeast</strong> <strong>Florida</strong> <strong>Regional</strong> <strong>Council</strong> for <strong>Florida</strong> Division of Emergency Management, 2009-2010<br />
#<br />
Diagram<br />
Not to Scale<br />
GN<br />
^<br />
49<br />
Yahtzee Rd<br />
Durden Rd<br />
Pirates Bluff Rd<br />
Notes:<br />
1. Surge limits are based on<br />
still water storm tide height<br />
elevation above NAVD88<br />
at high tide with no wave<br />
setup.<br />
2. Total Storm Tide limits were<br />
derived from Maximum of<br />
Maximums surge heights<br />
over LIDAR based digital<br />
elevation.<br />
3. The Points of Reference are<br />
locations determined to be<br />
relevant to emergency managment<br />
officials.<br />
Water Rd<br />
4 50<br />
ATLAS LEGEND<br />
®v HOSPITAL<br />
%2 Points of Reference<br />
Evacuation Route<br />
City Limits<br />
NHD Lakes<br />
NHD Major Water<br />
Page 63<br />
Osprey Point Ln<br />
Sawgrass Cove Trl<br />
81°31'0"W<br />
Cat<br />
1<br />
2<br />
3<br />
4<br />
5<br />
River Marsh Bnd<br />
River Marsh Dr<br />
Palm Bluff Dr<br />
51<br />
Storm Tide Zones<br />
<strong>Nassau</strong> <strong>County</strong>, 2010<br />
Scale - 1:24,000<br />
Feet<br />
0 2,000<br />
USNG Page 17R MP 48 90<br />
Map Plate 80<br />
Amelia River<br />
81°30'0"W<br />
52<br />
116 117<br />
109 110 111 112 113 114 115<br />
99 100 101 105 106 107 102 103 104 108<br />
83 84 85 86 87 88 89 90 91 92 93 94 95 96 97 98<br />
67 68 69 70 71 72 73 74 75 76 77 78 79 80 81 82<br />
52 53 54 55 56 57 58 59 60 61 62 63 64 65 66<br />
37 38 39 40 41 42 43 44 45 46 47 48 49 50 51<br />
24 25 26 27 28 29 30 31<br />
32 33 34 35 36<br />
18 19 20 21 22 23<br />
12 13 14 15 16 17<br />
7 8 9 10 11<br />
4 5 6<br />
1 2 3<br />
Printed Pages in Yellow<br />
33 90
52<br />
81°30'0"W<br />
53<br />
81°29'0"W<br />
54<br />
55<br />
81°28'0"W<br />
%2<br />
56<br />
95 95<br />
Saint Joseph Creek<br />
30°41'0"N<br />
30°41'0"N<br />
94 94<br />
Escambia St<br />
30°40'0"N<br />
NASSAU COUNTY<br />
W Front St<br />
Jackson Creek<br />
N 2nd St<br />
FERNANDINA BEACH<br />
93 93<br />
92 92<br />
S Front St<br />
N Front St<br />
S 3rd St<br />
Elm St<br />
N 3rd St<br />
S 4th St<br />
S 6th St<br />
Fir St<br />
Gum St<br />
N 4th St<br />
Alachua St<br />
S 5th St<br />
S 7th St<br />
Dade St<br />
Calhoun St<br />
Broome St<br />
Centre St<br />
Beech St<br />
Cedar St<br />
Date St<br />
Elm St<br />
Hickory St<br />
Indigo St<br />
N 7th St<br />
N 8th St<br />
N 9th St<br />
N 10th St<br />
S 9th St<br />
S 11th St<br />
S 10th St<br />
Jasmine St<br />
Division St<br />
S 12th St<br />
30°40'0"N<br />
Geiger Rd<br />
Kelp St<br />
S 4th St<br />
S 5th St<br />
S 6th St<br />
Lime St<br />
Olive St<br />
S 3rd St<br />
UV 200 UV 105A<br />
91 91<br />
30°39'0"N<br />
Amelia River<br />
Pine Trl<br />
Everglades Ln<br />
Periwinkle Ln<br />
30°39'0"N<br />
State Hwy 200<br />
Landress Ln<br />
Clinch Dr<br />
Geiger Rd<br />
Courson Rd<br />
33 90 000m. N<br />
81°30'0"W<br />
4 52 000m. E<br />
US National Grid<br />
100,000-m Square ID<br />
MP<br />
Grid Zone Designation<br />
17R<br />
Datum = NAD 1983, 1,000-m USNG<br />
Mag. Declination<br />
5 o 41' 24"W<br />
Changing by<br />
4' W per yr<br />
Date 2009<br />
This map is for reference & planning purposes only.<br />
Hurricane evacuation decision-making and growth<br />
management implementation are local responsibilities.<br />
Please consult with local authorities.<br />
#<br />
Diagram<br />
Not to Scale<br />
GN<br />
^<br />
53<br />
Notes:<br />
1. Surge limits are based on<br />
still water storm tide height<br />
elevation above NAVD88<br />
at high tide with no wave<br />
setup.<br />
2. Total Storm Tide limits were<br />
derived from Maximum of<br />
Maximums surge heights<br />
over LIDAR based digital<br />
elevation.<br />
3. The Points of Reference are<br />
locations determined to be<br />
relevant to emergency managment<br />
officials.<br />
81°29'0"W<br />
54<br />
ATLAS LEGEND<br />
®v HOSPITAL<br />
%2 Points of Reference<br />
Evacuation Route<br />
City Limits<br />
NHD Lakes<br />
NHD Major Water<br />
Cat<br />
1<br />
2<br />
3<br />
4<br />
5<br />
55<br />
81°28'0"W<br />
Storm Tide Zones<br />
<strong>Nassau</strong> <strong>County</strong>, 2010<br />
Scale - 1:24,000<br />
Feet<br />
0 2,000<br />
USNG Page 17R MP 52 90<br />
Map Plate 81<br />
Clinch Cir<br />
Wax Wing Ln<br />
Wren Dr<br />
56<br />
116 117<br />
109 110 111 112 113 114 115<br />
99 100 101 105 106 107 102 103 104 108<br />
83 84 85 86 87 88 89 90 91 92 93 94 95 96 97 98<br />
67 68 69 70 71 72 73 74 75 76 77 78 79 80 81 82<br />
52 53 54 55 56 57 58 59 60 61 62 63 64 65 66<br />
37 38 39 40 41 42 43 44 45 46 47 48 49 50 51<br />
24 25 26 27 28 29 30 31<br />
32 33 34 35 36<br />
18 19 20 21 22 23<br />
12 13 14 15 16 17<br />
7 8 9 10 11<br />
4 5 6<br />
1 2 3<br />
33 90<br />
Produced by <strong>Northeast</strong> <strong>Florida</strong> <strong>Regional</strong> <strong>Council</strong> for <strong>Florida</strong> Division of Emergency Management, 2009-2010<br />
Page 64<br />
Printed Pages in Yellow
%2<br />
56<br />
57<br />
81°27'0"W<br />
58<br />
81°26'0"W<br />
59<br />
460<br />
81°25'0"W<br />
Garden St<br />
Lisa Ave<br />
Magnolia St<br />
<strong>Nassau</strong> St<br />
1 4th Pl<br />
Highland Dr<br />
95 95<br />
N<br />
30°41'0"N<br />
30°40'0"N<br />
N 4th St<br />
S 5th St<br />
N 5th St<br />
S 6th St<br />
S 7th St<br />
Escambia St<br />
Dade St<br />
N 6th St<br />
N 7th St<br />
Centre St<br />
N 8th St<br />
N 9th St<br />
Ash St<br />
S 9th St<br />
S 11th St<br />
Calhoun St<br />
N 10th St<br />
N 11th St<br />
Beech St<br />
Cedar St<br />
Division St<br />
Date St<br />
Elm St<br />
Fir St<br />
Vernon St<br />
Franklin St<br />
N 12th St<br />
S 13th St<br />
S 13th Ter<br />
N Vernon St<br />
N 13th St<br />
N 13th St<br />
N 14th St<br />
N 13th Ter<br />
N 15th St<br />
Oak Grove Pl<br />
S 15th St<br />
Benjamin St<br />
S 16th St<br />
Leon St<br />
S 17th St<br />
15th Ct<br />
N 15th St<br />
Amelia Cir<br />
Broome St<br />
N 16th St<br />
Highland Dr<br />
Amelia Dr<br />
Dade St<br />
N 17th St<br />
Stanley Dr<br />
Highland St<br />
Ash St<br />
S 18th St<br />
S 19th St<br />
Regina Dr<br />
N 18th St<br />
N 19th St<br />
Amelia Ave<br />
Alachua St<br />
Citrona Dr<br />
Sunrise Dr<br />
94 94<br />
<strong>Florida</strong> Ave<br />
State Hwy 200<br />
NASSAU COUNTY<br />
Elm St<br />
Lighthouse Cir<br />
N Wolff St<br />
93 93<br />
Belvedere Ave<br />
Fort Glinch<br />
Laura St<br />
Dolphin<br />
6th St<br />
Ellen St<br />
Tarpon Ave<br />
Mary<br />
W 5th St<br />
W 4th St<br />
Trout St<br />
Ohio Ave<br />
N Fletcher Ave<br />
W 1st St<br />
10th St<br />
9th St<br />
8th St<br />
Ocean Ave<br />
30°41'0"N<br />
30°40'0"N<br />
Jean Lafitte Blvd<br />
Hickory St<br />
Indigo St<br />
S 10th St<br />
Kelp St<br />
Gum St<br />
Division St<br />
S 12th St<br />
Vernon St<br />
92 92<br />
State Hwy 105A<br />
Jasmine St<br />
S 18th St<br />
S 19th St<br />
Gum St<br />
Indigo St<br />
Starboard Lndg<br />
A<br />
Laguna Dr<br />
iew Dr<br />
tlantic V<br />
Ocean Mist Dr<br />
Ocean Sound Dr<br />
30°39'0"N<br />
Olive St<br />
Lime St<br />
Nectarine St<br />
S 18th St<br />
®v<br />
N Pike Ln<br />
Natures Ln W<br />
Village Ln<br />
Marlin Ct<br />
N Ridg e Ln<br />
Blue Heron Ln<br />
Oak Ridge Dr<br />
Egans Creek<br />
Oce an Oaks Dr S<br />
91 91<br />
Jean Lafe<br />
tte Blvd<br />
State Hwy A1A<br />
30°39'0"N<br />
Oceanwalk Ct<br />
33 90 000m. N<br />
Wren Dr<br />
UV 200 UV 105A<br />
T J Courson Rd<br />
Courson Rd<br />
4 56 000m. E<br />
US National Grid<br />
100,000-m Square ID<br />
MP<br />
Grid Zone Designation<br />
17R<br />
Datum = NAD 1983, 1,000-m USNG<br />
Mag. Declination<br />
5 o 41' 24"W<br />
Changing by<br />
4' W per yr<br />
Date 2009<br />
This map is for reference & planning purposes only.<br />
Hurricane evacuation decision-making and growth<br />
management implementation are local responsibilities.<br />
Please consult with local authorities.<br />
#<br />
Park Ave<br />
Gardenia St<br />
Diagram<br />
Not to Scale<br />
Lake Park Dr<br />
81°27'0"W<br />
GN<br />
^<br />
Jekyll Ct<br />
Cumberland Ct<br />
Talbot Ct<br />
57<br />
Pheasant Ln<br />
Mallard Ln<br />
Drury Rd<br />
Notes:<br />
1. Surge limits are based on<br />
still water storm tide height<br />
elevation above NAVD88<br />
at high tide with no wave<br />
setup.<br />
2. Total Storm Tide limits were<br />
derived from Maximum of<br />
Maximums surge heights<br />
over LIDAR based digital<br />
elevation.<br />
3. The Points of Reference are<br />
locations determined to be<br />
relevant to emergency managment<br />
officials.<br />
Racheal Ave<br />
1st Ave<br />
Madison Ave<br />
58<br />
1st Ave<br />
ATLAS LEGEND%2<br />
®v HOSPITAL<br />
%2 Points of Reference<br />
Evacuation Route<br />
City Limits<br />
NHD Lakes<br />
NHD Major Water<br />
81°26'0"W<br />
Cat<br />
1<br />
2<br />
3<br />
4<br />
5<br />
59<br />
Storm Tide Zones<br />
<strong>Nassau</strong> <strong>County</strong>, 2010<br />
Scale - 1:24,000<br />
Feet<br />
0 2,000<br />
USNG Page 17R MP 56 90<br />
Map Plate 82<br />
4 60<br />
81°25'0"W<br />
116 117<br />
109 110 111 112 113 114 115<br />
99 100 101 105 106 107 102 103 104 108<br />
83 84 85 86 87 88 89 90 91 92 93 94 95 96 97 98<br />
67 68 69 70 71 72 73 74 75 76 77 78 79 80 81 82<br />
52 53 54 55 56 57 58 59 60 61 62 63 64 65 66<br />
37 38 39 40 41 42 43 44 45 46 47 48 49 50 51<br />
24 25 26 27 28 29 30 31<br />
32 33 34 35 36<br />
18 19 20 21 22 23<br />
12 13 14 15 16 17<br />
7 8 9 10 11<br />
4 5 6<br />
1 2 3<br />
33 90<br />
Produced by <strong>Northeast</strong> <strong>Florida</strong> <strong>Regional</strong> <strong>Council</strong> for <strong>Florida</strong> Division of Emergency Management, 2009-2010<br />
Page 65<br />
Printed Pages in Yellow
Eastwood Rd<br />
Bulford Rd<br />
12<br />
81°55'0"W<br />
13<br />
81°54'0"W<br />
14<br />
15<br />
81°53'0"W<br />
16<br />
Little Saint Marys River<br />
34 00 34 00<br />
<strong>County</strong> Hwy 115A<br />
Oak Grove Dr<br />
99 99<br />
30°43'0"N<br />
30°43'0"N<br />
Libby Rd<br />
98 98<br />
Unnamed Street<br />
30°42'0"N<br />
33<br />
30°41'0"N 95 000m. N<br />
Oxford St<br />
W 4th St<br />
US Hwy 1<br />
Orange St<br />
W 3rd St<br />
Pecan St<br />
Railroad St<br />
4 12 000m. E<br />
Ruby Dr<br />
Mill St<br />
HILLIARD<br />
W 1st St<br />
US Hwy 1<br />
81°55'0"W<br />
W <strong>County</strong> Hwy 108<br />
Frog Holw<br />
Unnamed Street<br />
Wine Dr<br />
Unnamed Street<br />
Poole Rd<br />
Pineridge Rd<br />
Unnamed Street<br />
W <strong>County</strong> Road 108<br />
£¤ 1 NASSAU COUNTY<br />
13<br />
81°54'0"W<br />
14<br />
15<br />
81°53'0"W<br />
Unnamed Street<br />
97 97<br />
96 96<br />
US National Grid<br />
100,000-m Square ID<br />
MP<br />
Grid Zone Designation<br />
17R<br />
Datum = NAD 1983, 1,000-m USNG<br />
Mag. Declination<br />
5 o 41' 24"W<br />
Changing by<br />
4' W per yr<br />
Date 2009<br />
This map is for reference & planning purposes only.<br />
Hurricane evacuation decision-making and growth<br />
management implementation are local responsibilities.<br />
Please consult with local authorities.<br />
Produced by <strong>Northeast</strong> <strong>Florida</strong> <strong>Regional</strong> <strong>Council</strong> for <strong>Florida</strong> Division of Emergency Management, 2009-2010<br />
#<br />
Diagram<br />
Not to Scale<br />
GN<br />
^<br />
Notes:<br />
1. Surge limits are based on<br />
still water storm tide height<br />
elevation above NAVD88<br />
at high tide with no wave<br />
setup.<br />
2. Total Storm Tide limits were<br />
derived from Maximum of<br />
Maximums surge heights<br />
over LIDAR based digital<br />
elevation.<br />
3. The Points of Reference are<br />
locations determined to be<br />
relevant to emergency managment<br />
officials.<br />
ATLAS LEGEND<br />
®v HOSPITAL<br />
%2 Points of Reference<br />
Evacuation Route<br />
City Limits<br />
NHD Lakes<br />
NHD Major Water<br />
Page 66<br />
Cat<br />
1<br />
2<br />
3<br />
4<br />
5<br />
Storm Tide Zones<br />
<strong>Nassau</strong> <strong>County</strong>, 2010<br />
Scale - 1:24,000<br />
Feet<br />
0 2,000<br />
USNG Page 17R MP 12 95<br />
Map Plate 87<br />
83<br />
67<br />
84<br />
68<br />
85<br />
69<br />
52 53 54 55 56 57<br />
37 38 39 40 41 42<br />
24 25 26 27 28 29<br />
18 19 20 21 22 23<br />
12 13 14 15 16 17<br />
7 8 9 10 11<br />
4 5 6<br />
1 2 3<br />
86<br />
70<br />
87<br />
71<br />
88<br />
72<br />
89<br />
73<br />
16<br />
116 117<br />
109 110 111 112 113 114 115<br />
99 100 101 105 106 107 102 103 104 108<br />
90<br />
74<br />
58<br />
43<br />
30<br />
91 92<br />
75 76<br />
59 60<br />
44 45<br />
31<br />
93<br />
77<br />
61<br />
46<br />
94<br />
78<br />
62<br />
47<br />
32<br />
95<br />
79<br />
63<br />
48<br />
33<br />
Printed Pages in Yellow<br />
96<br />
80<br />
64<br />
49<br />
34<br />
97<br />
81<br />
65<br />
50<br />
35<br />
30°42'0"N<br />
98<br />
82<br />
66<br />
51<br />
36<br />
95
16<br />
17<br />
81°52'0"W<br />
18<br />
81°51'0"W<br />
19<br />
420<br />
81°50'0"W<br />
34 00 34 00<br />
Little Saint Marys River<br />
D<br />
2 ft<br />
99 99<br />
30°43'0"N<br />
30°43'0"N<br />
98 D<br />
98<br />
5 ft<br />
NASSAU COUNTY<br />
97 97<br />
30°42'0"N<br />
30°42'0"N<br />
W <strong>County</strong> Road 108<br />
96 96<br />
33 95 000m. N<br />
4 16 000m. E<br />
US National Grid<br />
100,000-m Square ID<br />
MP<br />
Grid Zone Designation<br />
17R<br />
Datum = NAD 1983, 1,000-m USNG<br />
Mag. Declination<br />
5 o 41' 24"W<br />
Changing by<br />
4' W per yr<br />
Date 2009<br />
This map is for reference & planning purposes only.<br />
Hurricane evacuation decision-making and growth<br />
management implementation are local responsibilities.<br />
Please consult with local authorities.<br />
#<br />
Diagram<br />
Not to Scale<br />
GN<br />
^<br />
81°52'0"W<br />
17<br />
Notes:<br />
1. Surge limits are based on<br />
still water storm tide height<br />
elevation above NAVD88<br />
at high tide with no wave<br />
setup.<br />
2. Total Storm Tide limits were<br />
derived from Maximum of<br />
Maximums surge heights<br />
over LIDAR based digital<br />
elevation.<br />
3. The Points of Reference are<br />
locations determined to be<br />
relevant to emergency managment<br />
officials.<br />
18<br />
ATLAS LEGEND<br />
®v HOSPITAL<br />
%2 Points of Reference<br />
Evacuation Route<br />
City Limits<br />
NHD Lakes<br />
NHD Major Water<br />
81°51'0"W<br />
Cat<br />
1<br />
2<br />
3<br />
4<br />
5<br />
19<br />
Storm Tide Zones<br />
<strong>Nassau</strong> <strong>County</strong>, 2010<br />
Scale - 1:24,000<br />
Feet<br />
0 2,000<br />
USNG Page 17R MP 16 95<br />
Map Plate 88<br />
Unnamed Street<br />
4 20<br />
81°50'0"W<br />
116 117<br />
109 110 111 112 113 114 115<br />
99 100 101 105 106 107 102 103 104 108<br />
83 84 85 86 87 88 89 90 91 92 93 94 95 96 97 98<br />
67 68 69 70 71 72 73 74 75 76 77 78 79 80 81 82<br />
52 53 54 55 56 57 58 59 60 61 62 63 64 65 66<br />
37 38 39 40 41 42 43 44 45 46 47 48 49 50 51<br />
24 25 26 27 28 29 30 31<br />
32 33 34 35 36<br />
18 19 20 21 22 23<br />
12 13 14 15 16 17<br />
7 8 9 10 11<br />
4 5 6<br />
1 2 3<br />
95<br />
Produced by <strong>Northeast</strong> <strong>Florida</strong> <strong>Regional</strong> <strong>Council</strong> for <strong>Florida</strong> Division of Emergency Management, 2009-2010<br />
Page 67<br />
Printed Pages in Yellow
420<br />
81°50'0"W<br />
21<br />
81°49'0"W<br />
22<br />
23<br />
81°48'0"W<br />
24<br />
34 00 34 00<br />
State Hwy 121A<br />
99 99<br />
30°43'0"N<br />
Coopers Neck Rd<br />
30°43'0"N<br />
Haddock Rd<br />
Unnamed Street<br />
98 98<br />
Vanzant Rd<br />
NASSAU COUNTY<br />
D<br />
7.07 ft<br />
Little Saint Marys River<br />
D<br />
4.47 ft<br />
Haddock Dr<br />
97 97<br />
30°42'0"N<br />
30°42'0"N<br />
W <strong>County</strong> Road 108<br />
96 96<br />
Middle Rd<br />
33 95 000m. N<br />
Unnamed Street<br />
4 20 000m. E<br />
81°50'0"W<br />
US National Grid<br />
100,000-m Square ID<br />
MP<br />
Grid Zone Designation<br />
17R<br />
Datum = NAD 1983, 1,000-m USNG<br />
Mag. Declination<br />
5 o 41' 24"W<br />
Changing by<br />
4' W per yr<br />
Date 2009<br />
This map is for reference & planning purposes only.<br />
Hurricane evacuation decision-making and growth<br />
management implementation are local responsibilities.<br />
Please consult with local authorities.<br />
#<br />
Diagram<br />
Not to Scale<br />
GN<br />
^<br />
21<br />
Notes:<br />
1. Surge limits are based on<br />
still water storm tide height<br />
elevation above NAVD88<br />
at high tide with no wave<br />
setup.<br />
2. Total Storm Tide limits were<br />
derived from Maximum of<br />
Maximums surge heights<br />
over LIDAR based digital<br />
elevation.<br />
3. The Points of Reference are<br />
locations determined to be<br />
relevant to emergency managment<br />
officials.<br />
81°49'0"W<br />
22<br />
ATLAS LEGEND<br />
®v HOSPITAL<br />
%2 Points of Reference<br />
Evacuation Route<br />
City Limits<br />
NHD Lakes<br />
NHD Major Water<br />
Cat<br />
1<br />
2<br />
3<br />
4<br />
5<br />
23<br />
81°48'0"W<br />
Storm Tide Zones<br />
<strong>Nassau</strong> <strong>County</strong>, 2010<br />
Scale - 1:24,000<br />
Feet<br />
0 2,000<br />
USNG Page 17R MP 20 95<br />
Map Plate 89<br />
95<br />
24<br />
116 117<br />
109 110 111 112 113 114 115<br />
99 100 101 105 106 107 102 103 104 108<br />
83 84 85 86 87 88 89 90 91 92 93 94 95 96 97 98<br />
67 68 69 70 71 72 73 74 75 76 77 78 79 80 81 82<br />
52 53 54 55 56 57 58 59 60 61 62 63 64 65 66<br />
37 38 39 40 41 42 43 44 45 46 47 48 49 50 51<br />
24 25 26 27 28 29 30 31<br />
32 33 34 35 36<br />
18 19 20 21 22 23<br />
12 13 14 15 16 17<br />
7 8 9 10 11<br />
4 5 6<br />
1 2 3<br />
Produced by <strong>Northeast</strong> <strong>Florida</strong> <strong>Regional</strong> <strong>Council</strong> for <strong>Florida</strong> Division of Emergency Management, 2009-2010<br />
Page 68<br />
Printed Pages in Yellow
24<br />
25<br />
81°47'0"W<br />
26<br />
81°46'0"W<br />
27<br />
28<br />
81°45'0"W<br />
34 00 34 00<br />
Timmons Rd<br />
Miltons Rd<br />
Coopers Neck Rd<br />
99 99<br />
D<br />
8.69 ft<br />
30°43'0"N<br />
Coopers Neck Rd<br />
30°43'0"N<br />
Timmons Rd<br />
98 98<br />
NASSAU COUNTY<br />
Little Saint Marys River<br />
Lessie Rd<br />
6.6 ft<br />
D<br />
97 97<br />
30°42'0"N<br />
W <strong>County</strong> Road 108<br />
30°42'0"N<br />
96 96<br />
Sand Hill Rd<br />
33 95 000m. N<br />
Middle Rd<br />
4 24 000m. E<br />
US National Grid<br />
100,000-m Square ID<br />
MP<br />
Grid Zone Designation<br />
17R<br />
Datum = NAD 1983, 1,000-m USNG<br />
Mag. Declination<br />
5 o 41' 24"W<br />
Changing by<br />
4' W per yr<br />
Date 2009<br />
This map is for reference & planning purposes only.<br />
Hurricane evacuation decision-making and growth<br />
management implementation are local responsibilities.<br />
Please consult with local authorities.<br />
#<br />
Diagram<br />
Not to Scale<br />
GN<br />
81°47'0"W<br />
^<br />
25<br />
Notes:<br />
1. Surge limits are based on<br />
still water storm tide height<br />
elevation above NAVD88<br />
at high tide with no wave<br />
setup.<br />
2. Total Storm Tide limits were<br />
derived from Maximum of<br />
Maximums surge heights<br />
over LIDAR based digital<br />
elevation.<br />
3. The Points of Reference are<br />
locations determined to be<br />
relevant to emergency managment<br />
officials.<br />
26<br />
ATLAS LEGEND<br />
®v HOSPITAL<br />
%2 Points of Reference<br />
Evacuation Route<br />
City Limits<br />
NHD Lakes<br />
NHD Major Water<br />
81°46'0"W<br />
Cat<br />
1<br />
2<br />
3<br />
4<br />
5<br />
27<br />
Storm Tide Zones<br />
<strong>Nassau</strong> <strong>County</strong>, 2010<br />
Scale - 1:24,000<br />
Feet<br />
0 2,000<br />
USNG Page 17R MP 24 95<br />
Map Plate 90<br />
28<br />
81°45'0"W<br />
116 117<br />
109 110 111 112 113 114 115<br />
99 100 101 105 106 107 102 103 104 108<br />
83 84 85 86 87 88 89 90 91 92 93 94 95 96 97 98<br />
67 68 69 70 71 72 73 74 75 76 77 78 79 80 81 82<br />
52 53 54 55 56 57 58 59 60 61 62 63 64 65 66<br />
37 38 39 40 41 42 43 44 45 46 47 48 49 50 51<br />
24 25 26 27 28 29 30 31<br />
32 33 34 35 36<br />
18 19 20 21 22 23<br />
12 13 14 15 16 17<br />
7 8 9 10 11<br />
4 5 6<br />
1 2 3<br />
95<br />
Produced by <strong>Northeast</strong> <strong>Florida</strong> <strong>Regional</strong> <strong>Council</strong> for <strong>Florida</strong> Division of Emergency Management, 2009-2010<br />
Page 69<br />
Printed Pages in Yellow
28<br />
81°45'0"W<br />
29<br />
81°44'0"W<br />
430<br />
31<br />
81°43'0"W<br />
32<br />
34 00 34 00<br />
White Oak Rd<br />
99 99<br />
Owens Rd<br />
30°43'0"N<br />
Little Saint Marys River<br />
Wingate Landing Rd<br />
Unnamed Street<br />
30°43'0"N<br />
98 98<br />
NASSAU COUNTY<br />
97 97<br />
30°42'0"N<br />
Marzella Jones Rd<br />
<strong>County</strong> Hwy 108<br />
30°42'0"N<br />
J acobs Rd<br />
96 96<br />
Sand Hill Rd<br />
W hite Rd<br />
Elnora Ln<br />
Unnamed Street<br />
33 95 000m. N<br />
4 28 000m. E<br />
81°45'0"W<br />
US National Grid<br />
100,000-m Square ID<br />
MP<br />
Grid Zone Designation<br />
17R<br />
Datum = NAD 1983, 1,000-m USNG<br />
Mag. Declination<br />
5 o 41' 24"W<br />
Changing by<br />
4' W per yr<br />
Date 2009<br />
This map is for reference & planning purposes only.<br />
Hurricane evacuation decision-making and growth<br />
management implementation are local responsibilities.<br />
Please consult with local authorities.<br />
#<br />
Diagram<br />
Not to Scale<br />
GN<br />
^<br />
29<br />
Notes:<br />
1. Surge limits are based on<br />
still water storm tide height<br />
elevation above NAVD88<br />
at high tide with no wave<br />
setup.<br />
2. Total Storm Tide limits were<br />
derived from Maximum of<br />
Maximums surge heights<br />
over LIDAR based digital<br />
elevation.<br />
3. The Points of Reference are<br />
locations determined to be<br />
relevant to emergency managment<br />
officials.<br />
81°44'0"W<br />
4 30<br />
ATLAS LEGEND<br />
®v HOSPITAL<br />
%2 Points of Reference<br />
Evacuation Route<br />
City Limits<br />
NHD Lakes<br />
NHD Major Water<br />
Cat<br />
1<br />
2<br />
3<br />
4<br />
5<br />
31<br />
81°43'0"W<br />
Storm Tide Zones<br />
<strong>Nassau</strong> <strong>County</strong>, 2010<br />
Scale - 1:24,000<br />
Feet<br />
0 2,000<br />
USNG Page 17R MP 28 95<br />
Map Plate 91<br />
95<br />
32<br />
116 117<br />
109 110 111 112 113 114 115<br />
99 100 101 105 106 107 102 103 104 108<br />
83 84 85 86 87 88 89 90 91 92 93 94 95 96 97 98<br />
67 68 69 70 71 72 73 74 75 76 77 78 79 80 81 82<br />
52 53 54 55 56 57 58 59 60 61 62 63 64 65 66<br />
37 38 39 40 41 42 43 44 45 46 47 48 49 50 51<br />
24 25 26 27 28 29 30 31<br />
32 33 34 35 36<br />
18 19 20 21 22 23<br />
12 13 14 15 16 17<br />
7 8 9 10 11<br />
4 5 6<br />
1 2 3<br />
Produced by <strong>Northeast</strong> <strong>Florida</strong> <strong>Regional</strong> <strong>Council</strong> for <strong>Florida</strong> Division of Emergency Management, 2009-2010<br />
Page 70<br />
Printed Pages in Yellow
32<br />
33<br />
81°42'0"W<br />
34<br />
81°41'0"W<br />
35<br />
36<br />
81°40'0"W<br />
Unnamed Street<br />
34 00 34 00<br />
White Oak Rd<br />
Log Rd-Closed<br />
Lippizan Ct<br />
Unnamed Street<br />
Owens Rd<br />
US Hwy 17<br />
99 99<br />
30°43'0"N<br />
§¨¦ 95<br />
30°43'0"N<br />
£¤ 17 £¤ 17<br />
98 98<br />
NASSAU COUNTY<br />
I 95<br />
97 97<br />
Dawson Rd<br />
D<br />
22.29 ft<br />
30°42'0"N<br />
30°42'0"N<br />
96 96<br />
21.06 ft<br />
D<br />
<strong>County</strong> Hwy 108<br />
Unnamed Street<br />
§¨¦ 95<br />
33 95 000m. N<br />
4 32 000m. E<br />
US National Grid<br />
100,000-m Square ID<br />
MP<br />
Grid Zone Designation<br />
17R<br />
Datum = NAD 1983, 1,000-m USNG<br />
Mag. Declination<br />
5 o 41' 24"W<br />
Changing by<br />
4' W per yr<br />
Date 2009<br />
This map is for reference & planning purposes only.<br />
Hurricane evacuation decision-making and growth<br />
management implementation are local responsibilities.<br />
Please consult with local authorities.<br />
#<br />
Diagram<br />
Not to Scale<br />
GN<br />
81°42'0"W<br />
^<br />
33<br />
Notes:<br />
1. Surge limits are based on<br />
still water storm tide height<br />
elevation above NAVD88<br />
at high tide with no wave<br />
setup.<br />
2. Total Storm Tide limits were<br />
derived from Maximum of<br />
Maximums surge heights<br />
over LIDAR based digital<br />
elevation.<br />
3. The Points of Reference are<br />
locations determined to be<br />
relevant to emergency managment<br />
officials.<br />
34<br />
ATLAS LEGEND<br />
®v HOSPITAL<br />
%2 Points of Reference<br />
Evacuation Route<br />
City Limits<br />
NHD Lakes<br />
NHD Major Water<br />
81°41'0"W<br />
Cat<br />
1<br />
2<br />
3<br />
4<br />
5<br />
35<br />
Storm Tide Zones<br />
<strong>Nassau</strong> <strong>County</strong>, 2010<br />
Scale - 1:24,000<br />
Feet<br />
0 2,000<br />
USNG Page 17R MP 32 95<br />
Map Plate 92<br />
I 95<br />
36<br />
81°40'0"W<br />
116 117<br />
109 110 111 112 113 114 115<br />
99 100 101 105 106 107 102 103 104 108<br />
83 84 85 86 87 88 89 90 91 92 93 94 95 96 97 98<br />
67 68 69 70 71 72 73 74 75 76 77 78 79 80 81 82<br />
52 53 54 55 56 57 58 59 60 61 62 63 64 65 66<br />
37 38 39 40 41 42 43 44 45 46 47 48 49 50 51<br />
24 25 26 27 28 29 30 31<br />
32 33 34 35 36<br />
18 19 20 21 22 23<br />
12 13 14 15 16 17<br />
7 8 9 10 11<br />
4 5 6<br />
1 2 3<br />
95<br />
Produced by <strong>Northeast</strong> <strong>Florida</strong> <strong>Regional</strong> <strong>Council</strong> for <strong>Florida</strong> Division of Emergency Management, 2009-2010<br />
Page 71<br />
Printed Pages in Yellow
36<br />
81°40'0"W<br />
37<br />
81°39'0"W<br />
38<br />
39<br />
81°38'0"W<br />
440<br />
34 00 34 00<br />
Camden <strong>County</strong>, Ga<br />
Camden <strong>County</strong>, Ga<br />
Lower S<br />
ister Creek<br />
I 95<br />
Log R d-Closed<br />
99 99<br />
Upper Sister Creek<br />
§¨¦ 95<br />
30°43'0"N<br />
I 95<br />
D<br />
3.1 ft<br />
30°43'0"N<br />
98 98<br />
£¤ 17 NASSAU COUNTY<br />
97 97<br />
Daw son Rd<br />
30°42'0"N<br />
Crandall Rd<br />
30°42'0"N<br />
Lower Sister Creek<br />
96 96<br />
US Hwy 17<br />
Unnamed Street<br />
Dawson Rd<br />
<strong>County</strong> Hwy 108<br />
33 95 000m. N<br />
4 36 000m. E<br />
81°40'0"W<br />
US National Grid<br />
100,000-m Square ID<br />
MP<br />
Grid Zone Designation<br />
17R<br />
Datum = NAD 1983, 1,000-m USNG<br />
Mag. Declination<br />
5 o 41' 24"W<br />
Changing by<br />
4' W per yr<br />
Date 2009<br />
This map is for reference & planning purposes only.<br />
Hurricane evacuation decision-making and growth<br />
management implementation are local responsibilities.<br />
Please consult with local authorities.<br />
#<br />
Diagram<br />
Not to Scale<br />
GN<br />
^<br />
37<br />
Notes:<br />
1. Surge limits are based on<br />
still water storm tide height<br />
elevation above NAVD88<br />
at high tide with no wave<br />
setup.<br />
2. Total Storm Tide limits were<br />
derived from Maximum of<br />
Maximums surge heights<br />
over LIDAR based digital<br />
elevation.<br />
3. The Points of Reference are<br />
locations determined to be<br />
relevant to emergency managment<br />
officials.<br />
81°39'0"W<br />
38<br />
ATLAS LEGEND<br />
®v HOSPITAL<br />
%2 Points of Reference<br />
Evacuation Route<br />
City Limits<br />
NHD Lakes<br />
NHD Major Water<br />
Cat<br />
1<br />
2<br />
3<br />
4<br />
5<br />
39<br />
81°38'0"W<br />
Storm Tide Zones<br />
<strong>Nassau</strong> <strong>County</strong>, 2010<br />
Scale - 1:24,000<br />
Feet<br />
0 2,000<br />
USNG Page 17R MP 36 95<br />
Map Plate 93<br />
95<br />
4 40<br />
116 117<br />
109 110 111 112 113 114 115<br />
99 100 101 105 106 107 102 103 104 108<br />
83 84 85 86 87 88 89 90 91 92 93 94 95 96 97 98<br />
67 68 69 70 71 72 73 74 75 76 77 78 79 80 81 82<br />
52 53 54 55 56 57 58 59 60 61 62 63 64 65 66<br />
37 38 39 40 41 42 43 44 45 46 47 48 49 50 51<br />
24 25 26 27 28 29 30 31<br />
32 33 34 35 36<br />
18 19 20 21 22 23<br />
12 13 14 15 16 17<br />
7 8 9 10 11<br />
4 5 6<br />
1 2 3<br />
Produced by <strong>Northeast</strong> <strong>Florida</strong> <strong>Regional</strong> <strong>Council</strong> for <strong>Florida</strong> Division of Emergency Management, 2009-2010<br />
Page 72<br />
Printed Pages in Yellow
440<br />
41<br />
81°37'0"W<br />
42<br />
81°36'0"W<br />
43<br />
44<br />
81°35'0"W<br />
Camden <strong>County</strong>, Ga<br />
34 00 34 00<br />
3<br />
%2<br />
99 99<br />
D<br />
2.59 ft<br />
30°43'0"N<br />
30°43'0"N<br />
98 98<br />
Crandall Rd<br />
NASSAU COUNTY<br />
97 97<br />
30°42'0"N<br />
30°42'0"N<br />
96 96<br />
Lower Sister Creek<br />
33 95 000m. N<br />
4 40 000m. E<br />
US National Grid<br />
100,000-m Square ID<br />
MP<br />
Grid Zone Designation<br />
17R<br />
Datum = NAD 1983, 1,000-m USNG<br />
Mag. Declination<br />
5 o 41' 24"W<br />
Changing by<br />
4' W per yr<br />
Date 2009<br />
This map is for reference & planning purposes only.<br />
Hurricane evacuation decision-making and growth<br />
management implementation are local responsibilities.<br />
Please consult with local authorities.<br />
#<br />
Diagram<br />
Not to Scale<br />
GN<br />
81°37'0"W<br />
^<br />
41<br />
Notes:<br />
1. Surge limits are based on<br />
still water storm tide height<br />
elevation above NAVD88<br />
at high tide with no wave<br />
setup.<br />
2. Total Storm Tide limits were<br />
derived from Maximum of<br />
Maximums surge heights<br />
over LIDAR based digital<br />
elevation.<br />
3. The Points of Reference are<br />
locations determined to be<br />
relevant to emergency managment<br />
officials.<br />
42<br />
ATLAS LEGEND<br />
®v HOSPITAL<br />
%2 Points of Reference<br />
Evacuation Route<br />
City Limits<br />
NHD Lakes<br />
NHD Major Water<br />
81°36'0"W<br />
Cat<br />
1<br />
2<br />
3<br />
4<br />
5<br />
43<br />
Storm Tide Zones<br />
<strong>Nassau</strong> <strong>County</strong>, 2010<br />
Scale - 1:24,000<br />
Feet<br />
0 2,000<br />
USNG Page 17R MP 40 95<br />
Map Plate 94<br />
44<br />
81°35'0"W<br />
116 117<br />
109 110 111 112 113 114 115<br />
99 100 101 105 106 107 102 103 104 108<br />
83 84 85 86 87 88 89 90 91 92 93 94 95 96 97 98<br />
67 68 69 70 71 72 73 74 75 76 77 78 79 80 81 82<br />
52 53 54 55 56 57 58 59 60 61 62 63 64 65 66<br />
37 38 39 40 41 42 43 44 45 46 47 48 49 50 51<br />
24 25 26 27 28 29 30 31<br />
32 33 34 35 36<br />
18 19 20 21 22 23<br />
12 13 14 15 16 17<br />
7 8 9 10 11<br />
4 5 6<br />
1 2 3<br />
95<br />
Produced by <strong>Northeast</strong> <strong>Florida</strong> <strong>Regional</strong> <strong>Council</strong> for <strong>Florida</strong> Division of Emergency Management, 2009-2010<br />
Page 73<br />
Printed Pages in Yellow
Daniels Ln<br />
44<br />
81°35'0"W<br />
45<br />
81°34'0"W<br />
46<br />
47<br />
81°33'0"W<br />
48<br />
34 00 34 00<br />
Camden <strong>County</strong>, Ga<br />
99 99<br />
30°43'0"N<br />
30°43'0"N<br />
98 98<br />
97 97<br />
30°42'0"N<br />
NASSAU COUNTY<br />
30°42'0"N<br />
96 96<br />
Roses Bluff Rd<br />
2<br />
%2<br />
33 95 000m. N<br />
4 44 000m. E<br />
81°35'0"W<br />
US National Grid<br />
100,000-m Square ID<br />
MP<br />
Grid Zone Designation<br />
17R<br />
Datum = NAD 1983, 1,000-m USNG<br />
Mag. Declination<br />
5 o 41' 24"W<br />
Changing by<br />
4' W per yr<br />
Date 2009<br />
This map is for reference & planning purposes only.<br />
Hurricane evacuation decision-making and growth<br />
management implementation are local responsibilities.<br />
Please consult with local authorities.<br />
#<br />
Diagram<br />
Not to Scale<br />
GN<br />
^<br />
45<br />
Notes:<br />
1. Surge limits are based on<br />
still water storm tide height<br />
elevation above NAVD88<br />
at high tide with no wave<br />
setup.<br />
2. Total Storm Tide limits were<br />
derived from Maximum of<br />
Maximums surge heights<br />
over LIDAR based digital<br />
elevation.<br />
3. The Points of Reference are<br />
locations determined to be<br />
relevant to emergency managment<br />
officials.<br />
81°34'0"W<br />
Bell River Rd<br />
46<br />
ATLAS LEGEND<br />
®v HOSPITAL<br />
%2 Points of Reference<br />
Evacuation Route<br />
City Limits<br />
NHD Lakes<br />
NHD Major Water<br />
Cat<br />
1<br />
2<br />
3<br />
4<br />
5<br />
47<br />
81°33'0"W<br />
Fen Av e<br />
Storm Tide Zones<br />
<strong>Nassau</strong> <strong>County</strong>, 2010<br />
Scale - 1:24,000<br />
Feet<br />
0 2,000<br />
USNG Page 17R MP 44 95<br />
Map Plate 95<br />
95<br />
48<br />
116 117<br />
109 110 111 112 113 114 115<br />
99 100 101 105 106 107 102 103 104 108<br />
83 84 85 86 87 88 89 90 91 92 93 94 95 96 97 98<br />
67 68 69 70 71 72 73 74 75 76 77 78 79 80 81 82<br />
52 53 54 55 56 57 58 59 60 61 62 63 64 65 66<br />
37 38 39 40 41 42 43 44 45 46 47 48 49 50 51<br />
24 25 26 27 28 29 30 31<br />
32 33 34 35 36<br />
18 19 20 21 22 23<br />
12 13 14 15 16 17<br />
7 8 9 10 11<br />
4 5 6<br />
1 2 3<br />
Produced by <strong>Northeast</strong> <strong>Florida</strong> <strong>Regional</strong> <strong>Council</strong> for <strong>Florida</strong> Division of Emergency Management, 2009-2010<br />
Page 74<br />
Printed Pages in Yellow
48<br />
49<br />
81°32'0"W<br />
450<br />
81°31'0"W<br />
51<br />
52<br />
81°30'0"W<br />
34 00 34 00<br />
Camden <strong>County</strong>, Ga<br />
99 99<br />
30°43'0"N<br />
30°43'0"N<br />
98 98<br />
97 97<br />
NASSAU COUNTY<br />
30°42'0"N<br />
30°42'0"N<br />
96 96<br />
2<br />
%2<br />
Daniels Ln<br />
33 95 000m. N<br />
4 48 000m. E<br />
Bellville Ln<br />
US National Grid<br />
100,000-m Square ID<br />
MP<br />
Grid Zone Designation<br />
17R<br />
Datum = NAD 1983, 1,000-m USNG<br />
Mag. Declination<br />
5 o 41' 24"W<br />
Changing by<br />
4' W per yr<br />
Date 2009<br />
This map is for reference & planning purposes only.<br />
Hurricane evacuation decision-making and growth<br />
management implementation are local responsibilities.<br />
Please consult with local authorities.<br />
#<br />
Diagram<br />
Not to Scale<br />
GN<br />
81°32'0"W<br />
^<br />
49<br />
Notes:<br />
1. Surge limits are based on<br />
still water storm tide height<br />
elevation above NAVD88<br />
at high tide with no wave<br />
setup.<br />
2. Total Storm Tide limits were<br />
derived from Maximum of<br />
Maximums surge heights<br />
over LIDAR based digital<br />
elevation.<br />
3. The Points of Reference are<br />
locations determined to be<br />
relevant to emergency managment<br />
officials.<br />
4 50<br />
ATLAS LEGEND<br />
®v HOSPITAL<br />
%2 Points of Reference<br />
Evacuation Route<br />
City Limits<br />
NHD Lakes<br />
NHD Major Water<br />
81°31'0"W<br />
Cat<br />
1<br />
2<br />
3<br />
4<br />
5<br />
51<br />
Storm Tide Zones<br />
<strong>Nassau</strong> <strong>County</strong>, 2010<br />
Scale - 1:24,000<br />
Feet<br />
0 2,000<br />
USNG Page 17R MP 48 95<br />
Map Plate 96<br />
52<br />
81°30'0"W<br />
116 117<br />
109 110 111 112 113 114 115<br />
99 100 101 105 106 107 102 103 104 108<br />
83 84 85 86 87 88 89 90 91 92 93 94 95 96 97 98<br />
67 68 69 70 71 72 73 74 75 76 77 78 79 80 81 82<br />
52 53 54 55 56 57 58 59 60 61 62 63 64 65 66<br />
37 38 39 40 41 42 43 44 45 46 47 48 49 50 51<br />
24 25 26 27 28 29 30 31<br />
32 33 34 35 36<br />
18 19 20 21 22 23<br />
12 13 14 15 16 17<br />
7 8 9 10 11<br />
4 5 6<br />
1 2 3<br />
95<br />
Produced by <strong>Northeast</strong> <strong>Florida</strong> <strong>Regional</strong> <strong>Council</strong> for <strong>Florida</strong> Division of Emergency Management, 2009-2010<br />
Page 75<br />
Printed Pages in Yellow
52<br />
81°30'0"W<br />
53<br />
81°29'0"W<br />
54<br />
55<br />
34 00 34 00<br />
81°28'0"W<br />
56<br />
30°44'0"N<br />
Camden <strong>County</strong>, Ga<br />
99 99<br />
30°43'0"N<br />
30°43'0"N<br />
98 98<br />
97 97<br />
30°42'0"N<br />
NASSAU COUNTY<br />
Fort Clinch S<br />
tate Park<br />
30°42'0"N<br />
96 96<br />
Pogy Pl<br />
Egans Creek<br />
7<br />
%2<br />
Marine St<br />
33 95 000m. N<br />
81°30'0"W<br />
4 52 000m. E<br />
US National Grid<br />
100,000-m Square ID<br />
MP<br />
Grid Zone Designation<br />
17R<br />
Datum = NAD 1983, 1,000-m USNG<br />
Mag. Declination<br />
5 o 41' 24"W<br />
Changing by<br />
4' W per yr<br />
Date 2009<br />
This map is for reference & planning purposes only.<br />
Hurricane evacuation decision-making and growth<br />
management implementation are local responsibilities.<br />
Please consult with local authorities.<br />
#<br />
Diagram<br />
Not to Scale<br />
GN<br />
^<br />
53<br />
Notes:<br />
1. Surge limits are based on<br />
still water storm tide height<br />
elevation above NAVD88<br />
at high tide with no wave<br />
setup.<br />
2. Total Storm Tide limits were<br />
derived from Maximum of<br />
Maximums surge heights<br />
over LIDAR based digital<br />
elevation.<br />
3. The Points of Reference are<br />
locations determined to be<br />
relevant to emergency managment<br />
officials.<br />
81°29'0"W<br />
54<br />
ATLAS LEGEND<br />
®v HOSPITAL<br />
%2 Points of Reference<br />
Evacuation Route<br />
City Limits<br />
NHD Lakes<br />
NHD Major Water<br />
Saint Joseph Creek<br />
Cat<br />
1<br />
2<br />
3<br />
4<br />
5<br />
55<br />
81°28'0"W<br />
Storm Tide Zones<br />
<strong>Nassau</strong> <strong>County</strong>, 2010<br />
Scale - 1:24,000<br />
Feet<br />
0 2,000<br />
USNG Page 17R MP 52 95<br />
Map Plate 97<br />
95<br />
56<br />
116 117<br />
109 110 111 112 113 114 115<br />
99 100 101 105 106 107 102 103 104 108<br />
83 84 85 86 87 88 89 90 91 92 93 94 95 96 97 98<br />
67 68 69 70 71 72 73 74 75 76 77 78 79 80 81 82<br />
52 53 54 55 56 57 58 59 60 61 62 63 64 65 66<br />
37 38 39 40 41 42 43 44 45 46 47 48 49 50 51<br />
24 25 26 27 28 29 30 31<br />
32 33 34 35 36<br />
18 19 20 21 22 23<br />
12 13 14 15 16 17<br />
7 8 9 10 11<br />
4 5 6<br />
1 2 3<br />
Produced by <strong>Northeast</strong> <strong>Florida</strong> <strong>Regional</strong> <strong>Council</strong> for <strong>Florida</strong> Division of Emergency Management, 2009-2010<br />
Page 76<br />
Printed Pages in Yellow
30°44'0"N<br />
56<br />
57<br />
81°27'0"W<br />
58<br />
34 00 34 00<br />
81°26'0"W<br />
59<br />
460<br />
81°25'0"W<br />
30°44'0"N<br />
99 99<br />
Camden <strong>County</strong>, Ga<br />
30°43'0"N<br />
30°43'0"N<br />
98 98<br />
5<br />
%2<br />
97 97<br />
Fort Clinch State Park<br />
Fort Clinch State Park<br />
Fort Clinch State Park<br />
Fort G<br />
30°42'0"N<br />
linch<br />
30°42'0"N<br />
Pogy Pl<br />
NASSAU COUNTY<br />
96 96<br />
N 14th St<br />
Fort Clinch State Park<br />
%2<br />
6<br />
%2<br />
7<br />
Marine St<br />
Ladies St<br />
Amelia St<br />
White St<br />
Kimberly St<br />
33 95 000m. N<br />
4 56 000m. E<br />
US National Grid<br />
100,000-m Square ID<br />
MP<br />
Grid Zone Designation<br />
17R<br />
Datum = NAD 1983, 1,000-m USNG<br />
Magnolia St<br />
Mag. Declination<br />
5 o 41' 24"W<br />
Changing by<br />
4' W per yr<br />
Date 2009<br />
This map is for reference & planning purposes only.<br />
Hurricane evacuation decision-making and growth<br />
management implementation are local responsibilities.<br />
Please consult with local authorities.<br />
#<br />
<strong>Nassau</strong> St<br />
Diagram<br />
Not to Scale<br />
81°27'0"W<br />
GN<br />
^<br />
57<br />
Egans Creek<br />
Highland Dr<br />
Notes:<br />
1. Surge limits are based on<br />
still water storm tide height<br />
elevation above NAVD88<br />
at high tide with no wave<br />
setup.<br />
2. Total Storm Tide limits were<br />
derived from Maximum of<br />
Maximums surge heights<br />
over LIDAR based digital<br />
elevation.<br />
3. The Points of Reference are<br />
locations determined to be<br />
relevant to emergency managment<br />
officials.<br />
58<br />
ATLAS LEGEND<br />
®v HOSPITAL<br />
%2 Points of Reference<br />
Evacuation Route<br />
City Limits<br />
NHD Lakes<br />
NHD Major Water<br />
81°26'0"W<br />
Cat<br />
1<br />
2<br />
3<br />
4<br />
5<br />
Lisa Ave<br />
59<br />
Storm Tide Zones<br />
<strong>Nassau</strong> <strong>County</strong>, 2010<br />
Scale - 1:24,000<br />
Feet<br />
0 2,000<br />
USNG Page 17R MP 56 95<br />
Map Plate 98<br />
4 60<br />
81°25'0"W<br />
116 117<br />
109 110 111 112 113 114 115<br />
99 100 101 105 106 107 102 103 104 108<br />
83 84 85 86 87 88 89 90 91 92 93 94 95 96 97 98<br />
67 68 69 70 71 72 73 74 75 76 77 78 79 80 81 82<br />
52 53 54 55 56 57 58 59 60 61 62 63 64 65 66<br />
37 38 39 40 41 42 43 44 45 46 47 48 49 50 51<br />
24 25 26 27 28 29 30 31<br />
32 33 34 35 36<br />
18 19 20 21 22 23<br />
12 13 14 15 16 17<br />
7 8 9 10 11<br />
4 5 6<br />
1 2 3<br />
95<br />
Produced by <strong>Northeast</strong> <strong>Florida</strong> <strong>Regional</strong> <strong>Council</strong> for <strong>Florida</strong> Division of Emergency Management, 2009-2010<br />
Page 77<br />
Printed Pages in Yellow
24<br />
25<br />
81°47'0"W<br />
26<br />
81°46'0"W<br />
27<br />
28<br />
81°45'0"W<br />
Camden <strong>County</strong>, Ga<br />
05 05<br />
Camden <strong>County</strong>, Ga<br />
30°46'0"N<br />
04 04<br />
30°46'0"N<br />
Cossiers Creek<br />
D<br />
2.16 ft<br />
03 03<br />
D<br />
18.11 ft<br />
Circle Rd<br />
Sandy Bluff Rd<br />
White Oak Rd<br />
30°45'0"N<br />
Lessie Rd<br />
Gilman Brickyard Rd<br />
NASSAU COUNTY<br />
02 02<br />
30°45'0"N<br />
01 01<br />
D<br />
7.52 ft<br />
30°44'0"N<br />
34 00 000m. N<br />
30°44'0"N<br />
4 24 000m. E<br />
US National Grid<br />
100,000-m Square ID<br />
MQ<br />
Grid Zone Designation<br />
17R<br />
Datum = NAD 1983, 1,000-m USNG<br />
Mag. Declination<br />
5 o 41' 24"W<br />
Changing by<br />
4' W per yr<br />
Date 2009<br />
This map is for reference & planning purposes only.<br />
Hurricane evacuation decision-making and growth<br />
management implementation are local responsibilities.<br />
Please consult with local authorities.<br />
#<br />
Diagram<br />
Not to Scale<br />
GN<br />
^<br />
81°47'0"W<br />
25<br />
Notes:<br />
1. Surge limits are based on<br />
still water storm tide height<br />
elevation above NAVD88<br />
at high tide with no wave<br />
setup.<br />
2. Total Storm Tide limits were<br />
derived from Maximum of<br />
Maximums surge heights<br />
over LIDAR based digital<br />
elevation.<br />
3. The Points of Reference are<br />
locations determined to be<br />
relevant to emergency managment<br />
officials.<br />
26<br />
ATLAS LEGEND<br />
®v HOSPITAL<br />
%2 Points of Reference<br />
Evacuation Route<br />
City Limits<br />
NHD Lakes<br />
NHD Major Water<br />
81°46'0"W<br />
Cat<br />
1<br />
2<br />
3<br />
4<br />
5<br />
27<br />
Storm Tide Zones<br />
<strong>Nassau</strong> <strong>County</strong>, 2010<br />
Scale - 1:24,000<br />
Feet<br />
0 2,000<br />
USNG Page 17R MQ 24 00<br />
Map Plate 102<br />
28<br />
34 00<br />
81°45'0"W<br />
116 117<br />
109 110 111 112 113 114 115<br />
99 100 101 105 106 107 102 103 104 108<br />
83 84 85 86 87 88 89 90 91 92 93 94 95 96 97 98<br />
67 68 69 70 71 72 73 74 75 76 77 78 79 80 81 82<br />
52 53 54 55 56 57 58 59 60 61 62 63 64 65 66<br />
37 38 39 40 41 42 43 44 45 46 47 48 49 50 51<br />
24 25 26 27 28 29 30 31<br />
32 33 34 35 36<br />
18 19 20 21 22 23<br />
12 13 14 15 16 17<br />
7 8 9 10 11<br />
4 5 6<br />
1 2 3<br />
Produced by <strong>Northeast</strong> <strong>Florida</strong> <strong>Regional</strong> <strong>Council</strong> for <strong>Florida</strong> Division of Emergency Management, 2009-2010<br />
Page 78<br />
Printed Pages in Yellow
28<br />
81°45'0"W<br />
29<br />
81°44'0"W<br />
430<br />
31<br />
81°43'0"W<br />
32<br />
05 05<br />
30°46'0"N<br />
04 04<br />
30°46'0"N<br />
Camden <strong>County</strong>, Ga<br />
D<br />
2.22 ft<br />
03 03<br />
White Oak Rd<br />
1<br />
%2<br />
30°45'0"N<br />
02 02<br />
30°45'0"N<br />
NASSAU COUNTY<br />
%2<br />
4<br />
D<br />
9.63 ft<br />
01 01<br />
D<br />
1.11 ft<br />
Little Saint Marys River<br />
34 00 000m. N<br />
30°44'0"N<br />
30°44'0"N<br />
4 28 000m. E<br />
81°45'0"W<br />
US National Grid<br />
100,000-m Square ID<br />
MQ<br />
Grid Zone Designation<br />
17R<br />
Datum = NAD 1983, 1,000-m USNG<br />
Mag. Declination<br />
5 o 41' 24"W<br />
Changing by<br />
4' W per yr<br />
Date 2009<br />
This map is for reference & planning purposes only.<br />
Hurricane evacuation decision-making and growth<br />
management implementation are local responsibilities.<br />
Please consult with local authorities.<br />
#<br />
Diagram<br />
Not to Scale<br />
GN<br />
^<br />
29<br />
Notes:<br />
1. Surge limits are based on<br />
still water storm tide height<br />
elevation above NAVD88<br />
at high tide with no wave<br />
setup.<br />
2. Total Storm Tide limits were<br />
derived from Maximum of<br />
Maximums surge heights<br />
over LIDAR based digital<br />
elevation.<br />
3. The Points of Reference are<br />
locations determined to be<br />
relevant to emergency managment<br />
officials.<br />
81°44'0"W<br />
4 30<br />
ATLAS LEGEND<br />
®v HOSPITAL<br />
%2 Points of Reference<br />
Evacuation Route<br />
City Limits<br />
NHD Lakes<br />
NHD Major Water<br />
Cat<br />
1<br />
2<br />
3<br />
4<br />
5<br />
31<br />
81°43'0"W<br />
Storm Tide Zones<br />
<strong>Nassau</strong> <strong>County</strong>, 2010<br />
Scale - 1:24,000<br />
Feet<br />
0 2,000<br />
USNG Page 17R MQ 28 00<br />
Map Plate 103<br />
32<br />
White Oak Rd<br />
116 117<br />
109 110 111 112 113 114 115<br />
99 100 101 105 106 107 102 103 104 108<br />
83 84 85 86 87 88 89 90 91 92 93 94 95 96 97 98<br />
67 68 69 70 71 72 73 74 75 76 77 78 79 80 81 82<br />
52 53 54 55 56 57 58 59 60 61 62 63 64 65 66<br />
37 38 39 40 41 42 43 44 45 46 47 48 49 50 51<br />
24 25 26 27 28 29 30 31<br />
32 33 34 35 36<br />
18 19 20 21 22 23<br />
12 13 14 15 16 17<br />
7 8 9 10 11<br />
4 5 6<br />
1 2 3<br />
34 00<br />
Produced by <strong>Northeast</strong> <strong>Florida</strong> <strong>Regional</strong> <strong>Council</strong> for <strong>Florida</strong> Division of Emergency Management, 2009-2010<br />
Page 79<br />
Printed Pages in Yellow
32<br />
33<br />
81°42'0"W<br />
34<br />
81°41'0"W<br />
35<br />
36<br />
81°40'0"W<br />
05 05<br />
30°46'0"N<br />
04 04<br />
30°46'0"N<br />
Camden <strong>County</strong>, Ga<br />
03 03<br />
30°45'0"N<br />
02 02<br />
30°45'0"N<br />
4<br />
%2<br />
2.2 ft<br />
01 D<br />
01<br />
US Hwy 17<br />
NASSAU COUNTY<br />
30°44'0"N<br />
White Oak Rd<br />
Owens Rd<br />
30°44'0"N<br />
Unnamed Street<br />
Lippizan Ct<br />
34 00 000m. N<br />
4 32 000m. E<br />
US National Grid<br />
100,000-m Square ID<br />
MQ<br />
Grid Zone Designation<br />
17R<br />
Datum = NAD 1983, 1,000-m USNG<br />
Mag. Declination<br />
5 o 41' 24"W<br />
Changing by<br />
4' W per yr<br />
Date 2009<br />
This map is for reference & planning purposes only.<br />
Hurricane evacuation decision-making and growth<br />
management implementation are local responsibilities.<br />
Please consult with local authorities.<br />
81°42'0"W<br />
Produced by <strong>Northeast</strong> <strong>Florida</strong> <strong>Regional</strong> <strong>Council</strong> for <strong>Florida</strong> Division of Emergency Management, 2009-2010<br />
#<br />
Diagram<br />
Not to Scale<br />
GN<br />
^<br />
33<br />
Notes:<br />
1. Surge limits are based on<br />
still water storm tide height<br />
elevation above NAVD88<br />
at high tide with no wave<br />
setup.<br />
2. Total Storm Tide limits were<br />
derived from Maximum of<br />
Maximums surge heights<br />
over LIDAR based digital<br />
elevation.<br />
3. The Points of Reference are<br />
locations determined to be<br />
relevant to emergency managment<br />
officials.<br />
34<br />
ATLAS LEGEND<br />
®v HOSPITAL<br />
%2 Points of Reference<br />
Evacuation Route<br />
City Limits<br />
NHD Lakes<br />
NHD Major Water<br />
Page 80<br />
Unnamed Street<br />
81°41'0"W<br />
Cat<br />
1<br />
2<br />
3<br />
4<br />
5<br />
35<br />
Storm Tide Zones<br />
<strong>Nassau</strong> <strong>County</strong>, 2010<br />
Scale - 1:24,000<br />
Feet<br />
0 2,000<br />
USNG Page 17R MQ 32 00<br />
Map Plate 104<br />
36<br />
34 00<br />
81°40'0"W<br />
116 117<br />
109 110 111 112 113 114 115<br />
99 100 101 105 106 107 102 103 104 108<br />
83 84 85 86 87 88 89 90 91 92 93 94 95 96 97 98<br />
67 68 69 70 71 72 73 74 75 76 77 78 79 80 81 82<br />
52 53 54 55 56 57 58 59 60 61 62 63 64 65 66<br />
37 38 39 40 41 42 43 44 45 46 47 48 49 50 51<br />
24 25 26 27 28 29 30 31<br />
32 33 34 35 36<br />
18 19 20 21 22 23<br />
12 13 14 15 16 17<br />
7 8 9 10 11<br />
4 5 6<br />
1 2 3<br />
Printed Pages in Yellow
12<br />
81°55'0"W<br />
13<br />
81°54'0"W<br />
14<br />
15<br />
81°53'0"W<br />
16<br />
05 05<br />
30°46'0"N<br />
04 04<br />
30°46'0"N<br />
D<br />
3 ft<br />
03 03<br />
Murrhee Rd<br />
Cabbage Creek<br />
NASSAU COUNTY<br />
30°45'0"N<br />
30°45'0"N<br />
02 02<br />
D<br />
3 ft<br />
01 01<br />
34 00 000m. N<br />
30°44'0"N<br />
30°44'0"N<br />
4 12 000m. E<br />
81°55'0"W<br />
US National Grid<br />
100,000-m Square ID<br />
MQ<br />
Grid Zone Designation<br />
17R<br />
Datum = NAD 1983, 1,000-m USNG<br />
Mag. Declination<br />
5 o 41' 24"W<br />
Changing by<br />
4' W per yr<br />
Date 2009<br />
This map is for reference & planning purposes only.<br />
Hurricane evacuation decision-making and growth<br />
management implementation are local responsibilities.<br />
Please consult with local authorities.<br />
#<br />
Diagram<br />
Not to Scale<br />
GN<br />
^<br />
13<br />
Notes:<br />
1. Surge limits are based on<br />
still water storm tide height<br />
elevation above NAVD88<br />
at high tide with no wave<br />
setup.<br />
2. Total Storm Tide limits were<br />
derived from Maximum of<br />
Maximums surge heights<br />
over LIDAR based digital<br />
elevation.<br />
3. The Points of Reference are<br />
locations determined to be<br />
relevant to emergency managment<br />
officials.<br />
81°54'0"W<br />
14<br />
<strong>County</strong> Hwy 115A<br />
ATLAS LEGEND<br />
®v HOSPITAL<br />
%2 Points of Reference<br />
Evacuation Route<br />
City Limits<br />
NHD Lakes<br />
NHD Major Water<br />
Little Saint Marys River<br />
Cat<br />
1<br />
2<br />
3<br />
4<br />
5<br />
15<br />
81°53'0"W<br />
Storm Tide Zones<br />
<strong>Nassau</strong> <strong>County</strong>, 2010<br />
Scale - 1:24,000<br />
Feet<br />
0 2,000<br />
USNG Page 17R MQ 12 00<br />
Map Plate 105<br />
16<br />
116 117<br />
109 110 111 112 113 114 115<br />
99 100 101 105 106 107 102 103 104 108<br />
83 84 85 86 87 88 89 90 91 92 93 94 95 96 97 98<br />
67 68 69 70 71 72 73 74 75 76 77 78 79 80 81 82<br />
52 53 54 55 56 57 58 59 60 61 62 63 64 65 66<br />
37 38 39 40 41 42 43 44 45 46 47 48 49 50 51<br />
24 25 26 27 28 29 30 31<br />
32 33 34 35 36<br />
18 19 20 21 22 23<br />
12 13 14 15 16 17<br />
7 8 9 10 11<br />
4 5 6<br />
1 2 3<br />
34 00<br />
Produced by <strong>Northeast</strong> <strong>Florida</strong> <strong>Regional</strong> <strong>Council</strong> for <strong>Florida</strong> Division of Emergency Management, 2009-2010<br />
Page 81<br />
Printed Pages in Yellow
Haddock Dr<br />
16<br />
17<br />
81°52'0"W<br />
18<br />
81°51'0"W<br />
19<br />
420<br />
81°50'0"W<br />
05 05<br />
Thompson Rd<br />
30°46'0"N<br />
04 04<br />
Whitaker Rd<br />
30°46'0"N<br />
03 03<br />
Haddock Rd<br />
Cabbage Creek<br />
NASSAU COUNTY<br />
D<br />
8.13 ft<br />
30°45'0"N<br />
Vanzant Rd<br />
30°45'0"N<br />
02 02<br />
<strong>County</strong> Hwy 115A<br />
Crawford Ln<br />
01 01<br />
30°44'0"N<br />
34 00 000m. N<br />
30°44'0"N<br />
4 16 000m. E<br />
US National Grid<br />
100,000-m Square ID<br />
MQ<br />
Grid Zone Designation<br />
17R<br />
Datum = NAD 1983, 1,000-m USNG<br />
Mag. Declination<br />
5 o 41' 24"W<br />
Changing by<br />
4' W per yr<br />
Date 2009<br />
This map is for reference & planning purposes only.<br />
Hurricane evacuation decision-making and growth<br />
management implementation are local responsibilities.<br />
Please consult with local authorities.<br />
#<br />
Diagram<br />
Not to Scale<br />
GN<br />
^<br />
81°52'0"W<br />
17<br />
Notes:<br />
1. Surge limits are based on<br />
still water storm tide height<br />
elevation above NAVD88<br />
at high tide with no wave<br />
setup.<br />
2. Total Storm Tide limits were<br />
derived from Maximum of<br />
Maximums surge heights<br />
over LIDAR based digital<br />
elevation.<br />
3. The Points of Reference are<br />
locations determined to be<br />
relevant to emergency managment<br />
officials.<br />
18<br />
ATLAS LEGEND<br />
®v HOSPITAL<br />
%2 Points of Reference<br />
Evacuation Route<br />
City Limits<br />
NHD Lakes<br />
NHD Major Water<br />
Cat<br />
1<br />
2<br />
3<br />
4<br />
5<br />
81°51'0"W<br />
19<br />
Storm Tide Zones<br />
<strong>Nassau</strong> <strong>County</strong>, 2010<br />
Scale - 1:24,000<br />
Feet<br />
0 2,000<br />
USNG Page 17R MQ 16 00<br />
Map Plate 106<br />
4 20<br />
34 00<br />
81°50'0"W<br />
116 117<br />
109 110 111 112 113 114 115<br />
99 100 101 105 106 107 102 103 104 108<br />
83 84 85 86 87 88 89 90 91 92 93 94 95 96 97 98<br />
67 68 69 70 71 72 73 74 75 76 77 78 79 80 81 82<br />
52 53 54 55 56 57 58 59 60 61 62 63 64 65 66<br />
37 38 39 40 41 42 43 44 45 46 47 48 49 50 51<br />
24 25 26 27 28 29 30 31<br />
32 33 34 35 36<br />
18 19 20 21 22 23<br />
12 13 14 15 16 17<br />
7 8 9 10 11<br />
4 5 6<br />
1 2 3<br />
Produced by <strong>Northeast</strong> <strong>Florida</strong> <strong>Regional</strong> <strong>Council</strong> for <strong>Florida</strong> Division of Emergency Management, 2009-2010<br />
Page 82<br />
Printed Pages in Yellow
Haddock Dr<br />
420<br />
81°50'0"W<br />
21<br />
81°49'0"W<br />
22<br />
23<br />
81°48'0"W<br />
24<br />
05 05<br />
30°46'0"N<br />
04 04<br />
30°46'0"N<br />
White Oak Rd<br />
03 03<br />
Sandy Bluff Rd<br />
D<br />
6.81 ft<br />
Lessie Rd<br />
30°45'0"N<br />
Haddock Rd<br />
Cabbage Creek<br />
NASSAU COUNTY<br />
30°45'0"N<br />
02 02<br />
Crawford Ln<br />
State Hwy 121A<br />
01 01<br />
34 00 000m. N<br />
30°44'0"N<br />
30°44'0"N<br />
4 20 000m. E<br />
81°50'0"W<br />
US National Grid<br />
100,000-m Square ID<br />
MQ<br />
Grid Zone Designation<br />
17R<br />
Datum = NAD 1983, 1,000-m USNG<br />
Mag. Declination<br />
5 o 41' 24"W<br />
Changing by<br />
4' W per yr<br />
Date 2009<br />
This map is for reference & planning purposes only.<br />
Hurricane evacuation decision-making and growth<br />
management implementation are local responsibilities.<br />
Please consult with local authorities.<br />
#<br />
Diagram<br />
Not to Scale<br />
GN<br />
^<br />
21<br />
Notes:<br />
1. Surge limits are based on<br />
still water storm tide height<br />
elevation above NAVD88<br />
at high tide with no wave<br />
setup.<br />
2. Total Storm Tide limits were<br />
derived from Maximum of<br />
Maximums surge heights<br />
over LIDAR based digital<br />
elevation.<br />
3. The Points of Reference are<br />
locations determined to be<br />
relevant to emergency managment<br />
officials.<br />
81°49'0"W<br />
22<br />
ATLAS LEGEND<br />
®v HOSPITAL<br />
%2 Points of Reference<br />
Evacuation Route<br />
City Limits<br />
NHD Lakes<br />
NHD Major Water<br />
Cat<br />
1<br />
2<br />
3<br />
4<br />
5<br />
23<br />
81°48'0"W<br />
Storm Tide Zones<br />
<strong>Nassau</strong> <strong>County</strong>, 2010<br />
Scale - 1:24,000<br />
Feet<br />
0 2,000<br />
USNG Page 17R MQ 20 00<br />
Map Plate 107<br />
24<br />
116 117<br />
109 110 111 112 113 114 115<br />
99 100 101 105 106 107 102 103 104 108<br />
83 84 85 86 87 88 89 90 91 92 93 94 95 96 97 98<br />
67 68 69 70 71 72 73 74 75 76 77 78 79 80 81 82<br />
52 53 54 55 56 57 58 59 60 61 62 63 64 65 66<br />
37 38 39 40 41 42 43 44 45 46 47 48 49 50 51<br />
24 25 26 27 28 29 30 31<br />
32 33 34 35 36<br />
18 19 20 21 22 23<br />
12 13 14 15 16 17<br />
7 8 9 10 11<br />
4 5 6<br />
1 2 3<br />
34 00<br />
Produced by <strong>Northeast</strong> <strong>Florida</strong> <strong>Regional</strong> <strong>Council</strong> for <strong>Florida</strong> Division of Emergency Management, 2009-2010<br />
Page 83<br />
Printed Pages in Yellow
36<br />
81°40'0"W<br />
37<br />
81°39'0"W<br />
38<br />
39<br />
81°38'0"W<br />
440<br />
05 05<br />
04 04<br />
30°46'0"N<br />
30°46'0"N<br />
03 03<br />
Camden <strong>County</strong>, Ga<br />
30°45'0"N<br />
5.92 ft<br />
D<br />
02 02<br />
30°45'0"N<br />
01 01<br />
§¨¦ 95<br />
NASSAU COUNTY<br />
30°44'0"N<br />
I 95<br />
34 00 000m. N<br />
30°44'0"N<br />
4 36 000m. E<br />
81°40'0"W<br />
US National Grid<br />
100,000-m Square ID<br />
MQ<br />
Grid Zone Designation<br />
17R<br />
Datum = NAD 1983, 1,000-m USNG<br />
I 95<br />
Mag. Declination<br />
5 o 41' 24"W<br />
Changing by<br />
4' W per yr<br />
Date 2009<br />
This map is for reference & planning purposes only.<br />
Hurricane evacuation decision-making and growth<br />
management implementation are local responsibilities.<br />
Please consult with local authorities.<br />
#<br />
Diagram<br />
Not to Scale<br />
GN<br />
^<br />
37<br />
Notes:<br />
1. Surge limits are based on<br />
still water storm tide height<br />
elevation above NAVD88<br />
at high tide with no wave<br />
setup.<br />
2. Total Storm Tide limits were<br />
derived from Maximum of<br />
Maximums surge heights<br />
over LIDAR based digital<br />
elevation.<br />
3. The Points of Reference are<br />
locations determined to be<br />
relevant to emergency managment<br />
officials.<br />
81°39'0"W<br />
38<br />
ATLAS LEGEND<br />
®v HOSPITAL<br />
%2 Points of Reference<br />
Evacuation Route<br />
City Limits<br />
NHD Lakes<br />
NHD Major Water<br />
Cat<br />
1<br />
2<br />
3<br />
4<br />
5<br />
39<br />
81°38'0"W<br />
Storm Tide Zones<br />
<strong>Nassau</strong> <strong>County</strong>, 2010<br />
Scale - 1:24,000<br />
Feet<br />
0 2,000<br />
USNG Page 17R MQ 36 00<br />
Map Plate 108<br />
4 40<br />
116 117<br />
109 110 111 112 113 114 115<br />
99 100 101 105 106 107 102 103 104 108<br />
83 84 85 86 87 88 89 90 91 92 93 94 95 96 97 98<br />
67 68 69 70 71 72 73 74 75 76 77 78 79 80 81 82<br />
52 53 54 55 56 57 58 59 60 61 62 63 64 65 66<br />
37 38 39 40 41 42 43 44 45 46 47 48 49 50 51<br />
24 25 26 27 28 29 30 31<br />
32 33 34 35 36<br />
18 19 20 21 22 23<br />
12 13 14 15 16 17<br />
7 8 9 10 11<br />
4 5 6<br />
1 2 3<br />
34 00<br />
Produced by <strong>Northeast</strong> <strong>Florida</strong> <strong>Regional</strong> <strong>Council</strong> for <strong>Florida</strong> Division of Emergency Management, 2009-2010<br />
Page 84<br />
Printed Pages in Yellow
08<br />
09<br />
81°57'0"W<br />
410<br />
81°56'0"W<br />
11<br />
12<br />
Charlton <strong>County</strong>, Ga<br />
34 10 34 10<br />
30°49'0"N<br />
Charlton <strong>County</strong>, Ga<br />
30°49'0"N<br />
09 09<br />
08 08<br />
30°48'0"N<br />
Charlton <strong>County</strong>, Ga<br />
30°48'0"N<br />
NASSAU COUNTY<br />
Murrhee Rd<br />
07 07<br />
Penny Haddock Rd<br />
30°47'0"N<br />
Pigeon Creek Rd<br />
Kolars Ferry Rd<br />
06 06<br />
30°47'0"N<br />
Lake Hampton Rd<br />
34 05 000m. N<br />
4 08 000m. E<br />
US National Grid<br />
100,000-m Square ID<br />
MQ<br />
Grid Zone Designation<br />
17R<br />
Datum = NAD 1983, 1,000-m USNG<br />
Mag. Declination<br />
5 o 41' 24"W<br />
Changing by<br />
4' W per yr<br />
Date 2009<br />
This map is for reference & planning purposes only.<br />
Hurricane evacuation decision-making and growth<br />
management implementation are local responsibilities.<br />
Please consult with local authorities.<br />
#<br />
Diagram<br />
Not to Scale<br />
GN<br />
^<br />
81°57'0"W<br />
09<br />
Notes:<br />
1. Surge limits are based on<br />
still water storm tide height<br />
elevation above NAVD88<br />
at high tide with no wave<br />
setup.<br />
2. Total Storm Tide limits were<br />
derived from Maximum of<br />
Maximums surge heights<br />
over LIDAR based digital<br />
elevation.<br />
3. The Points of Reference are<br />
locations determined to be<br />
relevant to emergency managment<br />
officials.<br />
4 10<br />
ATLAS LEGEND<br />
®v HOSPITAL<br />
%2 Points of Reference<br />
Evacuation Route<br />
City Limits<br />
NHD Lakes<br />
NHD Major Water<br />
Cat<br />
1<br />
2<br />
3<br />
4<br />
5<br />
81°56'0"W<br />
11<br />
Storm Tide Zones<br />
<strong>Nassau</strong> <strong>County</strong>, 2010<br />
Scale - 1:24,000<br />
Feet<br />
0 2,000<br />
USNG Page 17R MQ 08 05<br />
Map Plate 111<br />
12<br />
05<br />
81°55'0"W<br />
116 117<br />
109 110 111 112 113 114 115<br />
99 100 101 105 106 107 102 103 104 108<br />
83 84 85 86 87 88 89 90 91 92 93 94 95 96 97 98<br />
67 68 69 70 71 72 73 74 75 76 77 78 79 80 81 82<br />
52 53 54 55 56 57 58 59 60 61 62 63 64 65 66<br />
37 38 39 40 41 42 43 44 45 46 47 48 49 50 51<br />
24 25 26 27 28 29 30 31<br />
32 33 34 35 36<br />
18 19 20 21 22 23<br />
12 13 14 15 16 17<br />
7 8 9 10 11<br />
4 5 6<br />
1 2 3<br />
Produced by <strong>Northeast</strong> <strong>Florida</strong> <strong>Regional</strong> <strong>Council</strong> for <strong>Florida</strong> Division of Emergency Management, 2009-2010<br />
Page 85<br />
Printed Pages in Yellow
12<br />
81°55'0"W<br />
13<br />
14<br />
81°54'0"W<br />
15<br />
81°53'0"W<br />
16<br />
34 10 34 10<br />
Charlton <strong>County</strong>, Ga<br />
30°49'0"N<br />
30°49'0"N<br />
D<br />
2 ft<br />
Camden <strong>County</strong>, Ga<br />
09 09<br />
2 ft<br />
D<br />
08 08<br />
30°48'0"N<br />
30°48'0"N<br />
NASSAU COUNTY<br />
07 07<br />
2 ft<br />
D<br />
Kolars Ferry Rd<br />
06 06<br />
30°47'0"N<br />
30°47'0"N<br />
34 05 000m. N<br />
4 12 000m. E<br />
81°55'0"W<br />
US National Grid<br />
100,000-m Square ID<br />
MQ<br />
Grid Zone Designation<br />
17R<br />
Datum = NAD 1983, 1,000-m USNG<br />
Mag. Declination<br />
5 o 41' 24"W<br />
Changing by<br />
4' W per yr<br />
Date 2009<br />
This map is for reference & planning purposes only.<br />
Hurricane evacuation decision-making and growth<br />
management implementation are local responsibilities.<br />
Please consult with local authorities.<br />
#<br />
Diagram<br />
Not to Scale<br />
GN<br />
^<br />
13<br />
Notes:<br />
1. Surge limits are based on<br />
still water storm tide height<br />
elevation above NAVD88<br />
at high tide with no wave<br />
setup.<br />
2. Total Storm Tide limits were<br />
derived from Maximum of<br />
Maximums surge heights<br />
over LIDAR based digital<br />
elevation.<br />
3. The Points of Reference are<br />
locations determined to be<br />
relevant to emergency managment<br />
officials.<br />
81°54'0"W<br />
14<br />
ATLAS LEGEND<br />
®v HOSPITAL<br />
%2 Points of Reference<br />
Evacuation Route<br />
City Limits<br />
NHD Lakes<br />
NHD Major Water<br />
Cat<br />
1<br />
2<br />
3<br />
4<br />
5<br />
15<br />
81°53'0"W<br />
Storm Tide Zones<br />
<strong>Nassau</strong> <strong>County</strong>, 2010<br />
Scale - 1:24,000<br />
Feet<br />
0 2,000<br />
USNG Page 17R MQ 12 05<br />
Map Plate 112<br />
05<br />
16<br />
116 117<br />
109 110 111 112 113 114 115<br />
99 100 101 105 106 107 102 103 104 108<br />
83 84 85 86 87 88 89 90 91 92 93 94 95 96 97 98<br />
67 68 69 70 71 72 73 74 75 76 77 78 79 80 81 82<br />
52 53 54 55 56 57 58 59 60 61 62 63 64 65 66<br />
37 38 39 40 41 42 43 44 45 46 47 48 49 50 51<br />
24 25 26 27 28 29 30 31<br />
32 33 34 35 36<br />
18 19 20 21 22 23<br />
12 13 14 15 16 17<br />
7 8 9 10 11<br />
4 5 6<br />
1 2 3<br />
Produced by <strong>Northeast</strong> <strong>Florida</strong> <strong>Regional</strong> <strong>Council</strong> for <strong>Florida</strong> Division of Emergency Management, 2009-2010<br />
Page 86<br />
Printed Pages in Yellow
16<br />
17<br />
81°52'0"W<br />
18<br />
81°51'0"W<br />
19<br />
420<br />
34 10 34 10<br />
30°49'0"N<br />
30°49'0"N<br />
09 09<br />
Camden <strong>County</strong>, Ga<br />
08 08<br />
30°48'0"N<br />
D<br />
2.45 ft<br />
30°48'0"N<br />
07 07<br />
Bailey Haddock Ln<br />
30°47'0"N<br />
NASSAU COUNTY<br />
Kolars Ferry Rd<br />
06 06<br />
D<br />
5 ft<br />
Middle Rd<br />
Lessie Rd<br />
30°47'0"N<br />
State Hwy 121A<br />
<strong>County</strong> Hwy 115A<br />
34 05 000m. N<br />
4 16 000m. E<br />
US National Grid<br />
100,000-m Square ID<br />
MQ<br />
Grid Zone Designation<br />
17R<br />
Datum = NAD 1983, 1,000-m USNG<br />
Mag. Declination<br />
5 o 41' 24"W<br />
Changing by<br />
4' W per yr<br />
Date 2009<br />
This map is for reference & planning purposes only.<br />
Hurricane evacuation decision-making and growth<br />
management implementation are local responsibilities.<br />
Please consult with local authorities.<br />
#<br />
Diagram<br />
Not to Scale<br />
GN<br />
^<br />
81°52'0"W<br />
17<br />
Notes:<br />
1. Surge limits are based on<br />
still water storm tide height<br />
elevation above NAVD88<br />
at high tide with no wave<br />
setup.<br />
2. Total Storm Tide limits were<br />
derived from Maximum of<br />
Maximums surge heights<br />
over LIDAR based digital<br />
elevation.<br />
3. The Points of Reference are<br />
locations determined to be<br />
relevant to emergency managment<br />
officials.<br />
18<br />
ATLAS LEGEND<br />
®v HOSPITAL<br />
%2 Points of Reference<br />
Evacuation Route<br />
City Limits<br />
NHD Lakes<br />
NHD Major Water<br />
Cat<br />
1<br />
2<br />
3<br />
4<br />
5<br />
Thompson Rd<br />
81°51'0"W<br />
19<br />
Storm Tide Zones<br />
<strong>Nassau</strong> <strong>County</strong>, 2010<br />
Scale - 1:24,000<br />
Feet<br />
0 2,000<br />
USNG Page 17R MQ 16 05<br />
Map Plate 113<br />
4 20<br />
81°50'0"W<br />
116 117<br />
109 110 111 112 113 114 115<br />
99 100 101 105 106 107 102 103 104 108<br />
83 84 85 86 87 88 89 90 91 92 93 94 95 96 97 98<br />
67 68 69 70 71 72 73 74 75 76 77 78 79 80 81 82<br />
52 53 54 55 56 57 58 59 60 61 62 63 64 65 66<br />
37 38 39 40 41 42 43 44 45 46 47 48 49 50 51<br />
24 25 26 27 28 29 30 31<br />
32 33 34 35 36<br />
18 19 20 21 22 23<br />
12 13 14 15 16 17<br />
7 8 9 10 11<br />
4 5 6<br />
1 2 3<br />
05<br />
Produced by <strong>Northeast</strong> <strong>Florida</strong> <strong>Regional</strong> <strong>Council</strong> for <strong>Florida</strong> Division of Emergency Management, 2009-2010<br />
Page 87<br />
Printed Pages in Yellow
420<br />
81°50'0"W<br />
21<br />
81°49'0"W<br />
22<br />
23<br />
81°48'0"W<br />
24<br />
34 10 34 10<br />
30°49'0"N<br />
30°49'0"N<br />
09 09<br />
Camden <strong>County</strong>, Ga<br />
08 08<br />
30°48'0"N<br />
30°48'0"N<br />
07 07<br />
D<br />
8.64 ft<br />
Gladys Ln<br />
30°47'0"N<br />
Middle Rd<br />
06 06<br />
Wansley Rd<br />
NASSAU COUNTY<br />
30°47'0"N<br />
State Hwy 121A<br />
34 05 000m. N<br />
4 20 000m. E<br />
81°50'0"W<br />
US National Grid<br />
100,000-m Square ID<br />
MQ<br />
Grid Zone Designation<br />
17R<br />
Datum = NAD 1983, 1,000-m USNG<br />
Mag. Declination<br />
5 o 41' 24"W<br />
Changing by<br />
4' W per yr<br />
Date 2009<br />
This map is for reference & planning purposes only.<br />
Hurricane evacuation decision-making and growth<br />
management implementation are local responsibilities.<br />
Please consult with local authorities.<br />
#<br />
Diagram<br />
Not to Scale<br />
GN<br />
^<br />
21<br />
Lessie Rd<br />
Notes:<br />
1. Surge limits are based on<br />
still water storm tide height<br />
elevation above NAVD88<br />
at high tide with no wave<br />
setup.<br />
2. Total Storm Tide limits were<br />
derived from Maximum of<br />
Maximums surge heights<br />
over LIDAR based digital<br />
elevation.<br />
3. The Points of Reference are<br />
locations determined to be<br />
relevant to emergency managment<br />
officials.<br />
81°49'0"W<br />
22<br />
ATLAS LEGEND<br />
®v HOSPITAL<br />
%2 Points of Reference<br />
Evacuation Route<br />
City Limits<br />
NHD Lakes<br />
NHD Major Water<br />
Cat<br />
1<br />
2<br />
3<br />
4<br />
5<br />
23<br />
81°48'0"W<br />
Storm Tide Zones<br />
<strong>Nassau</strong> <strong>County</strong>, 2010<br />
Scale - 1:24,000<br />
Feet<br />
0 2,000<br />
USNG Page 17R MQ 20 05<br />
Map Plate 114<br />
C abbage Creek<br />
05<br />
24<br />
116 117<br />
109 110 111 112 113 114 115<br />
99 100 101 105 106 107 102 103 104 108<br />
83 84 85 86 87 88 89 90 91 92 93 94 95 96 97 98<br />
67 68 69 70 71 72 73 74 75 76 77 78 79 80 81 82<br />
52 53 54 55 56 57 58 59 60 61 62 63 64 65 66<br />
37 38 39 40 41 42 43 44 45 46 47 48 49 50 51<br />
24 25 26 27 28 29 30 31<br />
32 33 34 35 36<br />
18 19 20 21 22 23<br />
12 13 14 15 16 17<br />
7 8 9 10 11<br />
4 5 6<br />
1 2 3<br />
Produced by <strong>Northeast</strong> <strong>Florida</strong> <strong>Regional</strong> <strong>Council</strong> for <strong>Florida</strong> Division of Emergency Management, 2009-2010<br />
Page 88<br />
Printed Pages in Yellow
24<br />
25<br />
81°47'0"W<br />
26<br />
81°46'0"W<br />
27<br />
28<br />
81°45'0"W<br />
34 10 34 10<br />
30°49'0"N<br />
30°49'0"N<br />
09 09<br />
08 08<br />
30°48'0"N<br />
Camden <strong>County</strong>, Ga<br />
30°48'0"N<br />
07 07<br />
06 06<br />
30°47'0"N<br />
30°47'0"N<br />
NASSAU COUNTY<br />
34 05 000m. N<br />
4 24 000m. E<br />
US National Grid<br />
100,000-m Square ID<br />
MQ<br />
Grid Zone Designation<br />
17R<br />
Datum = NAD 1983, 1,000-m USNG<br />
Mag. Declination<br />
5 o 41' 24"W<br />
Changing by<br />
4' W per yr<br />
Date 2009<br />
This map is for reference & planning purposes only.<br />
Hurricane evacuation decision-making and growth<br />
management implementation are local responsibilities.<br />
Please consult with local authorities.<br />
#<br />
Diagram<br />
Not to Scale<br />
GN<br />
^<br />
81°47'0"W<br />
25<br />
Notes:<br />
1. Surge limits are based on<br />
still water storm tide height<br />
elevation above NAVD88<br />
at high tide with no wave<br />
setup.<br />
2. Total Storm Tide limits were<br />
derived from Maximum of<br />
Maximums surge heights<br />
over LIDAR based digital<br />
elevation.<br />
3. The Points of Reference are<br />
locations determined to be<br />
relevant to emergency managment<br />
officials.<br />
26<br />
ATLAS LEGEND<br />
®v HOSPITAL<br />
%2 Points of Reference<br />
Evacuation Route<br />
City Limits<br />
NHD Lakes<br />
NHD Major Water<br />
Cat<br />
1<br />
2<br />
3<br />
4<br />
5<br />
81°46'0"W<br />
27<br />
Storm Tide Zones<br />
<strong>Nassau</strong> <strong>County</strong>, 2010<br />
Scale - 1:24,000<br />
Feet<br />
0 2,000<br />
USNG Page 17R MQ 24 05<br />
Map Plate 115<br />
28<br />
81°45'0"W<br />
116 117<br />
109 110 111 112 113 114 115<br />
99 100 101 105 106 107 102 103 104 108<br />
83 84 85 86 87 88 89 90 91 92 93 94 95 96 97 98<br />
67 68 69 70 71 72 73 74 75 76 77 78 79 80 81 82<br />
52 53 54 55 56 57 58 59 60 61 62 63 64 65 66<br />
37 38 39 40 41 42 43 44 45 46 47 48 49 50 51<br />
24 25 26 27 28 29 30 31<br />
32 33 34 35 36<br />
18 19 20 21 22 23<br />
12 13 14 15 16 17<br />
7 8 9 10 11<br />
4 5 6<br />
1 2 3<br />
05<br />
Produced by <strong>Northeast</strong> <strong>Florida</strong> <strong>Regional</strong> <strong>Council</strong> for <strong>Florida</strong> Division of Emergency Management, 2009-2010<br />
Page 89<br />
Printed Pages in Yellow
08<br />
09<br />
81°57'0"W<br />
410<br />
81°56'0"W<br />
11<br />
12<br />
15 15<br />
14 14<br />
30°51'0"N<br />
30°51'0"N<br />
13 13<br />
Charlton <strong>County</strong>, Ga<br />
12 12<br />
30°50'0"N<br />
30°50'0"N<br />
11 11<br />
NASSAU COUNTY<br />
34 10 000m. N<br />
4 08 000m. E<br />
US National Grid<br />
100,000-m Square ID<br />
MQ<br />
Grid Zone Designation<br />
17R<br />
Datum = NAD 1983, 1,000-m USNG<br />
Mag. Declination<br />
5 o 41' 24"W<br />
Changing by<br />
4' W per yr<br />
Date 2009<br />
This map is for reference & planning purposes only.<br />
Hurricane evacuation decision-making and growth<br />
management implementation are local responsibilities.<br />
Please consult with local authorities.<br />
#<br />
Diagram<br />
Not to Scale<br />
GN<br />
^<br />
09<br />
81°57'0"W<br />
Notes:<br />
1. Surge limits are based on<br />
still water storm tide height<br />
elevation above NAVD88<br />
at high tide with no wave<br />
setup.<br />
2. Total Storm Tide limits were<br />
derived from Maximum of<br />
Maximums surge heights<br />
over LIDAR based digital<br />
elevation.<br />
3. The Points of Reference are<br />
locations determined to be<br />
relevant to emergency managment<br />
officials.<br />
4 10<br />
ATLAS LEGEND<br />
®v HOSPITAL<br />
%2 Points of Reference<br />
Evacuation Route<br />
City Limits<br />
NHD Lakes<br />
NHD Major Water<br />
Cat<br />
1<br />
2<br />
3<br />
4<br />
5<br />
81°56'0"W<br />
11<br />
Storm Tide Zones<br />
<strong>Nassau</strong> <strong>County</strong>, 2010<br />
Scale - 1:24,000<br />
Feet<br />
0 2,000<br />
USNG Page 17R MQ 08 10<br />
Map Plate 116<br />
12<br />
116 117<br />
109 110 111 112 113 114 115<br />
99 100 101 105 106 107 102 103 104 108<br />
83 84 85 86 87 88 89 90 91 92 93 94 95 96 97 98<br />
67 68 69 70 71 72 73 74 75 76 77 78 79 80 81 82<br />
52 53 54 55 56 57 58 59 60 61 62 63 64 65 66<br />
37 38 39 40 41 42 43 44 45 46 47 48 49 50 51<br />
24 25 26 27 28 29 30 31<br />
32 33 34 35 36<br />
18 19 20 21 22 23<br />
12 13 14 15 16 17<br />
7 8 9 10 11<br />
4 5 6<br />
1 2 3<br />
34 10<br />
Produced by <strong>Northeast</strong> <strong>Florida</strong> <strong>Regional</strong> <strong>Council</strong> for <strong>Florida</strong> Division of Emergency Management, 2009-2010<br />
Page 90<br />
Printed Pages in Yellow
12<br />
81°55'0"W<br />
13<br />
14<br />
81°54'0"W<br />
15<br />
81°53'0"W<br />
16<br />
15 15<br />
14 14<br />
30°51'0"N<br />
30°51'0"N<br />
13 13<br />
Charlton <strong>County</strong>, Ga<br />
Camden <strong>County</strong>, Ga<br />
12 12<br />
30°50'0"N<br />
30°50'0"N<br />
11 11<br />
D<br />
2.35 ft<br />
NASSAU COUNTY<br />
34 10 000m. N<br />
4 12 000m. E<br />
81°55'0"W<br />
US National Grid<br />
100,000-m Square ID<br />
MQ<br />
Grid Zone Designation<br />
17R<br />
Datum = NAD 1983, 1,000-m USNG<br />
Mag. Declination<br />
5 o 41' 24"W<br />
Changing by<br />
4' W per yr<br />
Date 2009<br />
This map is for reference & planning purposes only.<br />
Hurricane evacuation decision-making and growth<br />
management implementation are local responsibilities.<br />
Please consult with local authorities.<br />
#<br />
Diagram<br />
Not to Scale<br />
GN<br />
^<br />
13<br />
Notes:<br />
1. Surge limits are based on<br />
still water storm tide height<br />
elevation above NAVD88<br />
at high tide with no wave<br />
setup.<br />
2. Total Storm Tide limits were<br />
derived from Maximum of<br />
Maximums surge heights<br />
over LIDAR based digital<br />
elevation.<br />
3. The Points of Reference are<br />
locations determined to be<br />
relevant to emergency managment<br />
officials.<br />
D<br />
81°54'0"W<br />
14<br />
ATLAS LEGEND<br />
®v HOSPITAL<br />
%2 Points of Reference<br />
Evacuation Route<br />
City Limits<br />
NHD Lakes<br />
NHD Major Water<br />
Cat<br />
1<br />
2<br />
3<br />
4<br />
5<br />
15<br />
81°53'0"W<br />
Storm Tide Zones<br />
<strong>Nassau</strong> <strong>County</strong>, 2010<br />
Scale - 1:24,000<br />
Feet<br />
0 2,000<br />
USNG Page 17R MQ 12 10<br />
Map Plate 117<br />
16<br />
116 117<br />
109 110 111 112 113 114 115<br />
99 100 101 105 106 107 102 103 104 108<br />
83 84 85 86 87 88 89 90 91 92 93 94 95 96 97 98<br />
67 68 69 70 71 72 73 74 75 76 77 78 79 80 81 82<br />
52 53 54 55 56 57 58 59 60 61 62 63 64 65 66<br />
37 38 39 40 41 42 43 44 45 46 47 48 49 50 51<br />
24 25 26 27 28 29 30 31<br />
32 33 34 35 36<br />
18 19 20 21 22 23<br />
12 13 14 15 16 17<br />
7 8 9 10 11<br />
4 5 6<br />
1 2 3<br />
34 10<br />
Produced by <strong>Northeast</strong> <strong>Florida</strong> <strong>Regional</strong> <strong>Council</strong> for <strong>Florida</strong> Division of Emergency Management, 2009-2010<br />
Page 91<br />
Printed Pages in Yellow
Funding was provided by the <strong>Florida</strong> Legislature with funding from the Federal<br />
Emergency Management Agency (FEMA) through the <strong>Florida</strong> Division of Emergency<br />
Management. Local match was provided by <strong>Northeast</strong> <strong>Florida</strong> <strong>Regional</strong> Planning<br />
<strong>Council</strong> and the counties of Baker, Clay, Duval, Flagler, <strong>Nassau</strong>, Putnam and St.<br />
Johns.<br />
<strong>Florida</strong> Division of Emergency Management<br />
David Halstead, Director<br />
2555 Shumard Oak Boulevard, Tallahassee, <strong>Florida</strong> 32399<br />
Web site: www.floridadisaster.org<br />
Prepared and published by<br />
<strong>Northeast</strong> <strong>Florida</strong> <strong>Regional</strong> <strong>Council</strong>, 6850 Belfort Oaks Place, Jacksonville, <strong>Florida</strong> 32216.<br />
Tel: (904) 279-0880, Fax: (904) 279-0881, E-mail: epayne@nefrc.org Web site: www.nefrc.org<br />
Study Manager: Elizabeth Payne, Senior <strong>Regional</strong> Planner<br />
Statewide Program Manager: Jeffrey Alexander, <strong>Northeast</strong> <strong>Florida</strong> <strong>Regional</strong> <strong>Council</strong>