Surface-enhanced Raman and fluorescence joint analysis of soil ...
Surface-enhanced Raman and fluorescence joint analysis of soil ...
Surface-enhanced Raman and fluorescence joint analysis of soil ...

You also want an ePaper? Increase the reach of your titles
YUMPU automatically turns print PDFs into web optimized ePapers that Google loves.
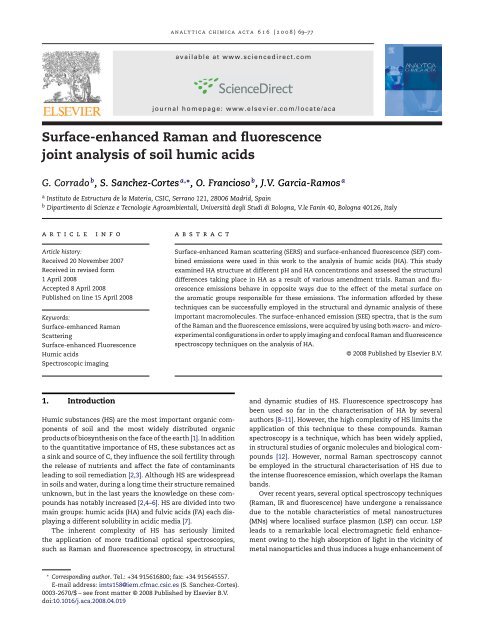
analytica chimica acta 616 (2008) 69–77<br />
available at www.sciencedirect.com<br />
journal homepage: www.elsevier.com/locate/aca<br />
<strong>Surface</strong>-<strong>enhanced</strong> <strong>Raman</strong> <strong>and</strong> <strong>fluorescence</strong><br />
<strong>joint</strong> <strong>analysis</strong> <strong>of</strong> <strong>soil</strong> humic acids<br />
G. Corrado b , S. Sanchez-Cortes a,∗ , O. Francioso b , J.V. Garcia-Ramos a<br />
a Instituto de Estructura de la Materia, CSIC, Serrano 121, 28006 Madrid, Spain<br />
b Dipartimento di Scienze e Tecnologie Agroambientali, Università degli Studi di Bologna, V.le Fanin 40, Bologna 40126, Italy<br />
article<br />
info<br />
abstract<br />
Article history:<br />
Received 20 November 2007<br />
Received in revised form<br />
1 April 2008<br />
Accepted 8 April 2008<br />
Published on line 15 April 2008<br />
Keywords:<br />
<strong>Surface</strong>-emhanced <strong>Raman</strong><br />
Scattering<br />
<strong>Surface</strong>-<strong>enhanced</strong> Fluorescence<br />
Humic acids<br />
Spectroscopic imaging<br />
<strong>Surface</strong>-<strong>enhanced</strong> <strong>Raman</strong> scattering (SERS) <strong>and</strong> surface-<strong>enhanced</strong> <strong>fluorescence</strong> (SEF) combined<br />
emissions were used in this work to the <strong>analysis</strong> <strong>of</strong> humic acids (HA). This study<br />
examined HA structure at different pH <strong>and</strong> HA concentrations <strong>and</strong> assessed the structural<br />
differences taking place in HA as a result <strong>of</strong> various amendment trials. <strong>Raman</strong> <strong>and</strong> <strong>fluorescence</strong><br />
emissions behave in opposite ways due to the effect <strong>of</strong> the metal surface on<br />
the aromatic groups responsible for these emissions. The information afforded by these<br />
techniques can be successfully employed in the structural <strong>and</strong> dynamic <strong>analysis</strong> <strong>of</strong> these<br />
important macromolecules. The surface-<strong>enhanced</strong> emission (SEE) spectra, that is the sum<br />
<strong>of</strong> the <strong>Raman</strong> <strong>and</strong> the <strong>fluorescence</strong> emissions, were acquired by using both macro- <strong>and</strong> microexperimental<br />
configurations in order to apply imaging <strong>and</strong> confocal <strong>Raman</strong> <strong>and</strong> <strong>fluorescence</strong><br />
spectroscopy techniques on the <strong>analysis</strong> <strong>of</strong> HA.<br />
© 2008 Published by Elsevier B.V.<br />
1. Introduction<br />
Humic substances (HS) are the most important organic components<br />
<strong>of</strong> <strong>soil</strong> <strong>and</strong> the most widely distributed organic<br />
products <strong>of</strong> biosynthesis on the face <strong>of</strong> the earth [1]. In addition<br />
to the quantitative importance <strong>of</strong> HS, these substances act as<br />
a sink <strong>and</strong> source <strong>of</strong> C, they influence the <strong>soil</strong> fertility through<br />
the release <strong>of</strong> nutrients <strong>and</strong> affect the fate <strong>of</strong> contaminants<br />
leading to <strong>soil</strong> remediation [2,3]. Although HS are widespread<br />
in <strong>soil</strong>s <strong>and</strong> water, during a long time their structure remained<br />
unknown, but in the last years the knowledge on these compounds<br />
has notably increased [2,4–6]. HS are divided into two<br />
main groups: humic acids (HA) <strong>and</strong> fulvic acids (FA) each displaying<br />
a different solubility in acidic media [7].<br />
The inherent complexity <strong>of</strong> HS has seriously limited<br />
the application <strong>of</strong> more traditional optical spectroscopies,<br />
such as <strong>Raman</strong> <strong>and</strong> <strong>fluorescence</strong> spectroscopy, in structural<br />
<strong>and</strong> dynamic studies <strong>of</strong> HS. Fluorescence spectroscopy has<br />
been used so far in the characterisation <strong>of</strong> HA by several<br />
authors [8–11]. However, the high complexity <strong>of</strong> HS limits the<br />
application <strong>of</strong> this technique to these compounds. <strong>Raman</strong><br />
spectroscopy is a technique, which has been widely applied,<br />
in structural studies <strong>of</strong> organic molecules <strong>and</strong> biological compounds<br />
[12]. However, normal <strong>Raman</strong> spectroscopy cannot<br />
be employed in the structural characterisation <strong>of</strong> HS due to<br />
the intense <strong>fluorescence</strong> emission, which overlaps the <strong>Raman</strong><br />
b<strong>and</strong>s.<br />
Over recent years, several optical spectroscopy techniques<br />
(<strong>Raman</strong>, IR <strong>and</strong> <strong>fluorescence</strong>) have undergone a renaissance<br />
due to the notable characteristics <strong>of</strong> metal nanostructures<br />
(MNs) where localised surface plasmon (LSP) can occur. LSP<br />
leads to a remarkable local electromagnetic field enhancement<br />
owing to the high absorption <strong>of</strong> light in the vicinity <strong>of</strong><br />
metal nanoparticles <strong>and</strong> thus induces a huge enhancement <strong>of</strong><br />
∗ Corresponding author. Tel.: +34 915616800; fax: +34 915645557.<br />
E-mail address: imts158@iem.cfmac.csic.es (S. Sanchez-Cortes).<br />
0003-2670/$ – see front matter © 2008 Published by Elsevier B.V.<br />
doi:10.1016/j.aca.2008.04.019
70 analytica chimica acta 616 (2008) 69–77<br />
spectroscopic signals, mainly in the case <strong>of</strong> emission signals<br />
<strong>of</strong> molecules placed in the proximities <strong>of</strong> the surface [13–15].<br />
<strong>Raman</strong> scattering is greatly <strong>enhanced</strong> as a consequence<br />
<strong>of</strong> LSP. For this reason, the surface-<strong>enhanced</strong> <strong>Raman</strong> scattering<br />
(SERS) technique can be successfully applied to the<br />
study <strong>of</strong> highly fluorescent molecules in water, due to<br />
the <strong>fluorescence</strong> quenching occurring on the metal surface<br />
via a charge-transfer mechanism [16]. This effect<br />
enables <strong>Raman</strong> to be applied to the characterisation <strong>of</strong> HS<br />
[17–20].<br />
SERS spectra can provide important information on the<br />
HS structure in function <strong>of</strong> factors such as the humification<br />
degree [21], extraction <strong>and</strong> purification processes [22], the <strong>soil</strong><br />
amendment trials [23], HS extraction fractions [17,24] <strong>and</strong> pH<br />
[25]. The growing importance <strong>of</strong> SERS in the <strong>analysis</strong> <strong>of</strong> HS<br />
has recently been highlighted in several reviews dealing with<br />
techniques applied to the <strong>analysis</strong> <strong>of</strong> HS [26–28]. SERS has also<br />
been used to examine pesticide–HA interaction [29]. However,<br />
SERS is not a quantitative technique because <strong>of</strong> effects such<br />
as the resonance <strong>Raman</strong> <strong>and</strong> the adsorption on surfaces [30],<br />
although these characteristics can also serve to study structural<br />
<strong>and</strong> dynamic processes undertaken by macromolecules<br />
in the presence <strong>of</strong> surfaces [31].<br />
The surface-<strong>enhanced</strong> <strong>fluorescence</strong> (SEF) technique has<br />
not been employed as much as SERS because <strong>of</strong> chargetransfer<br />
effects, which take place on the surface <strong>and</strong> which,<br />
in turn, lead to an actual quenching <strong>of</strong> the <strong>fluorescence</strong>. SEF<br />
effect is also induced by LPR near a metal surface [32,33].However,<br />
the net effect seems to vary depending on the distance<br />
between the fluorophore <strong>and</strong> the surface, as well as on the<br />
intrinsic quantum yield <strong>of</strong> the fluorophore [34]. In general,<br />
the <strong>fluorescence</strong> is not quenched if the molecule is relatively<br />
far from the surface. The estimated optimal distance for a<br />
good SEF enhancement is achieved above 100 Å [35,36]. At distances<br />
further than this value, SERS <strong>and</strong> SEF signals can be<br />
simultaneously emitted <strong>and</strong> registered for molecular species<br />
placed in the vicinity <strong>of</strong> MNs [36–38]. Since the average size<br />
<strong>of</strong> HA is larger than this value [39], the fluorophores included<br />
in the HA structure could be good c<strong>and</strong>idates to give rise to<br />
intense SEF + SERS <strong>joint</strong> emission spectra, without the intrinsic<br />
quenching observed on a surface. This is possible due to the<br />
fact that the HS cross-sections <strong>of</strong> either <strong>Raman</strong> or <strong>fluorescence</strong><br />
are <strong>of</strong> the same order on MNs, <strong>and</strong> thus, a surface-<strong>enhanced</strong><br />
emission (SEE) is seen for HS adsorbed on these substrates<br />
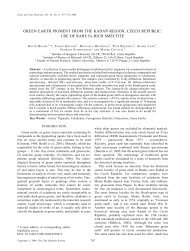
(Fig. 1, bottom). Furthermore, the SEF emission affords information<br />
on the HA macromolecules adsorbed onto a surface,<br />
Fig. 1 – Top: experimental set-up for SEE measurements. Bottom left: a SEM image <strong>of</strong> typical Ag nanoaggregates. Bottom<br />
right: scheme displaying the adsorption <strong>of</strong> HA micelles <strong>and</strong> the emission <strong>of</strong> <strong>Raman</strong> a <strong>fluorescence</strong> combined process.
analytica chimica acta 616 (2008) 69–77 71<br />
i.e. on the aggregation process undergone by these macromolecules,<br />
which are <strong>of</strong> importance to underst<strong>and</strong> how these<br />
compounds are attached on the inorganic matrices existing<br />
in <strong>soil</strong>s. This fact represented an evident advantage regarding<br />
the normal <strong>fluorescence</strong> spectra obtained in solution.<br />
Spectroscopic imaging <strong>and</strong> micro-confocal techniques<br />
have been developed for both <strong>Raman</strong> <strong>and</strong> <strong>fluorescence</strong> spectroscopy<br />
with promising analytical applications [40], <strong>and</strong><br />
could also be <strong>of</strong> interest in the study <strong>of</strong> HA, as demonstrated by<br />
previous studies [41]. The combination <strong>of</strong> surface-<strong>enhanced</strong><br />
techniques <strong>and</strong> microscopy is also a powerful methodology<br />
which has attracted much attention in the <strong>analysis</strong> <strong>of</strong> biological<br />
systems such as cells or bacteria [42,43] <strong>and</strong> which could<br />
be very helpful in the characterisation <strong>of</strong> HS.<br />
In this work we analysed SEE spectra <strong>of</strong> HA. This work<br />
represents the first time that SEF technique is used in the characterisation<br />
<strong>of</strong> HA. The HA compounds selected for this study<br />
were extracted from a <strong>soil</strong> amended over a period <strong>of</strong> 30 years<br />
under several conditions <strong>and</strong> the corresponding control experiments<br />
in order to evaluate the structural variations induced<br />
by the different treatments. The SEE spectra were acquired by<br />
using both macro- <strong>and</strong> micro-experimental configurations in<br />
order to investigate the abilities <strong>of</strong> the new imaging <strong>and</strong> confocal<br />
<strong>Raman</strong> <strong>and</strong> <strong>fluorescence</strong> spectroscopy techniques on the<br />
<strong>analysis</strong> <strong>of</strong> these HA.<br />
2. Materials <strong>and</strong> methods<br />
The <strong>soil</strong> samples analysed (horizon Ap, 0–40 cm depth) were<br />
taken from plots <strong>of</strong> a 30 plus year field experiment conducted<br />
at the agricultural farm <strong>of</strong> the University <strong>of</strong> Bologna’s Agricultural<br />
Faculty (Cadriano, Italy). This <strong>soil</strong> is classified (Soil Survey<br />
Staff, USDA SCS 1989) as a Typic Udochrept.<br />
The experimental design included plots amended over a<br />
30-year period with cattle manure (CM) <strong>and</strong> crop residues (CR)<br />
constituted by wheat straw or corn stalks (each biomass followed<br />
in succession), with unamended <strong>soil</strong> as control (C). CM<br />
was added to the plots at the following rate: 6 t ha −1 <strong>of</strong> dry matter<br />
after wheat tillage <strong>and</strong> 7.5 t ha −1 <strong>of</strong> dry matter after corn<br />
tillage. All the plots examined, including C, were fertilised with<br />
100 kg N ha −1 yr −1 added in the form <strong>of</strong> ammonium nitrate.<br />
Each treatment (CM, CR <strong>and</strong> C) was conducted in triplicate<br />
using a r<strong>and</strong>omized block design.<br />
Analyses were carried out on <strong>soil</strong> samples taken from:<br />
(i) unamended <strong>soil</strong> in 1972 (C 0 ), <strong>and</strong> (ii) after 30 years (C 30 )<br />
<strong>and</strong> (iii) after a 30-year amendment period with CM <strong>and</strong> CR.<br />
The extraction procedures used to isolate these samples have<br />
already been described in Ref. [23].<br />
to enhance the electromagnetic field on the metal surface. A<br />
typical Ag MNs used to record the SEE spectra is shown in Fig. 1<br />
(bottom).<br />
Samples for SEE measurements were made by adding an<br />
aliquot <strong>of</strong> an aqueous HS solution, prepared by solving 1 mg <strong>of</strong><br />
the corresponding humic fraction in 1 mL <strong>of</strong> tri-distilled water,<br />
to 1 mL <strong>of</strong> the silver colloid until the desired concentration.<br />
The pH <strong>of</strong> the mixture was adjusted by adding 0.1 M NaOH or<br />
HNO 3 . All solutions were prepared with tri-distilled water.<br />
The SERS spectra were recorded by means <strong>of</strong> a Renishaw<br />
<strong>Raman</strong> Microscope System RM2000, using the macroconfiguration<br />
equipped with a notch filter <strong>and</strong> an electrically<br />
refrigerated CCD camera (575× pixels) as indicated in Fig. 1.<br />
The <strong>Raman</strong> <strong>and</strong> <strong>fluorescence</strong> emission spectrum is recorded<br />
by the CCD camera. The 514.5 nm line <strong>of</strong> an Ar + laser was used.<br />
The laser power at the sample was 2.0 mW. Spectral resolution<br />
was 2 cm −1 . Micro-SERS spectra were obtained by using a 100×<br />
objective (NA = 0.9). Confocal micro-SERS <strong>and</strong> <strong>Raman</strong> images<br />
were recorded by using a PRIOR motorised stage coupled to the<br />
microscope with a 1 m step. The SERS spectra were baselined<br />
to withdraw the contribution <strong>of</strong> the <strong>fluorescence</strong> by using the<br />
algorithm provided by the Origin 6.0 Program.<br />
3. Results <strong>and</strong> discussion<br />
3.1. SERS spectra <strong>of</strong> humic acids<br />
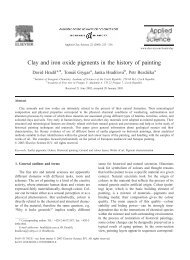
Fig. 2 shows the SERS spectra <strong>of</strong> HA at pH 10.0, after correction<br />
<strong>of</strong> the <strong>fluorescence</strong> background. At pH 10.0 the SERS spectra<br />
<strong>of</strong> all HA samples are dominated by two very strong <strong>and</strong> narrow<br />
b<strong>and</strong>s, at 1308 <strong>and</strong> 1611 cm −1 , which can be attributed<br />
to the aromatic part <strong>of</strong> HS <strong>and</strong> in particular to polycyclic aromatic<br />
hydrocarbon (PAH) structures. The nature <strong>of</strong> these PAH<br />
residues is still unknown, but the similarity <strong>of</strong> the SERS pattern<br />
observed at high pH <strong>and</strong> the <strong>Raman</strong> spectra <strong>of</strong>, phenanthrene,<br />
perylene [45] <strong>and</strong> coronene [46] compounds suggests that similar<br />
structures could exist in HA, either from anthropogenic<br />
2.1. SERS spectroscopy<br />
Colloidal silver nanoparticles were prepared by using hydroxylamine<br />
hydrochloride as reducing agent. In a recent work, a<br />
deep study <strong>of</strong> Ag MNs prepared by reduction with hydroxylamine<br />
(AgHx) was accomplished [44]. AgHx was activated by<br />
the addition <strong>of</strong> potassium nitrate, which induced the particle<br />
aggregation to form other larger aggregations. This process<br />
is necessary when using these systems as a substrate for<br />
SERS, since specific morphological requirements are needed<br />
Fig. 2 – SERS spectra <strong>of</strong> the different HA samples<br />
(10 gmL −1 ) employed in this work after correcting the<br />
<strong>fluorescence</strong> background to better show the <strong>Raman</strong><br />
features.
72 analytica chimica acta 616 (2008) 69–77<br />
or natural origins [2,7]. The situation seems to be different<br />
in the case <strong>of</strong> FA, since no PAH b<strong>and</strong>s are observed in these<br />
compounds [24]. The presence <strong>of</strong> PAH in the SERS spectrum<br />
recorded at alkaline pH, suggests that PAH residues might be<br />
mainly localised inside the HA structure, since a HA structure<br />
expansion is expected at high pH due to ionisation <strong>of</strong><br />
carboxylic <strong>and</strong> phenolic groups [47]. Although the macromolecular<br />
expansion is limited by chemical cross-linkages<br />
[48], it seems to be enough to allow a higher exposure <strong>of</strong> the<br />
polyaromatic groups to the metal surface. The b<strong>and</strong>s corresponding<br />
to PAH residues are resonantly <strong>enhanced</strong> as revealed<br />
the appearance <strong>of</strong> the overtone <strong>and</strong> combination b<strong>and</strong>s at<br />
1948, 2577, 2913 <strong>and</strong> 3228 cm −1 in the SERS spectra (Fig. 2).<br />
However, we cannot deduce that PAH groups are quantitatively<br />
predominant in the HA structure, since these groups<br />
undergone a selective enhancement by SERS.<br />
The SERS spectra in Fig. 2 were normalised to the water<br />
b<strong>and</strong> appearing at 3420 cm −1 . As can be seen, the CR <strong>and</strong> CM<br />
samples display a lower SERS intensity in comparison to the<br />
control samples C 0 <strong>and</strong> C 30 . In order to better underst<strong>and</strong> this<br />
behaviour we carried out a more detailed SERS study <strong>of</strong> HA<br />
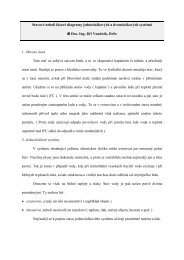
at different pH values using the C 30 sample (Fig. 3), since this<br />
sample was the one, which displayed the most intense variation.<br />
The b<strong>and</strong>s at 1308 <strong>and</strong> 1611 cm −1 observed at pH 10.0<br />
(Fig. 3a) decreased markedly at pH 5 (Fig. 3d), as a consequence<br />
<strong>of</strong>: (i) an increase <strong>of</strong> intermolecular interactions, due to both<br />
a decrease <strong>of</strong> electric repulsions <strong>and</strong> an increase [47] <strong>of</strong> H-<br />
bonds <strong>and</strong> (ii) coagulation <strong>of</strong> smaller HA micelles into larger<br />
ones [49]. These facts lead to a macromolecular shrinkage.<br />
Below this pH value, a significant enhancement <strong>of</strong> the SERS<br />
intensity was observed (Fig. 3e), which is related to the HA<br />
adsorption tendency increase <strong>of</strong> at low pH as also reported by<br />
several authors [50,51]. The HA adsorption increase is related<br />
to the higher hydrophobic nature <strong>of</strong> HA at low pH caused<br />
by the negative charge decrease upon protonation <strong>of</strong> acidic<br />
HA groups. The increase <strong>of</strong> HA molecules adsorbed on the<br />
metal is further intensified due to the reduction <strong>of</strong> the area<br />
per molecule induced by the molecular shrinkage occurring<br />
at low pH [52].<br />
The SERS spectrum seen at low pH changes with respect to<br />
that observed at high pH (Fig. 3a). The <strong>analysis</strong> <strong>of</strong> the <strong>Raman</strong><br />
broad b<strong>and</strong>s seen at low pH is rather difficult owed to the sum<br />
<strong>of</strong> different components <strong>and</strong> the possible contribution from<br />
carbonaceous materials such as charcoal [53,54], which may<br />
be incorporated in the humic structure <strong>of</strong> that can be formed<br />
due to photodegradation as indicated by other authors [55].<br />
Nevertheless, the different <strong>Raman</strong> pr<strong>of</strong>ile with respect to charcoal<br />
<strong>Raman</strong> spectrum [54], the variation <strong>of</strong> this spectrum with<br />
the pH, as revealed below, <strong>and</strong> the appearance <strong>of</strong> b<strong>and</strong>s which<br />
are attributable to functional groups actually existing in HA,<br />
such as benzoic, polyphenolic <strong>and</strong> aliphatic ones, discharge<br />
the possibility <strong>of</strong> a massive photodegradation <strong>of</strong> the adsorbed<br />
HA as an effect <strong>of</strong> light irradiation.<br />
The dependency <strong>of</strong> SERS intensity on pH is better seen in<br />
the inset figure <strong>of</strong> Fig. 3, which displays a minimum at ca.<br />
5.5. Recently, Terashima et al. [52] have demonstrated that<br />
the apparent pK (pK app ) <strong>of</strong> HA is approximately 5.5 <strong>and</strong>, as<br />
a consequence, at pH 5.5 drastic changes take place in several<br />
physical properties, such as surface tension, surface area<br />
occupied by HA molecules when adsorbed onto a surface<br />
<strong>and</strong> HA hydrophobicity. A similar pH value was reported by<br />
other authors when studying the aggregation tendency <strong>of</strong> HA<br />
[56,57].<br />
It therefore follows that the lower SERS intensity <strong>of</strong> CR <strong>and</strong><br />
CM samples in comparison to the control C 0 <strong>and</strong> C 30 , can<br />
be attributed to the effect <strong>of</strong> amendants. The introduction <strong>of</strong><br />
lignin in the HA structure may increase the stability <strong>of</strong> the<br />
macromolecule due to the higher H-bonds formed between<br />
OH groups afforded by lignin. In the case <strong>of</strong> CM, the enrichment<br />
in fatty acids, due to the treatment with manure, also<br />
lead to a higher stabilisation <strong>of</strong> the macromolecule due to<br />
the formation <strong>of</strong> hydrophobic interactions between aliphatic<br />
chains <strong>of</strong> fatty acid residues.<br />
3.2. <strong>Surface</strong>-<strong>enhanced</strong> emission spectra <strong>of</strong> humic acids<br />
Fig. 3 – SERS spectra <strong>of</strong> C 30 sample (10 gmL −1 ) after<br />
<strong>fluorescence</strong> correction at the following pH: (a) 10.0, (b) 8.0,<br />
(c) 6.0, (d) 5.5 <strong>and</strong> (e) 3.0. Inset: variation <strong>of</strong> the 1609 cm −1<br />
SERS b<strong>and</strong> on changing the pH.<br />
Fig. 4 compares the normal <strong>Raman</strong> spectrum <strong>of</strong> the C 30 sample<br />
(1 gmL −1 ) with SEE spectrum <strong>of</strong> the same sample in the<br />
presence <strong>of</strong> Ag NPs. The emission spectrum <strong>of</strong> the solution<br />
shows the <strong>Raman</strong> b<strong>and</strong>s <strong>of</strong> water at 1640 cm −1 (very weak) <strong>and</strong><br />
3420 cm −1 (strong) <strong>and</strong> a broad <strong>fluorescence</strong> b<strong>and</strong> produced<br />
by HA centered at 630 nm, while no <strong>Raman</strong> b<strong>and</strong> <strong>of</strong> HA are<br />
seen. In contrast, the SEE spectrum <strong>of</strong> HA was characterised<br />
by strong <strong>Raman</strong> b<strong>and</strong>s in the 1200–1650 cm −1 region, <strong>and</strong> by<br />
a <strong>fluorescence</strong> emission with a maximum at 650 nm, which<br />
is threefold intensified in relation to that seen in aqueous<br />
solution. The intensification <strong>of</strong> <strong>Raman</strong> b<strong>and</strong>s corresponding<br />
to the HA <strong>and</strong> the shift observed for the <strong>fluorescence</strong> emission<br />
maximum suggests structural changes in the HA upon<br />
adsorption on the metal. Thus, the SEE spectrum <strong>of</strong> the C 30<br />
sample provided a combined <strong>enhanced</strong> <strong>Raman</strong> <strong>and</strong> <strong>fluorescence</strong><br />
information because the cross-sections corresponding
analytica chimica acta 616 (2008) 69–77 73<br />
Fig. 4 – <strong>Surface</strong>-<strong>enhanced</strong> emission (SEE) spectra <strong>of</strong> C 30<br />
sample (1 gmL −1 ) in absence (a) <strong>and</strong> presence (b) <strong>of</strong> Ag<br />
nanoparticles.<br />
Fig. 6 – Panel (a): variation with pH <strong>of</strong> the surface-<strong>enhanced</strong><br />
<strong>fluorescence</strong> emission (excitation at 514.5 nm <strong>and</strong> emission<br />
at 625 nm). Panel (b): the surface-<strong>enhanced</strong> <strong>Raman</strong><br />
scattering intensity <strong>of</strong> 1611 cm −1 b<strong>and</strong> (excitation at<br />
514.5 nm) measured from the C 30 , CR <strong>and</strong> CM samples at a<br />
HA concentration <strong>of</strong> 10.0 gmL −1 .<br />
to both emissions are <strong>of</strong> the same magnitude order. Although<br />
the total emission measured from adsorbates adsorbed on<br />
metal NPs is also a combined luminescence signal with contributions<br />
from both the molecule <strong>and</strong> the metal background<br />
luminescence [58], we can consider that the latter one is negligible<br />
in relation to the luminescence <strong>of</strong> HA in the SEE spectra.<br />
SEE spectra recorded at three different HA concentrations<br />
are shown in Fig. 5. At high concentration, the <strong>fluorescence</strong><br />
signal predominates over the <strong>Raman</strong> signal, while at lower<br />
concentrations the opposite behaviour is witnessed. This is<br />
probably due to the formation <strong>of</strong> HA multilayers on the Ag<br />
NPs, which leads to higher <strong>fluorescence</strong> intensities as the multilayer<br />
width is increased due to a lower quenching effect by<br />
the metal. The predominance <strong>of</strong> the SERS signal over the SEF<br />
Fig. 5 – <strong>Surface</strong>-<strong>enhanced</strong> emission (SEE) spectra <strong>of</strong> C 30<br />
sample on Ag nanoparticles at the following<br />
concentrations: (a) 10.0 gmL −1 , (b) 1.0 gmL −1 <strong>and</strong> (c)<br />
0.1 gmL −1 .<br />
one (in fact limit <strong>of</strong> detection <strong>of</strong> 1–100 ppb can be obtained,<br />
depending on the case) points out the powerful analytical possibilities<br />
<strong>of</strong> SERS in comparison to the <strong>fluorescence</strong>, in spite <strong>of</strong><br />
the higher sensibility <strong>of</strong> <strong>fluorescence</strong> over the <strong>Raman</strong> effect.<br />
The effect <strong>of</strong> pH on the <strong>Raman</strong> <strong>and</strong> <strong>fluorescence</strong> <strong>of</strong> HA samples<br />
is shown in Fig. 6. The <strong>Raman</strong> intensity changes with the<br />
pH reaching a minimum at pH 5.5 (Fig. 6b). In contrast, the<br />
<strong>analysis</strong> <strong>of</strong> the <strong>fluorescence</strong> emission revealed an opposite<br />
behaviour, i.e. a maximum at precisely pH 5.5 (Fig. 6a).<br />
This contrary behaviour <strong>of</strong> the <strong>fluorescence</strong> <strong>and</strong> SERS signals<br />
<strong>of</strong> HA can be explained on the basis <strong>of</strong> the structural<br />
modifications induced on HA as a consequence <strong>of</strong> the acidic<br />
groups ionisation on increasing the pH. Other authors have<br />
also reported similar variations with pH <strong>of</strong> the HS <strong>fluorescence</strong><br />
emission [8,59]. The HA uncoiling or structural expansion<br />
occurring in the pH range between 8 <strong>and</strong> 10 provoked an opposite<br />
response on the <strong>fluorescence</strong> <strong>and</strong> <strong>Raman</strong> intensities. By<br />
one h<strong>and</strong>, it favours the approach <strong>of</strong> the inner PAH residues<br />
<strong>of</strong> HA to the metal leading to an enhancement <strong>of</strong> the SERS<br />
signal. On the other h<strong>and</strong>, this expansion induces the <strong>fluorescence</strong><br />
quenching due to the higher exposure <strong>of</strong> fluorophores<br />
to the aqueous polar medium <strong>and</strong> the charge-transfer induced<br />
by the closer metal surface.<br />
In contrast, at pH 5.5 the HA is compacted, <strong>and</strong> consequently<br />
the PAHs residues remain inside the HA structure, <strong>and</strong><br />
therefore, far from the metal surface, yielding a weaker SERS<br />
intensity. However, the <strong>fluorescence</strong> signal is <strong>enhanced</strong> due<br />
to the lower <strong>fluorescence</strong> quenching <strong>of</strong> fluorophore groups,<br />
which are therefore protected from the aqueous medium<br />
<strong>and</strong> the metal surface quenching effects. This behaviour<br />
is similar to the <strong>fluorescence</strong> change in proteins due to<br />
folding–unfolding processes observed on changing the pH [60].<br />
At pH below 5.0, the <strong>Raman</strong> intensity is remarkably intensified<br />
due to the higher adsorption tendency <strong>of</strong> HA, as<br />
mentioned above, but the <strong>fluorescence</strong> quenching observed<br />
at lower pH is now attributed to the protonation <strong>of</strong> its acidic
74 analytica chimica acta 616 (2008) 69–77<br />
Fig. 8 – (a) Intensity <strong>of</strong> HA 1611 cm −1 <strong>Raman</strong> b<strong>and</strong><br />
measured for the C 30 sample adsorbed on the Ag<br />
nanoaggregates which were selected <strong>and</strong> labelled with<br />
letters in the top optical micrograph (b). Excitation at<br />
514.5 nm.<br />
ate behaviour between CR <strong>and</strong> C 30 samples due to the presence<br />
<strong>of</strong> a high amount <strong>of</strong> aliphatic chains introduced by the residual<br />
fatty acids <strong>of</strong> manures, which may contribute to a further<br />
stabilisation <strong>of</strong> the HS structure through hydrophobic interactions,<br />
as also corroborated in a previous work [63].<br />
3.3. Micro-SEE spectra <strong>of</strong> HA<br />
Fig. 7 – Spectroscopic images obtained by mapping the<br />
intensity <strong>of</strong> the <strong>Raman</strong> 1611 cm −1 b<strong>and</strong> (excitation at<br />
514.5 nm) (b) <strong>and</strong> the <strong>fluorescence</strong> emission (excitation at<br />
514.5 nm <strong>and</strong> emission at 590 nm) (c) from the C 30 sample<br />
adsorbed on the Ag nanoaggregates shown in the optical<br />
image (a).<br />
groups <strong>and</strong> the lower quantum efficiency <strong>of</strong> protonated groups<br />
[8].<br />
Although this is a general behaviour <strong>of</strong> HA, as we have seen<br />
for many HA types, they also display differences, which can be<br />
attributed to the structural changes induced by amendants,<br />
which the <strong>soil</strong> have received for over 30 years. For instance,<br />
the CR <strong>and</strong> C 30 samples show the minimum <strong>and</strong> maximum<br />
variations <strong>of</strong> <strong>fluorescence</strong> <strong>and</strong> <strong>Raman</strong> signals, respectively.<br />
This can be attributed again to the presence <strong>of</strong> a larger number<br />
<strong>of</strong> phenolic groups in CR sample due to the incorporation<br />
<strong>of</strong> lignin derivatives coming from the residual crops used in<br />
the amendment. Several authors have also detected a higher<br />
sensitivity to pH in HS bearing a higher content in phenolic<br />
hydroxyl groups [8,61,62]. CM sample exhibits an intermedi-<br />
Micro-SEE spectra were obtained from Ag nanoaggregates<br />
immobilised on a glass substrate corresponding to the optical<br />
image shown in Fig. 7a. One <strong>of</strong> the distinct advantages <strong>of</strong><br />
micro-<strong>Raman</strong> instruments is the possibility to record images<br />
<strong>and</strong> maps, which enable the distribution <strong>of</strong> a certain species to<br />
be followed by recording the intensity <strong>of</strong> a characteristic b<strong>and</strong>.<br />
The intense b<strong>and</strong> at 1611 cm −1 was used as reference to study<br />
the SERS intensity obtained from different points in the same<br />
metal aggregate onto which the C 30 was adsorbed. Fig. 7b <strong>and</strong><br />
c shows the images obtained by mapping the intensity <strong>of</strong> the<br />
1611 cm −1 <strong>Raman</strong> b<strong>and</strong> <strong>and</strong> the <strong>fluorescence</strong> at 572 nm (with<br />
excitation at 514.5 nm) in 50 m × 50 m areas <strong>of</strong> the aggregate<br />
shown in the optical image <strong>of</strong> Fig. 7a. The spectroscopic<br />
images indicate that both the <strong>Raman</strong> <strong>and</strong> <strong>fluorescence</strong> signals<br />
are greatly <strong>enhanced</strong> in the vicinity <strong>of</strong> the metal aggregate,<br />
thus highlighting the fact that the emission spectra are actually<br />
produced by surface-<strong>enhanced</strong> <strong>Raman</strong> <strong>and</strong> <strong>fluorescence</strong><br />
effects with a negligible contribution from the bulk.<br />
The maps <strong>of</strong> Fig. 7b <strong>and</strong> c indicate that the emission intensity<br />
is higher in the lower part <strong>of</strong> the nanoaggregate. According<br />
to the electromagnetic mechanism <strong>of</strong> LSP-based surface<strong>enhanced</strong><br />
spectroscopy [13–15], the enhancement depends on<br />
the morphology <strong>of</strong> metallic clusters. In addition, the existence
analytica chimica acta 616 (2008) 69–77 75<br />
observed features was interesting to gain an insight into the<br />
adsorption <strong>of</strong> a macromolecular heterogeneous system such<br />
as HA.<br />
Fig. 8a indicates that the <strong>Raman</strong> intensity depends on the<br />
morphology <strong>of</strong> the aggregate studied. The “d” nanoaggregate<br />
was the most efficient at enhancing the <strong>Raman</strong> intensity.<br />
This can be attributed to the more appropriate morphology<br />
for electromagnetic field enhancement on the surface <strong>of</strong> this<br />
aggregate. In contrast, aggregate a yields a very low <strong>Raman</strong><br />
intensity, even if the size is comparable to that <strong>of</strong> the “d”<br />
aggregate. This study affords interesting information to investigate<br />
the influence <strong>of</strong> the Ag nanoaggregate morphology on<br />
the SERS enhancement.<br />
Fig. 9 shows that the spectral pattern undergoes a slight<br />
variability from point to point, which was not observed in<br />
the corresponding macro-SEE spectra. This effect can be<br />
attributed to the intrinsic structural heterogeneity <strong>of</strong> HA,<br />
which can be adsorbed onto the surface through the different<br />
chemical groups existing in their structure.<br />
It is worth noting that the different features detected in<br />
the micro-SERS spectra obtained at the different points indicated<br />
in Fig. 8a precisely matched the b<strong>and</strong>s resulting from<br />
the curve-fitting <strong>of</strong> the macro-SERS spectrum registered in<br />
macro-conditions for the same sample, as indicated in the<br />
upper spectrum <strong>of</strong> Fig. 9 (see the arrows). This fact clearly<br />
indicates that in the surface-<strong>enhanced</strong> <strong>analysis</strong> <strong>of</strong> macromolecular<br />
systems the spectrum obtained in macro is actually<br />
the sum <strong>of</strong> the different spectra, which can be obtained, in<br />
micro-conditions.<br />
4. Conclusions<br />
Fig. 9 – Bottom: micro-SERS spectra <strong>of</strong> the C 30 sample<br />
(excitation at 514.5 nm) measured at the different Ag<br />
nanoaggregates selected in the optical image shown in<br />
Fig. 8b. Top: curve fitted SERS spectrum recorded for the<br />
same sample in macro-conditions.<br />
<strong>of</strong> areas with large SERS enhancements, so-called hot spots,<br />
has also been reported on metallic NPs. Suitable hot spots are<br />
believed to be formed, for example, at a junction between<br />
two metallic nanoparticles [64,65] <strong>and</strong> are highly localised.<br />
Thus it seems that the local morphology <strong>of</strong> the lower aggregate<br />
<strong>of</strong> Fig. 7a is highly favourable to an enhancement <strong>of</strong> the<br />
electromagnetic field, as deduced from the high SEE signal<br />
observed. This is probably due to the existence there <strong>of</strong> hot<br />
spots.<br />
A r<strong>and</strong>om <strong>Raman</strong> mapping was also performed in a region<br />
where different Ag nanoaggregates having different sizes <strong>and</strong><br />
shapes can be found (Fig. 8b). The micro-SERS spectra recorded<br />
for the points labelled with letters in Fig. 8b are represented<br />
in Fig. 9, while the <strong>Raman</strong> intensity <strong>of</strong> the 1611 cm −1 b<strong>and</strong><br />
is plotted in Fig. 8a for all the examined points. The <strong>analysis</strong><br />
<strong>of</strong> the overall <strong>Raman</strong> intensity <strong>and</strong> relative intensity <strong>of</strong> the<br />
SEE is a promising combined <strong>Raman</strong> plus <strong>fluorescence</strong> technique<br />
to be applied in the structural <strong>and</strong> dynamic <strong>analysis</strong> <strong>of</strong><br />
HA. SEE signal is very sensitive to the HA shrinkage, which<br />
in turn may vary with the pH, the concentration <strong>and</strong> the<br />
structural modifications <strong>of</strong> HA induced by different <strong>soil</strong> treatments.<br />
<strong>Raman</strong> <strong>and</strong> <strong>fluorescence</strong> emissions follow an opposite<br />
behaviour due to the effect <strong>of</strong> the metal surface on the groups<br />
responsible for these emissions. This fact can be related to<br />
the different shrinking state <strong>of</strong> the HA structure, which may<br />
vary with the pH or the amendment trials. At high HA concentration<br />
the SEE spectra are dominated by the <strong>fluorescence</strong><br />
emission. However, at low HA concentrations the SERS signal<br />
predominates over the <strong>fluorescence</strong> <strong>and</strong> a limit <strong>of</strong> detection<br />
as low as 1 ppb can be achieved.<br />
The sensitivity <strong>of</strong> SEE is further increased in microspectroscopy.<br />
A very low detection limit can be achieved in<br />
micro-conditions, with the detection <strong>of</strong> few HA molecules<br />
(probably much lower taking into account that HA molecules<br />
placed in hot spots are those contributing to a highest extent<br />
to the overall SEE signal). The micro-SERS spectra show a high<br />
variability from point to point due to the inherent complexity<br />
<strong>of</strong> HA micelles.<br />
The SEE technique has promising applications in the influence<br />
<strong>of</strong> other factors affecting the HA structure such as: origin,<br />
humification rank, <strong>and</strong> interaction with pollutants. Indeed,<br />
this is a work that we are currently doing.
76 analytica chimica acta 616 (2008) 69–77<br />
Acknowledgements<br />
The authors wish to acknowledge grants from the Dirección<br />
General de Investigación, Ministerio de Educación y Ciencia (Project<br />
FIS2004-00108, FIS2007-63065) <strong>and</strong> Comunidad Autonoma de<br />
Madrid (Project MICROSERES-S-0505/TIC-0191). GC acknowledges<br />
a grant from the University <strong>of</strong> Bologna. This research<br />
was also supported with funds provided by (i) University<br />
<strong>of</strong> Bologna (ex quota 60%, 2006). The authors would like<br />
to thank Pr<strong>of</strong>s. Giovanni Toderi <strong>and</strong> Guido Baldoni <strong>and</strong><br />
Dr. Gianni Giordani for kindly providing the historical <strong>soil</strong><br />
samples.<br />
references<br />
[1] K.H. Tan, Humic Matter in Soil <strong>and</strong> the Environment, Marcel<br />
Dekker, New York, 2003.<br />
[2] F.J. Stevenson, Humus Chemistry: Genesis, Composition,<br />
Reactions, 2nd ed., John Wiley & Sons, New York, 1994.<br />
[3] J. Dec, J.M. Bollag, Soil Sci. 162 (1997) 858.<br />
[4] D.L. Sparks, Chemistry <strong>of</strong> Soil Organic Matter in<br />
Environmental Soil Chemistry, 2nd ed., Academic Press,<br />
Elsevier Science, London, 2003, pp. 75–112.<br />
[5] T.M. Miano, N. Senesi, Sci. Total Environ. 117 (1992) 41.<br />
[6] W. Lindberg, J. Person, S. Wold, Anal. Chem. 55 (1983) 643.<br />
[7] F.J. Stevenson, Humus Chemistry: Genesis, Composition,<br />
Reactions, John Wiley & Sons, New York, 1982.<br />
[8] N. Senesi, Anal. Chim. Acta 232 (1990) 77.<br />
[9] K.M. Spark, R.S. Swift, Sci. Total Environ. 152 (1994) 9.<br />
[10] R. Belfatmi, M. Lamotte, S. Ait-Lyazidi, Ph. Fornier de Violet,<br />
Chemosphere 61 (2005) 761.<br />
[11] M. Fuentes, G. González-Gaitano, J.M. García-Mina, Org.<br />
Geochem. 37 (2006) 1949.<br />
[12] A.T. Tu, <strong>Raman</strong> Spectroscopy in Biology: Principle <strong>and</strong><br />
Applications, John Wiley & Sons, New York, 1982.<br />
[13] M. Moskovits, J. <strong>Raman</strong> Spectrosc. 36 (2005) 485.<br />
[14] R. Aroca, <strong>Surface</strong>-Enhanced Vibrational Spectroscopy, John<br />
Wiley & Sons, Chichester, 2006.<br />
[15] M. Moskovits, Rev. Mod. Phys. 57 (1985) 783.<br />
[16] D. Jancura, S. Sanchez-Cortes, E. Kocisova, P. Miskovsky, A.<br />
Tinti, A. Bertoluzza, Biospectroscopy 1 (1995) 265.<br />
[17] O. Francioso, S. Sanchez-Cortes, V. Tugnoli, C. Ciavatta, L.<br />
Sitti, C. Gessa, Appl. Spectrosc. 50 (1996) 1165.<br />
[18] Y.H. Yang, D.H. Zhang, Spectrosc. Lett. 28 (1996) 1203.<br />
[19] E. Vogel, R. Geszner, M.H.B. Hayes, W. Kiefer, J. Mol. Struct.<br />
482 (1999) 195.<br />
[20] S. Sanchez-Cortes, G. Corrado, O.E. Trubetskaya, O.A.<br />
Trubetskoj, B. Hermosin, C. Saiz-Jimenez, Appl. Spectrosc. 60<br />
(2006) 48.<br />
[21] O. Francioso, S. Sanchez-Cortes, V. Tugnoli, C. Marzadori, C.<br />
Ciavatta, J. Mol. Struct. 565 (2001) 481.<br />
[22] O. Francioso, S. Sanchez-Cortes, D. Casarini, J.V.<br />
Garcia-Ramos, C. Ciavatta, C. Gessa, J. Mol. Struct. 609 (2002)<br />
137.<br />
[23] O. Francioso, S. Sanchez-Cortes, G. Corrado, P. Gioacchini, C.<br />
Ciavatta, Spectrosc. Lett. 38 (2005) 291.<br />
[24] O. Francioso, S. Sanchez-Cortes, C. Ciavatta, V. Tugnoli, C.<br />
Gessa, Appl. Spectrosc. 52 (1998) 270.<br />
[25] S. Sanchez-Cortes, O. Francioso, C. Ciavatta, J.V.<br />
Garcia-Ramos, C. Gessa, J. Colloid Interface Sci. 198 (1998)<br />
308.<br />
[26] T. Visser, Infrared spectroscopy in environmental <strong>analysis</strong>,<br />
in: R.A. Meyers (Ed.), Encyclopedia <strong>of</strong> Analytical Chemistry,<br />
John Wiley & Sons, Chichester, 2000.<br />
[27] S. McDonald, A.G. Bishop, P.D. Prenzler, K. Robards, Anal.<br />
Chim. Acta 527 (2004) 105.<br />
[28] L.A. Lyon, C.D. Keating, A.P. Fox, B.E. Baker, L. He, S.R.<br />
Nicewarner, S.P. Mulvaney, M.J. Natan, Anal. Chem. 70 (1998)<br />
341R.<br />
[29] M.M. Carabba, R.B. Edmons, R.D. Rauh, Anal. Chem. 59 (1987)<br />
2559.<br />
[30] J.A. Creighton, The selection rules for surface-<strong>enhanced</strong><br />
<strong>Raman</strong> spectroscopy, in: R.J.H. Clark, R.E. Hester (Eds.),<br />
Spectroscopy <strong>of</strong> <strong>Surface</strong>s, John Wiley & Sons, Chichester,<br />
1988.<br />
[31] E. Koglin, J.M. Sequaris, <strong>Surface</strong> <strong>enhanced</strong> <strong>Raman</strong> scattering<br />
<strong>of</strong> biomolecules, in: H.U. Borgstedt (Ed.), Topics in Current<br />
Chemistry, Springer-Verlag, Berlin, 1986.<br />
[32] D.A. Weitz, S. Gar<strong>of</strong>f, J.I. Gerstein, A. Nitzan, J. Electron<br />
Spectrosc. Relat. Phenom. 29 (1983) 363.<br />
[33] R. Aroca, G.J. Kovacs, C.A. Jennings, R.O. Loutfy, P.S. Vincett,<br />
Langmuir 4 (1988) 518.<br />
[34] K. Sokolov, G. Chumanov, T.M. Cotton, Anal. Chem. 70 (1998)<br />
3898.<br />
[35] J.R. Lakowicz, Anal. Biochem. 298 (2001) 1.<br />
[36] J.R. Lakowicz, C.D. Geddes, I. Gryczynski, J. Malicka, Z.<br />
Gryczynski, K. Aslan, J. Lukomska, E. Matveeva, J. Zhang, R.<br />
Badugu, J. Huang, J. Fluoresc. 14 (2004) 425.<br />
[37] C. Constantino, J. Duff, R. Aroca, Spectrochim. Acta A 57<br />
(2001) 1249.<br />
[38] C.J.L. Constantino, R.F. Aroca, J. <strong>Raman</strong> Spectrosc. 31 (2000)<br />
887.<br />
[39] M. Kawahigashi, H. Sumida, K. Yamamoto, J. Colloid<br />
Interface Sci. 284 (2005) 463.<br />
[40] P.M. Cooke, Anal. Chem. 68 (1996) 333R.<br />
[41] S.C.B. Myneni, J.T. Brown, G.A. Martinez, W. Meyer-Ilse,<br />
Science 286 (1999) 1335.<br />
[42] S. Lee, S. Kim, J. Choo, S.Y. Shin, Y.H. Lee, H.Y. Choi, S. Ha, K.<br />
Kang, Ch.H. Oh, Anal. Chem. 79 (2007) 916.<br />
[43] C. Eliasson, A. Lorén, J. Engelbrektsson, M. Josefson, J.<br />
Abrahamsson, K. Abrahamsson, Spectrochim. Acta A 61<br />
(2005) 755.<br />
[44] M.V. Cañamares, J.V. García-Ramos, J.D. Gómez-Varga, C.<br />
Domingo, S. Sanchez-Cortes, Langmuir 21 (2005)<br />
8546.<br />
[45] F. Negri, E. di Donato, M. Tommasini, C. Castiglioni, G. Zerbi,<br />
J. Chem. Phys. 120 (2004) 11889.<br />
[46] A. Sadezky, H. Muckenhuber, H. Grothe, R. Niessner, U.<br />
Poschl, Carbon 43 (2005) 1751.<br />
[47] R.S. Swift, Soil Sci. 164 (1999) 790.<br />
[48] E. Tombacz, Soil Sci. 164 (1999) 814.<br />
[49] R. Sutton, G. Sposito, Environ. Sci. Technol. 39 (2005)<br />
9009.<br />
[50] E. Illés, E. Tombácz, Colloid Surf. A 230 (2004) 99.<br />
[51] G. Abate, J.C. Masini, Colloid Surf. A 226 (2003) 25.<br />
[52] M. Terashima, M. Fukushima, S. Tanaka, Colloid Surf. A 247<br />
(2004) 77.<br />
[53] J.O. Skjemstad, P. Clarke, J.A. Taylor, J.M. Oades, S.G. McClure,<br />
Aust. J. Soil Res. 34 (1996) 251.<br />
[54] N. Poirier, S. Derenne, J.-N. Rouzaud, C. Largeau, A. Mariotti,<br />
J. Balesdent, J. Maquet, Org. Geochem. 31 (2000) 813.<br />
[55] H. Darmstadt, D. Pantea, L. Sümmchen, U. Rol<strong>and</strong>, S.<br />
Kaliaguine, C.J. Roy, Anal. Appl. Pyrol. 53 (2000) 1.<br />
[56] E. Balnois, K.J. Wilkinson, J.R. Lead, J. Buffle, Environ. Sci.<br />
Technol. 33 (1999) 3911.<br />
[57] R.L. Revia, G.A. Makharadze, Talanta 48 (1999) 409.<br />
[58] T. Itoh, Y. Kikkawa, V. Biju, M. Ishikawa, A. Ikehata, Y. Ozaki,<br />
J. Phys. Chem. B 110 (2006) 21536.<br />
[59] R.A. Saar, J.H. Weber, Anal. Chem. 52 (1980) 2095.<br />
[60] S.K. Grant, I.C. Deckman, J.S. Culp, M.D. Minnich, I.S. Brooks,<br />
P. Hensley, C. Debouck, T.D. Meek, Biochemistry 31 (1992)<br />
9491.
analytica chimica acta 616 (2008) 69–77 77<br />
[61] S.A. Visser, in: R.F. Christman, Gjessing (Eds.), Aquatic <strong>and</strong><br />
Terrestrial Humic Materials, Ann Arbor Science, Ann Arbor,<br />
1983.<br />
[62] U. Müller-Wegener, Chem. Erde 36 (1977) 352.<br />
[63] O. Francioso, C. Ciavatta, S. Sanchez-Cortes, V. Tugnoli, L.<br />
Sitti, C. Gessa, Soil Sci. 165 (2000) 495.<br />
[64] E.C. Le Ru, P.G. Etchegoin, M. Meyer, J. Chem. Phys. 125 (2006)<br />
204701.<br />
[65] M. Käll, H. Xu, P. Johansson, J. <strong>Raman</strong> Spectrosc. 36 (2005)<br />
510.