Surface-enhanced Raman and fluorescence joint analysis of soil ...
Surface-enhanced Raman and fluorescence joint analysis of soil ...
Surface-enhanced Raman and fluorescence joint analysis of soil ...

Create successful ePaper yourself
Turn your PDF publications into a flip-book with our unique Google optimized e-Paper software.
72 analytica chimica acta 616 (2008) 69–77<br />
or natural origins [2,7]. The situation seems to be different<br />
in the case <strong>of</strong> FA, since no PAH b<strong>and</strong>s are observed in these<br />
compounds [24]. The presence <strong>of</strong> PAH in the SERS spectrum<br />
recorded at alkaline pH, suggests that PAH residues might be<br />
mainly localised inside the HA structure, since a HA structure<br />
expansion is expected at high pH due to ionisation <strong>of</strong><br />
carboxylic <strong>and</strong> phenolic groups [47]. Although the macromolecular<br />
expansion is limited by chemical cross-linkages<br />
[48], it seems to be enough to allow a higher exposure <strong>of</strong> the<br />
polyaromatic groups to the metal surface. The b<strong>and</strong>s corresponding<br />
to PAH residues are resonantly <strong>enhanced</strong> as revealed<br />
the appearance <strong>of</strong> the overtone <strong>and</strong> combination b<strong>and</strong>s at<br />
1948, 2577, 2913 <strong>and</strong> 3228 cm −1 in the SERS spectra (Fig. 2).<br />
However, we cannot deduce that PAH groups are quantitatively<br />
predominant in the HA structure, since these groups<br />
undergone a selective enhancement by SERS.<br />
The SERS spectra in Fig. 2 were normalised to the water<br />
b<strong>and</strong> appearing at 3420 cm −1 . As can be seen, the CR <strong>and</strong> CM<br />
samples display a lower SERS intensity in comparison to the<br />
control samples C 0 <strong>and</strong> C 30 . In order to better underst<strong>and</strong> this<br />
behaviour we carried out a more detailed SERS study <strong>of</strong> HA<br />
at different pH values using the C 30 sample (Fig. 3), since this<br />
sample was the one, which displayed the most intense variation.<br />
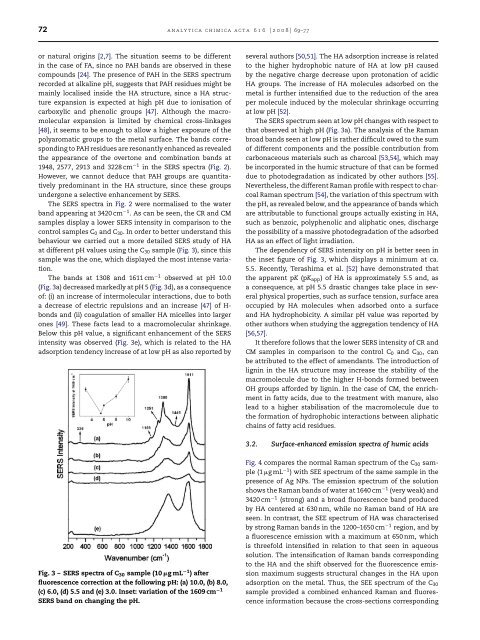
The b<strong>and</strong>s at 1308 <strong>and</strong> 1611 cm −1 observed at pH 10.0<br />
(Fig. 3a) decreased markedly at pH 5 (Fig. 3d), as a consequence<br />
<strong>of</strong>: (i) an increase <strong>of</strong> intermolecular interactions, due to both<br />
a decrease <strong>of</strong> electric repulsions <strong>and</strong> an increase [47] <strong>of</strong> H-<br />
bonds <strong>and</strong> (ii) coagulation <strong>of</strong> smaller HA micelles into larger<br />
ones [49]. These facts lead to a macromolecular shrinkage.<br />
Below this pH value, a significant enhancement <strong>of</strong> the SERS<br />
intensity was observed (Fig. 3e), which is related to the HA<br />
adsorption tendency increase <strong>of</strong> at low pH as also reported by<br />
several authors [50,51]. The HA adsorption increase is related<br />
to the higher hydrophobic nature <strong>of</strong> HA at low pH caused<br />
by the negative charge decrease upon protonation <strong>of</strong> acidic<br />
HA groups. The increase <strong>of</strong> HA molecules adsorbed on the<br />
metal is further intensified due to the reduction <strong>of</strong> the area<br />
per molecule induced by the molecular shrinkage occurring<br />
at low pH [52].<br />
The SERS spectrum seen at low pH changes with respect to<br />
that observed at high pH (Fig. 3a). The <strong>analysis</strong> <strong>of</strong> the <strong>Raman</strong><br />
broad b<strong>and</strong>s seen at low pH is rather difficult owed to the sum<br />
<strong>of</strong> different components <strong>and</strong> the possible contribution from<br />
carbonaceous materials such as charcoal [53,54], which may<br />
be incorporated in the humic structure <strong>of</strong> that can be formed<br />
due to photodegradation as indicated by other authors [55].<br />
Nevertheless, the different <strong>Raman</strong> pr<strong>of</strong>ile with respect to charcoal<br />
<strong>Raman</strong> spectrum [54], the variation <strong>of</strong> this spectrum with<br />
the pH, as revealed below, <strong>and</strong> the appearance <strong>of</strong> b<strong>and</strong>s which<br />
are attributable to functional groups actually existing in HA,<br />
such as benzoic, polyphenolic <strong>and</strong> aliphatic ones, discharge<br />
the possibility <strong>of</strong> a massive photodegradation <strong>of</strong> the adsorbed<br />
HA as an effect <strong>of</strong> light irradiation.<br />
The dependency <strong>of</strong> SERS intensity on pH is better seen in<br />
the inset figure <strong>of</strong> Fig. 3, which displays a minimum at ca.<br />
5.5. Recently, Terashima et al. [52] have demonstrated that<br />
the apparent pK (pK app ) <strong>of</strong> HA is approximately 5.5 <strong>and</strong>, as<br />
a consequence, at pH 5.5 drastic changes take place in several<br />
physical properties, such as surface tension, surface area<br />
occupied by HA molecules when adsorbed onto a surface<br />
<strong>and</strong> HA hydrophobicity. A similar pH value was reported by<br />
other authors when studying the aggregation tendency <strong>of</strong> HA<br />
[56,57].<br />
It therefore follows that the lower SERS intensity <strong>of</strong> CR <strong>and</strong><br />
CM samples in comparison to the control C 0 <strong>and</strong> C 30 , can<br />
be attributed to the effect <strong>of</strong> amendants. The introduction <strong>of</strong><br />
lignin in the HA structure may increase the stability <strong>of</strong> the<br />
macromolecule due to the higher H-bonds formed between<br />
OH groups afforded by lignin. In the case <strong>of</strong> CM, the enrichment<br />
in fatty acids, due to the treatment with manure, also<br />
lead to a higher stabilisation <strong>of</strong> the macromolecule due to<br />
the formation <strong>of</strong> hydrophobic interactions between aliphatic<br />
chains <strong>of</strong> fatty acid residues.<br />
3.2. <strong>Surface</strong>-<strong>enhanced</strong> emission spectra <strong>of</strong> humic acids<br />
Fig. 3 – SERS spectra <strong>of</strong> C 30 sample (10 gmL −1 ) after<br />
<strong>fluorescence</strong> correction at the following pH: (a) 10.0, (b) 8.0,<br />
(c) 6.0, (d) 5.5 <strong>and</strong> (e) 3.0. Inset: variation <strong>of</strong> the 1609 cm −1<br />
SERS b<strong>and</strong> on changing the pH.<br />
Fig. 4 compares the normal <strong>Raman</strong> spectrum <strong>of</strong> the C 30 sample<br />
(1 gmL −1 ) with SEE spectrum <strong>of</strong> the same sample in the<br />
presence <strong>of</strong> Ag NPs. The emission spectrum <strong>of</strong> the solution<br />
shows the <strong>Raman</strong> b<strong>and</strong>s <strong>of</strong> water at 1640 cm −1 (very weak) <strong>and</strong><br />
3420 cm −1 (strong) <strong>and</strong> a broad <strong>fluorescence</strong> b<strong>and</strong> produced<br />
by HA centered at 630 nm, while no <strong>Raman</strong> b<strong>and</strong> <strong>of</strong> HA are<br />
seen. In contrast, the SEE spectrum <strong>of</strong> HA was characterised<br />
by strong <strong>Raman</strong> b<strong>and</strong>s in the 1200–1650 cm −1 region, <strong>and</strong> by<br />
a <strong>fluorescence</strong> emission with a maximum at 650 nm, which<br />
is threefold intensified in relation to that seen in aqueous<br />
solution. The intensification <strong>of</strong> <strong>Raman</strong> b<strong>and</strong>s corresponding<br />
to the HA <strong>and</strong> the shift observed for the <strong>fluorescence</strong> emission<br />
maximum suggests structural changes in the HA upon<br />
adsorption on the metal. Thus, the SEE spectrum <strong>of</strong> the C 30<br />
sample provided a combined <strong>enhanced</strong> <strong>Raman</strong> <strong>and</strong> <strong>fluorescence</strong><br />
information because the cross-sections corresponding