Surface-enhanced Raman and fluorescence joint analysis of soil ...
Surface-enhanced Raman and fluorescence joint analysis of soil ...
Surface-enhanced Raman and fluorescence joint analysis of soil ...

Create successful ePaper yourself
Turn your PDF publications into a flip-book with our unique Google optimized e-Paper software.
analytica chimica acta 616 (2008) 69–77 71<br />
i.e. on the aggregation process undergone by these macromolecules,<br />
which are <strong>of</strong> importance to underst<strong>and</strong> how these<br />
compounds are attached on the inorganic matrices existing<br />
in <strong>soil</strong>s. This fact represented an evident advantage regarding<br />
the normal <strong>fluorescence</strong> spectra obtained in solution.<br />
Spectroscopic imaging <strong>and</strong> micro-confocal techniques<br />
have been developed for both <strong>Raman</strong> <strong>and</strong> <strong>fluorescence</strong> spectroscopy<br />
with promising analytical applications [40], <strong>and</strong><br />
could also be <strong>of</strong> interest in the study <strong>of</strong> HA, as demonstrated by<br />
previous studies [41]. The combination <strong>of</strong> surface-<strong>enhanced</strong><br />
techniques <strong>and</strong> microscopy is also a powerful methodology<br />
which has attracted much attention in the <strong>analysis</strong> <strong>of</strong> biological<br />
systems such as cells or bacteria [42,43] <strong>and</strong> which could<br />
be very helpful in the characterisation <strong>of</strong> HS.<br />
In this work we analysed SEE spectra <strong>of</strong> HA. This work<br />
represents the first time that SEF technique is used in the characterisation<br />
<strong>of</strong> HA. The HA compounds selected for this study<br />
were extracted from a <strong>soil</strong> amended over a period <strong>of</strong> 30 years<br />
under several conditions <strong>and</strong> the corresponding control experiments<br />
in order to evaluate the structural variations induced<br />
by the different treatments. The SEE spectra were acquired by<br />
using both macro- <strong>and</strong> micro-experimental configurations in<br />
order to investigate the abilities <strong>of</strong> the new imaging <strong>and</strong> confocal<br />
<strong>Raman</strong> <strong>and</strong> <strong>fluorescence</strong> spectroscopy techniques on the<br />
<strong>analysis</strong> <strong>of</strong> these HA.<br />
2. Materials <strong>and</strong> methods<br />
The <strong>soil</strong> samples analysed (horizon Ap, 0–40 cm depth) were<br />
taken from plots <strong>of</strong> a 30 plus year field experiment conducted<br />
at the agricultural farm <strong>of</strong> the University <strong>of</strong> Bologna’s Agricultural<br />
Faculty (Cadriano, Italy). This <strong>soil</strong> is classified (Soil Survey<br />
Staff, USDA SCS 1989) as a Typic Udochrept.<br />
The experimental design included plots amended over a<br />
30-year period with cattle manure (CM) <strong>and</strong> crop residues (CR)<br />
constituted by wheat straw or corn stalks (each biomass followed<br />
in succession), with unamended <strong>soil</strong> as control (C). CM<br />
was added to the plots at the following rate: 6 t ha −1 <strong>of</strong> dry matter<br />
after wheat tillage <strong>and</strong> 7.5 t ha −1 <strong>of</strong> dry matter after corn<br />
tillage. All the plots examined, including C, were fertilised with<br />
100 kg N ha −1 yr −1 added in the form <strong>of</strong> ammonium nitrate.<br />
Each treatment (CM, CR <strong>and</strong> C) was conducted in triplicate<br />
using a r<strong>and</strong>omized block design.<br />
Analyses were carried out on <strong>soil</strong> samples taken from:<br />
(i) unamended <strong>soil</strong> in 1972 (C 0 ), <strong>and</strong> (ii) after 30 years (C 30 )<br />
<strong>and</strong> (iii) after a 30-year amendment period with CM <strong>and</strong> CR.<br />
The extraction procedures used to isolate these samples have<br />
already been described in Ref. [23].<br />
to enhance the electromagnetic field on the metal surface. A<br />
typical Ag MNs used to record the SEE spectra is shown in Fig. 1<br />
(bottom).<br />
Samples for SEE measurements were made by adding an<br />
aliquot <strong>of</strong> an aqueous HS solution, prepared by solving 1 mg <strong>of</strong><br />
the corresponding humic fraction in 1 mL <strong>of</strong> tri-distilled water,<br />
to 1 mL <strong>of</strong> the silver colloid until the desired concentration.<br />
The pH <strong>of</strong> the mixture was adjusted by adding 0.1 M NaOH or<br />
HNO 3 . All solutions were prepared with tri-distilled water.<br />
The SERS spectra were recorded by means <strong>of</strong> a Renishaw<br />
<strong>Raman</strong> Microscope System RM2000, using the macroconfiguration<br />
equipped with a notch filter <strong>and</strong> an electrically<br />
refrigerated CCD camera (575× pixels) as indicated in Fig. 1.<br />
The <strong>Raman</strong> <strong>and</strong> <strong>fluorescence</strong> emission spectrum is recorded<br />
by the CCD camera. The 514.5 nm line <strong>of</strong> an Ar + laser was used.<br />
The laser power at the sample was 2.0 mW. Spectral resolution<br />
was 2 cm −1 . Micro-SERS spectra were obtained by using a 100×<br />
objective (NA = 0.9). Confocal micro-SERS <strong>and</strong> <strong>Raman</strong> images<br />
were recorded by using a PRIOR motorised stage coupled to the<br />
microscope with a 1 m step. The SERS spectra were baselined<br />
to withdraw the contribution <strong>of</strong> the <strong>fluorescence</strong> by using the<br />
algorithm provided by the Origin 6.0 Program.<br />
3. Results <strong>and</strong> discussion<br />
3.1. SERS spectra <strong>of</strong> humic acids<br />
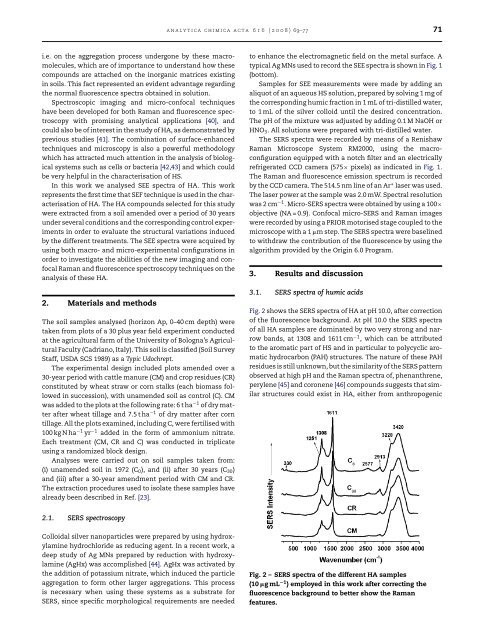
Fig. 2 shows the SERS spectra <strong>of</strong> HA at pH 10.0, after correction<br />
<strong>of</strong> the <strong>fluorescence</strong> background. At pH 10.0 the SERS spectra<br />
<strong>of</strong> all HA samples are dominated by two very strong <strong>and</strong> narrow<br />
b<strong>and</strong>s, at 1308 <strong>and</strong> 1611 cm −1 , which can be attributed<br />
to the aromatic part <strong>of</strong> HS <strong>and</strong> in particular to polycyclic aromatic<br />
hydrocarbon (PAH) structures. The nature <strong>of</strong> these PAH<br />
residues is still unknown, but the similarity <strong>of</strong> the SERS pattern<br />
observed at high pH <strong>and</strong> the <strong>Raman</strong> spectra <strong>of</strong>, phenanthrene,<br />
perylene [45] <strong>and</strong> coronene [46] compounds suggests that similar<br />
structures could exist in HA, either from anthropogenic<br />
2.1. SERS spectroscopy<br />
Colloidal silver nanoparticles were prepared by using hydroxylamine<br />
hydrochloride as reducing agent. In a recent work, a<br />
deep study <strong>of</strong> Ag MNs prepared by reduction with hydroxylamine<br />
(AgHx) was accomplished [44]. AgHx was activated by<br />
the addition <strong>of</strong> potassium nitrate, which induced the particle<br />
aggregation to form other larger aggregations. This process<br />
is necessary when using these systems as a substrate for<br />
SERS, since specific morphological requirements are needed<br />
Fig. 2 – SERS spectra <strong>of</strong> the different HA samples<br />
(10 gmL −1 ) employed in this work after correcting the<br />
<strong>fluorescence</strong> background to better show the <strong>Raman</strong><br />
features.