Surface-enhanced Raman and fluorescence joint analysis of soil ...
Surface-enhanced Raman and fluorescence joint analysis of soil ...
Surface-enhanced Raman and fluorescence joint analysis of soil ...

You also want an ePaper? Increase the reach of your titles
YUMPU automatically turns print PDFs into web optimized ePapers that Google loves.
analytica chimica acta 616 (2008) 69–77 75<br />
observed features was interesting to gain an insight into the<br />
adsorption <strong>of</strong> a macromolecular heterogeneous system such<br />
as HA.<br />
Fig. 8a indicates that the <strong>Raman</strong> intensity depends on the<br />
morphology <strong>of</strong> the aggregate studied. The “d” nanoaggregate<br />
was the most efficient at enhancing the <strong>Raman</strong> intensity.<br />
This can be attributed to the more appropriate morphology<br />
for electromagnetic field enhancement on the surface <strong>of</strong> this<br />
aggregate. In contrast, aggregate a yields a very low <strong>Raman</strong><br />
intensity, even if the size is comparable to that <strong>of</strong> the “d”<br />
aggregate. This study affords interesting information to investigate<br />
the influence <strong>of</strong> the Ag nanoaggregate morphology on<br />
the SERS enhancement.<br />
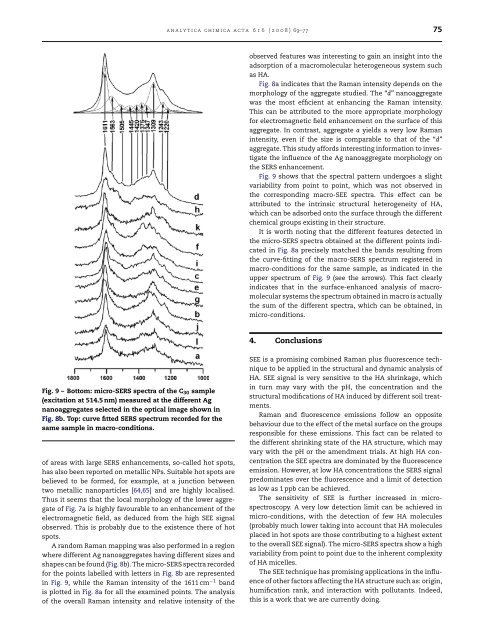
Fig. 9 shows that the spectral pattern undergoes a slight<br />
variability from point to point, which was not observed in<br />
the corresponding macro-SEE spectra. This effect can be<br />
attributed to the intrinsic structural heterogeneity <strong>of</strong> HA,<br />
which can be adsorbed onto the surface through the different<br />
chemical groups existing in their structure.<br />
It is worth noting that the different features detected in<br />
the micro-SERS spectra obtained at the different points indicated<br />
in Fig. 8a precisely matched the b<strong>and</strong>s resulting from<br />
the curve-fitting <strong>of</strong> the macro-SERS spectrum registered in<br />
macro-conditions for the same sample, as indicated in the<br />
upper spectrum <strong>of</strong> Fig. 9 (see the arrows). This fact clearly<br />
indicates that in the surface-<strong>enhanced</strong> <strong>analysis</strong> <strong>of</strong> macromolecular<br />
systems the spectrum obtained in macro is actually<br />
the sum <strong>of</strong> the different spectra, which can be obtained, in<br />
micro-conditions.<br />
4. Conclusions<br />
Fig. 9 – Bottom: micro-SERS spectra <strong>of</strong> the C 30 sample<br />
(excitation at 514.5 nm) measured at the different Ag<br />
nanoaggregates selected in the optical image shown in<br />
Fig. 8b. Top: curve fitted SERS spectrum recorded for the<br />
same sample in macro-conditions.<br />
<strong>of</strong> areas with large SERS enhancements, so-called hot spots,<br />
has also been reported on metallic NPs. Suitable hot spots are<br />
believed to be formed, for example, at a junction between<br />
two metallic nanoparticles [64,65] <strong>and</strong> are highly localised.<br />
Thus it seems that the local morphology <strong>of</strong> the lower aggregate<br />
<strong>of</strong> Fig. 7a is highly favourable to an enhancement <strong>of</strong> the<br />
electromagnetic field, as deduced from the high SEE signal<br />
observed. This is probably due to the existence there <strong>of</strong> hot<br />
spots.<br />
A r<strong>and</strong>om <strong>Raman</strong> mapping was also performed in a region<br />
where different Ag nanoaggregates having different sizes <strong>and</strong><br />
shapes can be found (Fig. 8b). The micro-SERS spectra recorded<br />
for the points labelled with letters in Fig. 8b are represented<br />
in Fig. 9, while the <strong>Raman</strong> intensity <strong>of</strong> the 1611 cm −1 b<strong>and</strong><br />
is plotted in Fig. 8a for all the examined points. The <strong>analysis</strong><br />
<strong>of</strong> the overall <strong>Raman</strong> intensity <strong>and</strong> relative intensity <strong>of</strong> the<br />
SEE is a promising combined <strong>Raman</strong> plus <strong>fluorescence</strong> technique<br />
to be applied in the structural <strong>and</strong> dynamic <strong>analysis</strong> <strong>of</strong><br />
HA. SEE signal is very sensitive to the HA shrinkage, which<br />
in turn may vary with the pH, the concentration <strong>and</strong> the<br />
structural modifications <strong>of</strong> HA induced by different <strong>soil</strong> treatments.<br />
<strong>Raman</strong> <strong>and</strong> <strong>fluorescence</strong> emissions follow an opposite<br />
behaviour due to the effect <strong>of</strong> the metal surface on the groups<br />
responsible for these emissions. This fact can be related to<br />
the different shrinking state <strong>of</strong> the HA structure, which may<br />
vary with the pH or the amendment trials. At high HA concentration<br />
the SEE spectra are dominated by the <strong>fluorescence</strong><br />
emission. However, at low HA concentrations the SERS signal<br />
predominates over the <strong>fluorescence</strong> <strong>and</strong> a limit <strong>of</strong> detection<br />
as low as 1 ppb can be achieved.<br />
The sensitivity <strong>of</strong> SEE is further increased in microspectroscopy.<br />
A very low detection limit can be achieved in<br />
micro-conditions, with the detection <strong>of</strong> few HA molecules<br />
(probably much lower taking into account that HA molecules<br />
placed in hot spots are those contributing to a highest extent<br />
to the overall SEE signal). The micro-SERS spectra show a high<br />
variability from point to point due to the inherent complexity<br />
<strong>of</strong> HA micelles.<br />
The SEE technique has promising applications in the influence<br />
<strong>of</strong> other factors affecting the HA structure such as: origin,<br />
humification rank, <strong>and</strong> interaction with pollutants. Indeed,<br />
this is a work that we are currently doing.