Sensory and objective mutton quality characteristics of SA - African ...
Sensory and objective mutton quality characteristics of SA - African ...
Sensory and objective mutton quality characteristics of SA - African ...

Create successful ePaper yourself
Turn your PDF publications into a flip-book with our unique Google optimized e-Paper software.
South <strong>African</strong> Journal <strong>of</strong> Animal Science 2003, 33 (1)<br />
© South <strong>African</strong> Society for Animal Science<br />
52<br />
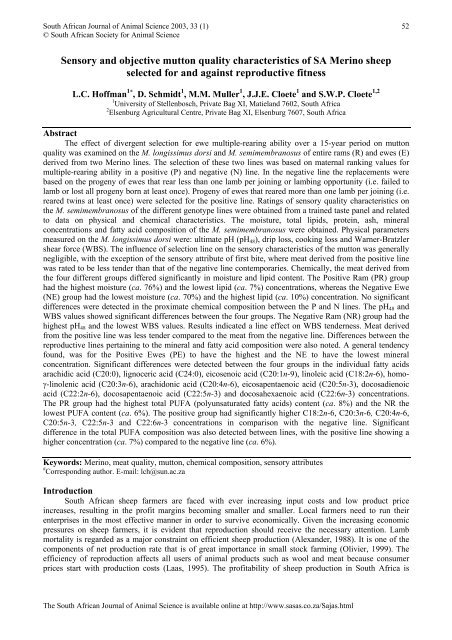
<strong>Sensory</strong> <strong>and</strong> <strong>objective</strong> <strong>mutton</strong> <strong>quality</strong> <strong>characteristics</strong> <strong>of</strong> <strong>SA</strong> Merino sheep<br />
selected for <strong>and</strong> against reproductive fitness<br />
L.C. H<strong>of</strong>fman 1∗ , D. Schmidt 1 , M.M. Muller 1 , J.J.E. Cloete 1 <strong>and</strong> S.W.P. Cloete 1,2<br />
1 University <strong>of</strong> Stellenbosch, Private Bag XI, Matiel<strong>and</strong> 7602, South Africa<br />
2 Elsenburg Agricultural Centre, Private Bag XI, Elsenburg 7607, South Africa<br />
Abstract<br />
The effect <strong>of</strong> divergent selection for ewe multiple-rearing ability over a 15-year period on <strong>mutton</strong><br />
<strong>quality</strong> was examined on the M. longissimus dorsi <strong>and</strong> M. semimembranosus <strong>of</strong> entire rams (R) <strong>and</strong> ewes (E)<br />
derived from two Merino lines. The selection <strong>of</strong> these two lines was based on maternal ranking values for<br />
multiple-rearing ability in a positive (P) <strong>and</strong> negative (N) line. In the negative line the replacements were<br />
based on the progeny <strong>of</strong> ewes that rear less than one lamb per joining or lambing opportunity (i.e. failed to<br />
lamb or lost all progeny born at least once). Progeny <strong>of</strong> ewes that reared more than one lamb per joining (i.e.<br />
reared twins at least once) were selected for the positive line. Ratings <strong>of</strong> sensory <strong>quality</strong> <strong>characteristics</strong> on<br />
the M. semimembranosus <strong>of</strong> the different genotype lines were obtained from a trained taste panel <strong>and</strong> related<br />
to data on physical <strong>and</strong> chemical <strong>characteristics</strong>. The moisture, total lipids, protein, ash, mineral<br />
concentrations <strong>and</strong> fatty acid composition <strong>of</strong> the M. semimembranosus were obtained. Physical parameters<br />
measured on the M. longissimus dorsi were: ultimate pH (pH 48 ), drip loss, cooking loss <strong>and</strong> Warner-Bratzler<br />
shear force (WBS). The influence <strong>of</strong> selection line on the sensory <strong>characteristics</strong> <strong>of</strong> the <strong>mutton</strong> was generally<br />
negligible, with the exception <strong>of</strong> the sensory attribute <strong>of</strong> first bite, where meat derived from the positive line<br />
was rated to be less tender than that <strong>of</strong> the negative line contemporaries. Chemically, the meat derived from<br />
the four different groups differed significantly in moisture <strong>and</strong> lipid content. The Positive Ram (PR) group<br />
had the highest moisture (ca. 76%) <strong>and</strong> the lowest lipid (ca. 7%) concentrations, whereas the Negative Ewe<br />
(NE) group had the lowest moisture (ca. 70%) <strong>and</strong> the highest lipid (ca. 10%) concentration. No significant<br />
differences were detected in the proximate chemical composition between the P <strong>and</strong> N lines. The pH 48 <strong>and</strong><br />
WBS values showed significant differences between the four groups. The Negative Ram (NR) group had the<br />
highest pH 48 <strong>and</strong> the lowest WBS values. Results indicated a line effect on WBS tenderness. Meat derived<br />
from the positive line was less tender compared to the meat from the negative line. Differences between the<br />
reproductive lines pertaining to the mineral <strong>and</strong> fatty acid composition were also noted. A general tendency<br />
found, was for the Positive Ewes (PE) to have the highest <strong>and</strong> the NE to have the lowest mineral<br />
concentration. Significant differences were detected between the four groups in the individual fatty acids<br />
arachidic acid (C20:0), lignoceric acid (C24:0), eicosenoic acid (C20:1n-9), linoleic acid (C18:2n-6), homoγ-linolenic<br />
acid (C20:3n-6), arachidonic acid (C20:4n-6), eicosapentaenoic acid (C20:5n-3), docosadienoic<br />
acid (C22:2n-6), docosapentaenoic acid (C22:5n-3) <strong>and</strong> docosahexaenoic acid (C22:6n-3) concentrations.<br />
The PR group had the highest total PUFA (polyunsaturated fatty acids) content (ca. 8%) <strong>and</strong> the NR the<br />
lowest PUFA content (ca. 6%). The positive group had significantly higher C18:2n-6, C20:3n-6, C20:4n-6,<br />
C20:5n-3, C22:5n-3 <strong>and</strong> C22:6n-3 concentrations in comparison with the negative line. Significant<br />
difference in the total PUFA composition was also detected between lines, with the positive line showing a<br />
higher concentration (ca. 7%) compared to the negative line (ca. 6%).<br />
Keywords: Merino, meat <strong>quality</strong>, <strong>mutton</strong>, chemical composition, sensory attributes<br />
# Corresponding author. E-mail: lch@sun.ac.za<br />
Introduction<br />
South <strong>African</strong> sheep farmers are faced with ever increasing input costs <strong>and</strong> low product price<br />
increases, resulting in the pr<strong>of</strong>it margins becoming smaller <strong>and</strong> smaller. Local farmers need to run their<br />
enterprises in the most effective manner in order to survive economically. Given the increasing economic<br />
pressures on sheep farmers, it is evident that reproduction should receive the necessary attention. Lamb<br />
mortality is regarded as a major constraint on efficient sheep production (Alex<strong>and</strong>er, 1988). It is one <strong>of</strong> the<br />
components <strong>of</strong> net production rate that is <strong>of</strong> great importance in small stock farming (Olivier, 1999). The<br />
efficiency <strong>of</strong> reproduction affects all users <strong>of</strong> animal products such as wool <strong>and</strong> meat because consumer<br />
prices start with production costs (Laas, 1995). The pr<strong>of</strong>itability <strong>of</strong> sheep production in South Africa is<br />
The South <strong>African</strong> Journal <strong>of</strong> Animal Science is available online at http://www.sasas.co.za/Sajas.html
South <strong>African</strong> Journal <strong>of</strong> Animal Science 2003, 33 (1)<br />
© South <strong>African</strong> Society for Animal Science<br />
53<br />
largely influenced by net reproduction rate, defined as total weight <strong>of</strong> lamb weaned per ewe joined (Olivier,<br />
1999). Against this background Cloete (1999) undertook an investigation on the divergent selection <strong>of</strong> South<br />
<strong>African</strong> Merino sheep for multiple-rearing ability. The experiment demonstrated that selection <strong>of</strong> sheep for<br />
multiple-rearing ability was a viable method for improving lamb production without serious negative<br />
correlated responses on qualitative <strong>and</strong> quantitative production traits in progeny (Cloete & Olivier, 1998).<br />
When retained for breeding purposes, the lower producing negative line had a higher average live weight as<br />
well as a higher average wool weight when joined at 5.5 years <strong>of</strong> age than the positive line contemporaries.<br />
Stress placed on the positive line ewes by pregnancy <strong>and</strong> lactation possibly played a role in this regard<br />
(Cloete, 1999). However, despite the apparent importance <strong>of</strong> reproductiveness on aspects such as live weight<br />
<strong>and</strong> fleece weight, little is known about the consequences <strong>of</strong> reproductive fitness on the <strong>quality</strong> <strong>of</strong> <strong>mutton</strong> in<br />
progeny.<br />
The pre-eminent question in this investigation is to what extent does reproduction fitness influence<br />
<strong>mutton</strong> <strong>quality</strong>. This investigation reports on the differences in sensory attributes, proximate chemical<br />
composition, fatty acid <strong>and</strong> mineral composition between the two lines <strong>of</strong> South <strong>African</strong> Merino sheep.<br />
Muscle pH, cooking loss <strong>and</strong> drip loss <strong>and</strong> Warner-Bratzler shear force (WBS) were also determined.<br />
Materials <strong>and</strong> methods<br />
Since 1986 two lines <strong>of</strong> South <strong>African</strong> Merino sheep have been divergently selected for <strong>and</strong> against<br />
multiple-rearing ability from the same base population at the Tygerhoek Experimental Farm. Selection <strong>of</strong><br />
ewe <strong>and</strong> ram replacements were based on maternal ranking values for multiple-rearing ability in a positive<br />
(P) <strong>and</strong> negative (N) line (Cloete & Dur<strong>and</strong>, 1994; Cloete & Scholtz, 1998). In the negative line progeny <strong>of</strong><br />
ewes that rear less than one lamb per joining or lambing opportunity (i.e. failed to lamb or lost all progeny<br />
born at least once) were preferred as replacements. Progeny <strong>of</strong> ewes that reared more than one lamb per<br />
joining (i.e. reared twins at least once) were preferably selected as replacements in the positive line. At the<br />
end <strong>of</strong> 1992 both lines were transferred to Elsenburg experimental farm for detailed data collection on lamb<br />
mortality, lambing <strong>and</strong> neonatal behaviour, lamb production, weight <strong>and</strong> wool traits (Cloete & Scholtz,<br />
1998).<br />
In this investigation 10 mature animals (equal sex ratio) from the positive <strong>and</strong> 10 from the negative<br />
reproduction lines (<strong>of</strong> the 5th generation) were r<strong>and</strong>omly selected to test for the effect <strong>of</strong> reproductiveness<br />
<strong>and</strong> sex on the physico-chemical <strong>and</strong> sensory <strong>characteristics</strong> <strong>of</strong> the <strong>mutton</strong>. The animals from both lines<br />
originated from similar environments, although the rams <strong>and</strong> ewes were kept apart to avoid casual mating.<br />
The animals grazed on adjacent wheat stubble fields that were rotated regularly. The sheep were grown to<br />
commercial slaughter weight <strong>and</strong> slaughtered, using st<strong>and</strong>ard South <strong>African</strong> techniques <strong>and</strong> conditions. The<br />
mean live weights for the positive line were 44.7 kg (n = 10) <strong>and</strong> for the negative line 42.0 kg (n = 10). No<br />
electrical stimulation was applied. During the first 48 h post-mortem, the carcasses were chilled at a<br />
temperature <strong>of</strong> 5 °C. Ultimate pH was measured 48 h post-mortem (pH 48 ) with a penetrating glass electrode<br />
on a h<strong>and</strong>-held Crison pH/mV-506 meter. The pH meter was re-calibrated after every fourth reading <strong>and</strong> the<br />
electrode rinsed with distilled water between each measurement. The pH meter contained a temperature<br />
probe ensuring automatic adjustment <strong>of</strong> the pH for temperature. The measurement was taken between the 2 nd<br />
<strong>and</strong> 3 rd last thoracic vertebrae, 45 mm from the midline. The M. longissimus dorsi was removed from the<br />
carcass to assess drip loss, cooking loss, shear force <strong>and</strong> pH 48 . The legs were removed from the carcasses at a<br />
position between the last lumbar <strong>and</strong> the first sacral vertebrae. The legs were labelled, vacuum packed,<br />
frozen <strong>and</strong> stored at –18 °C until further use. After thawing, the M. semimembranosus from both the legs<br />
were dissected <strong>and</strong> used for sensory, proximate, mineral <strong>and</strong> fatty acid analyses.<br />
The right legs were defrosted at a temperature <strong>of</strong> 3 – 4 °C for a period <strong>of</strong> 48 h for the purpose <strong>of</strong><br />
deboning <strong>and</strong> the removal <strong>of</strong> the M. semimembranosus. The legs were placed on a flat surface with the<br />
lateral side facing upwards. An incision was made on the septa, followed by an incision <strong>of</strong> the knife at the<br />
top end <strong>and</strong> cutting as close as possible to the pelvic bone. The natural division between muscles then<br />
became visible <strong>and</strong> the M. semimembranosus could then be separated from the other muscles by cutting<br />
between the muscles. The M. semimembranosus cuts were coded, vacuum packed, re-frozen <strong>and</strong> stored at<br />
–18 °C until further analysis. M. semimembranosus samples were oven-roasted prior to subsequent sensory<br />
analysis. The meat cuts were defrosted for 48 h at a temperature <strong>of</strong> 3 – 4 °C, wrapped individually in cooking<br />
bags <strong>and</strong> placed fat-side up on the rack <strong>of</strong> an open roasting pan. The samples were roasted at 160 °C in two<br />
conventional electric Defy 835 ovens connected to a computerised electronic temperature control system<br />
The South <strong>African</strong> Journal <strong>of</strong> Animal Science is available online at http://www.sasas.co.za/Sajas.html
South <strong>African</strong> Journal <strong>of</strong> Animal Science 2003, 33 (1)<br />
© South <strong>African</strong> Society for Animal Science<br />
54<br />
(Viljoen et al., 2001). A thermocouple was inserted in the centre <strong>of</strong> each sample <strong>and</strong> the meat was roasted to<br />
an internal temperature <strong>of</strong> 70 °C (AM<strong>SA</strong>, 1978). Immediately after cooking all visible subcutaneous fat was<br />
removed from each sample. Six 1.5 cm x 1.5 cm cubed samples were taken from the middle <strong>of</strong> each sample<br />
<strong>and</strong> wrapped immediately in aluminium foil marked with r<strong>and</strong>om three digit codes. The samples were placed<br />
in preheated glass ramekins in a preheated oven <strong>of</strong> 100 °C <strong>and</strong> evaluated within 10 min by the panellists.<br />
Descriptive sensory analyses were performed on the meat samples. Panellists were selected <strong>and</strong> trained in<br />
accordance with the American Meat Science Association guidelines for the sensory evaluation <strong>of</strong> meat<br />
(AM<strong>SA</strong>, 1978). A six-member panel evaluated the meat for the following sensory attributes: aroma intensity,<br />
initial impression <strong>of</strong> juiciness, sustained juiciness, tenderness, residue <strong>and</strong> overall lamb flavour by means <strong>of</strong><br />
an eight-point structured line scale. Table 1 depicts the definitions <strong>of</strong> the attributes used in the sensory<br />
analyses. The panellists were seated in individual booths in a temperature <strong>and</strong> light controlled room,<br />
receiving a set <strong>of</strong> four samples served in a complete r<strong>and</strong>omised order. Crackers <strong>and</strong> distilled water were<br />
used to cleanse the palate between samples (AM<strong>SA</strong>, 1978).<br />
Table 1: Definition <strong>of</strong> attributes for sensory analyses <strong>of</strong> <strong>mutton</strong><br />
Attribute<br />
Lamb aroma<br />
1 = Extremely bl<strong>and</strong>; 8 = Extremely intense<br />
Initial juiciness<br />
1 = Extremely dry; 8 = Extremely juicy<br />
Sustained juiciness<br />
1 = Extremely dry; 8 = Extremely juicy<br />
First bite<br />
1 = Extremely tough; 8 = Extremely tender<br />
Residue<br />
1 = Abundant; 8 = None<br />
Lamb flavour<br />
1 = Extremely bl<strong>and</strong>; 8 = Extremely intense<br />
Definition<br />
Aroma associated with the animal species<br />
The amount <strong>of</strong> fluid exuded on the cut surface<br />
when pressed between fingers<br />
Degree/amount <strong>of</strong> water perceived during<br />
mastication<br />
Force needed to compress the sample <strong>of</strong> meat<br />
between molar teeth on the first bite<br />
The connective tissue remaining after most <strong>of</strong> the<br />
sample has been masticated<br />
Flavour associated with the animal species<br />
Proximate chemical analyses were carried out on the raw M. semimembranosus from the left leg (the<br />
subcutaneous fat layer was included). Total percentages <strong>of</strong> moisture, protein <strong>and</strong> ash were determined<br />
according to AOAC methods (AOAC, 1997). The protein concentration was determined by the block<br />
digestion method <strong>and</strong> ashing was done at 500 °C for 5 h. The moisture content was determined by drying at<br />
100 °C for 24 h. The lipid content was determined by means <strong>of</strong> chlor<strong>of</strong>orm:methanol extraction (Lee et al.,<br />
1996).<br />
For the drip loss determination, ca.1.5 cm thick meat samples from the M. longissimus dorsi were<br />
weighed immediately after being removed from the carcass. The samples were placed in netting <strong>and</strong><br />
suspended in an inflated plastic bag. After a storage period <strong>of</strong> 24 h at 4 °C, samples were weighed again <strong>and</strong><br />
the drip loss was calculated as weight loss expressed as a percentage <strong>of</strong> the original weight <strong>of</strong> the sample<br />
(Honikel, 1998). For the cooking loss determination, the freshly cut M. longissimus dorsi samples (ca.1.5 cm<br />
thick) were weighed <strong>and</strong> placed in thin-walled plastic bags in a water-bath at 75 °C. After one hour the<br />
samples were removed from the water-bath, cooled in cold water, blotted dry <strong>and</strong> weighed. Cooking loss was<br />
calculated as the difference in sample weight before <strong>and</strong> after cooking, expressed as a percentage <strong>of</strong> the<br />
initial sample weight (Honikel, 1998). The WBS measurements <strong>of</strong> the cooked M. longissimus dorsi samples<br />
were obtained with a Warner-Bratzler shear attachment (Voisey, 1976) fitted to an Instron Universal Testing<br />
Machine (Model 4444). Three cylindrical cores were cut from each muscle using a 12.7 mm diameter bore.<br />
Samples were r<strong>and</strong>omly removed from the centre <strong>of</strong> each M. longissimus dorsi muscle. Maximum WBS<br />
values (N) required to shear a cylindrical core <strong>of</strong> cooked muscle perpendicular to the grain (at a crosshead<br />
speed <strong>of</strong> 200.0 mm/min) were recorded for each sample <strong>and</strong> the mean was calculated for each muscle. An<br />
increasing value indicated greater WBS <strong>and</strong>, therefore, tougher meat.<br />
A wet ashing method was used to prepare the meat samples for mineral analysis. The elements<br />
calcium (Ca), iron (Fe), selenium (Se), potassium (K), magnesium (Mg), sodium (Na), phosphorus (P), zinc<br />
(Zn), copper (Cu), <strong>and</strong> lead (Pb) <strong>of</strong> the digesta were determined by direct current plasma emission<br />
spectrometry (Pinta, 1982).<br />
The South <strong>African</strong> Journal <strong>of</strong> Animal Science is available online at http://www.sasas.co.za/Sajas.html
South <strong>African</strong> Journal <strong>of</strong> Animal Science 2003, 33 (1)<br />
© South <strong>African</strong> Society for Animal Science<br />
55<br />
After the extraction <strong>of</strong> the lipids, the fatty acid methyl esters (FAME) were prepared according to<br />
procedures published by Morrison & Smith (1964). The FAME were analysed with a gas-liquid<br />
chromatograph (Varian Model 3300), equipped with flame ionisation detection <strong>and</strong> two 30 m fused silica<br />
megabore DB-225 columns <strong>of</strong> 0.53 mm internal diameter (J&W Scientific, Folsom, CA). Gas flow rates<br />
were hydrogen 25 ml/min <strong>and</strong> nitrogen (carrier gas) 5-8 ml/min. The temperature programme was linear at 4<br />
ºC/min with initial <strong>and</strong> final temperatures <strong>of</strong> 160 ºC <strong>and</strong> 220 ºC (held for 10 min), respectively. The injector<br />
temperature was 240 ºC <strong>and</strong> the detector temperature 250 ºC. The FAME were identified by comparison <strong>of</strong><br />
the retention times to those <strong>of</strong> a st<strong>and</strong>ard FAME mixture (Nu-Chek-Prep Inc., Elysian, Minnesota).<br />
The experiment consisted <strong>of</strong> a completely r<strong>and</strong>omised design (2 x 2 factorial) with two reproduction<br />
lines (P <strong>and</strong> N) <strong>and</strong> two sexes (S <strong>and</strong> D) as the factors. Data were also pooled to test for the main effects <strong>of</strong><br />
reproduction line <strong>and</strong> sex. An experimental unit was a carcass from which samples were taken for<br />
measurements. Prior to analysis <strong>of</strong> variance the sensory scores were transformed to ranks. A factorial<br />
analysis <strong>of</strong> variance was performed on all data using <strong>SA</strong>S version 8.12 (<strong>SA</strong>S, 1990). The Shapiro-Wilk test<br />
was performed to test for non-normality (Shapiro & Wilk, 1965). In some cases deviations from normality<br />
were the cause <strong>of</strong> one or two outliners, which were excluded before the final analysis. In cases where there<br />
was still significant evidence <strong>of</strong> non-normality, this could be ascribed to kurtosis rather than skewness.<br />
Interpretation <strong>of</strong> the results was thus continued (Glass et al., 1972). Student’s t-Least Significant Differences<br />
(LSD) were calculated at the 5% significance level to compare treatment means.<br />
Results <strong>and</strong> Discussion<br />
Table 2 Rank means (Means) for the sensory <strong>quality</strong> <strong>characteristics</strong> <strong>of</strong> M. semimembranosus as<br />
influenced by the main effects <strong>of</strong> line <strong>and</strong> sex<br />
Line Positive Negative<br />
Sex Ewe Ram Ewe Ram LSD c<br />
Aroma d 2.92<br />
2.48<br />
2.48<br />
2.13 NS<br />
(6.13) (5.83) (5.79) (5.58)<br />
Initial juiciness e 2.90<br />
2.52<br />
2.27<br />
2.31 NS<br />
(6.29) (5.88) (5.92) (6.08)<br />
Sustained juiciness f 2.98<br />
2.38<br />
2.35<br />
2.29 NS<br />
(6.38) (5.96) (6.00) (5.96)<br />
First bite g<br />
3.02 a 2.33 ab 2.46 ab<br />
2.19 b 0.83<br />
(6.38) (5.88) (6.04) (5.92)<br />
Residue h 2.31<br />
2.60<br />
2.63<br />
2.46 NS<br />
(5.63) (5.75) (5.79) (5.75)<br />
Flavour i 2.79<br />
2.63<br />
2.44<br />
2.15 NS<br />
(6.29) (6.21) (6.04) (5.92)<br />
a,b Rank means in the same row with different superscripts are significantly different (P ≤ 0.05)<br />
c<br />
Least significant difference (P = 0.05); NS = Not significant (P > 0.05)<br />
d<br />
Aroma: 1 = extremely bl<strong>and</strong>; 8 = extremely intense<br />
e<br />
Initial juiciness: 1 = extremely dry; 8 = extremely juicy<br />
f<br />
Sustained juiciness: 1 = extremely dry; 8 = extremely juicy<br />
g<br />
First bite: 1 = extremely tough; 8 = extremely tender<br />
h<br />
Residue: 1 = abundant; 8 = none<br />
i<br />
Flavour: 1 = extremely bl<strong>and</strong>; 8 = extremely intense<br />
Rank means for sensory <strong>quality</strong> <strong>characteristics</strong> <strong>of</strong> the M. semimembranosus are presented in Table 2.<br />
The means are also provided below the rank means (in brackets) for the interpretation <strong>of</strong> the results using the<br />
rating scale. All sensory <strong>quality</strong> <strong>characteristics</strong>, except first bite, were similar (P > 0.05) for all the groups.<br />
The first bite <strong>of</strong> the meat from the four groups differed (P ≤ 0.05), with the PE (Positive line, Ewe) group<br />
having the highest (3.0) <strong>and</strong> the NR (Negative line, Ram) group having the lowest (2.2) rank means. The<br />
latter represents the tougher product. The results <strong>of</strong> this experiment further indicate that, although not<br />
significant (P > 0.05), the sensory panel also rated the PE group higher in initial juiciness, sustained juiciness<br />
<strong>and</strong> flavour, <strong>and</strong> slightly higher in the perceived amount <strong>of</strong> residue compared to the other groups.<br />
The South <strong>African</strong> Journal <strong>of</strong> Animal Science is available online at http://www.sasas.co.za/Sajas.html
South <strong>African</strong> Journal <strong>of</strong> Animal Science 2003, 33 (1)<br />
© South <strong>African</strong> Society for Animal Science<br />
56<br />
When the data were pooled for main effect <strong>of</strong> line, differences (P ≤ 0.05) were only observed in<br />
flavour intensity (Table 3). Meat from the positive line was rated more flavoursome (2.7) than the negative<br />
line (2.3). The slightly higher flavour intensity <strong>of</strong> the positive reproduction line could be the result <strong>of</strong><br />
differences in the fatty acid pr<strong>of</strong>ile (Table 11, Fisher et al., 2000).<br />
Table 3 Rank means (Means) for the sensory <strong>quality</strong> <strong>characteristics</strong> <strong>of</strong> M.semimembranosus as<br />
influenced by main effects <strong>of</strong> line <strong>and</strong> sex<br />
Line<br />
Sex<br />
LSD c<br />
Positive Negative<br />
Ram Ewe<br />
Aroma d 2.70 2.30 NS 2.30 2.70<br />
(5.98) (5.69)<br />
(5.71) (5.96)<br />
Initial juiciness e 2.60 2.40 NS 2.42 2.58<br />
(6.08) (6.00)<br />
(5.98) (6.10)<br />
Sustained juiciness f 2.68 2.32 NS 2.33 2.67<br />
(6.17) (5.98)<br />
(5.96) (6.19)<br />
First Bite g 2.68 2.32 NS 2.26 b 2.74 a<br />
(6.13) (5.98)<br />
(5.90) (6.21)<br />
Residue h 2.46 2.54 NS 2.53 2.47<br />
(5.69) (5.77)<br />
(5.75) (5.71)<br />
Flavour i<br />
2.71 a 2.29 b 0.40 2.39 2.62<br />
(6.25) (5.98)<br />
(6.06) (6.17)<br />
a,b Rank means in the same row with different superscripts are significantly different (P ≤ 0.05)<br />
c Least significant difference (P = 0.05), NS = Not significant (P > 0.05)<br />
d<br />
Aroma: 1 = extremely bl<strong>and</strong>; 8 = extremely intense<br />
e<br />
Initial juiciness: 1 = extremely dry; 8 = extremely juicy<br />
f<br />
Sustained juiciness: 1 = extremely dry; 8 = extremely juicy<br />
g<br />
First bite: 1 = extremely tough; 8 = extremely tender<br />
h<br />
Residue: 1 = abundant; 8 = none<br />
i<br />
Flavour: 1 = extremely bl<strong>and</strong>; 8 = extremely intense<br />
LSD<br />
NS<br />
NS<br />
NS<br />
0.44<br />
NS<br />
NS<br />
When pooled for ram <strong>and</strong> ewe effects (Table 3), differences (P ≤ 0.05) were found in first bite with the<br />
ewe group having the highest score (2.74) <strong>and</strong> the ram group having the lowest taste panel score (2.26).<br />
Therefore, meat derived from ewes was more tender than meat from rams. However, Ellis et al. (1997),<br />
found no palatability differences between sexes in meat <strong>quality</strong>. Results <strong>of</strong> the present investigation agree<br />
with findings by Jeremiah et al. (1998), who in a study comparing cooking properties <strong>and</strong> palatability<br />
attributes between 1660 lambs varying in chronicle age, slaughter weight <strong>and</strong> gender, found that meat<br />
derived from ewe lambs was more tender than roasts from rams. In this latter study these differences became<br />
more pronounced when secondary sexual <strong>characteristics</strong> (particularly as pertaining to the rams) had<br />
developed.<br />
The moisture, protein, fat <strong>and</strong> ash contents <strong>of</strong> the M. semimembranosus samples are presented in Table<br />
4. The meat from the four distinct groups differed (P ≤ 0.05) in moisture <strong>and</strong> lipid levels. The level <strong>of</strong><br />
moisture was highest in the PR group (ca. 76%) <strong>and</strong> lowest in the NE group (ca. 70%). The PR group also<br />
had the lowest lipid concentration (ca. 7%) <strong>and</strong> the NE group the highest (ca. 10%). No significant<br />
differences between the four groups were detected regarding the ash or protein levels.<br />
When pooled for sex (Table 5), the ewes had a significant lower moisture (ca. 71%) <strong>and</strong> higher lipid<br />
content (ca. 10%) than the rams (P ≤ 0.05). In a study by Ellis et al. (1997) carcasses from female lambs,<br />
compared to males showed thicker subcutaneous <strong>and</strong> greater intermuscular fat content. Observed trends by<br />
Jeremiah et al. (1997) further substantiate the fact that rams produce leaner carcasses than ewes. Tendencies<br />
in flavour intensity differences between ewes <strong>and</strong> rams suggested an association between the higher lipid<br />
content <strong>of</strong> the <strong>mutton</strong> derived from ewes <strong>and</strong> the flavour, aroma, initial juiciness <strong>and</strong> sustained juiciness<br />
ratings <strong>of</strong> their meat. The quantity <strong>of</strong> fat <strong>and</strong> its <strong>quality</strong> affect the nutritive value, appearance, processability,<br />
shelf life <strong>and</strong> palatability <strong>of</strong> meat. Therefore, fat is an important determinant <strong>of</strong> meat <strong>quality</strong>, <strong>and</strong> the degree<br />
<strong>of</strong> saturation <strong>of</strong> the fat contributes substantially to the sensory properties <strong>of</strong> meat (Rhee, 1992; Webb et al.,<br />
1994).<br />
The South <strong>African</strong> Journal <strong>of</strong> Animal Science is available online at http://www.sasas.co.za/Sajas.html
South <strong>African</strong> Journal <strong>of</strong> Animal Science 2003, 33 (1)<br />
© South <strong>African</strong> Society for Animal Science<br />
57<br />
Table 4 Means for the proximate chemical analysis <strong>of</strong> M. semimembranosus as<br />
influenced by the interaction between the main effects <strong>of</strong> line <strong>and</strong> sex (g/100 g meat<br />
sample)<br />
Line Positive Negative<br />
Sex Ewe Ram Ewe Ram LSD d<br />
Moisture 71.67 bc 75.94 a 70.04 c 73.91 ab 3.16<br />
Protein 16.29 17.12 16.68 16.12 NS e<br />
Lipid 9.29 ab 6.66 b 9.82 a 6.69 b 2.94<br />
Ash 1.08 1.02 1.04 1.09 NS<br />
a,b,c Means in the same row with different superscripts are significantly different (P ≤ 0.05)<br />
d<br />
Least significant difference (P = 0.05)<br />
e Not significant (P > 0.05)<br />
Table 5 Means for the proximate chemical analysis <strong>of</strong> M. semimembranosus as<br />
influenced by main effects <strong>of</strong> line <strong>and</strong> sex (g/100 g meat sample)<br />
Line<br />
Sex<br />
Positive Negative LSD c Ram Ewe LSD<br />
Moisture 74.04 72.46 NS d 74.93 a 70.97 b 2.223<br />
Protein 16.75 16.32 NS 16.62 16.46 NS<br />
Lipid 7.83 7.86 NS 6.67 b 9.52 a 2.07<br />
Ash 1.04 1.07 NS 1.06 1.06 NS<br />
a,b Means in the same row with different superscripts are significantly different (P ≤ 0.05)<br />
c<br />
Least significant difference (P = 0.05)<br />
d<br />
Not significant (P > 0.05)<br />
The pooled P <strong>and</strong> N groups did not differ (P > 0.05) in moisture, protein, lipid or ash contents (Table<br />
5). This could possibly be due to the large co-efficient <strong>of</strong> variation shown by the means. Physical measured<br />
traits, pH 48 , cooking loss, drip loss <strong>and</strong> WBS resistance <strong>of</strong> the M. longissimus dorsi, are presented in Table 6.<br />
Table 6 Means <strong>of</strong> pH 48 , drip loss, cooking loss <strong>and</strong> shear force resistance <strong>of</strong> lamb<br />
M. longissimus dorsi as influenced by the main interaction between the effects <strong>of</strong><br />
line <strong>and</strong> sex<br />
Line Positive Negative<br />
Sex Ewe Ram Ewe Ram LSD d<br />
pH 48 5.624 b 5.716 b 5.588 b 5.874 a 0.129<br />
Drip loss (%) 1.480 1.075 1.375 1.292 NS e<br />
Cooking loss (%) 29.92 25.74 25.63 31.53 NS<br />
WBS f (N) 168.05 a 106.58 bc 129.54 b 95.34 c 26.39<br />
a,b,c Means in the same row with different superscripts are significantly different (P ≤ 0.05)<br />
d<br />
Least significant difference (P = 0.05)<br />
e<br />
Not significant (P > 0.05)<br />
f<br />
Warner-Bratzler shear force value<br />
The pH 48 <strong>and</strong> WBS values showed differences (P ≤ 0.05) between the four groups. The NR group had<br />
the highest pH 48 <strong>and</strong> the lowest WBS value. The significant difference in WBS values was, however, not<br />
reflected by findings <strong>of</strong> the taste panel for the attribute <strong>of</strong> first bite (Table 2). A possible explanation could be<br />
that the latter was conducted on the M. semimembranosus <strong>and</strong> the physical measurements on the M.<br />
longissimus. The latter muscle is known to be more responsive to temperature, genetics, cooking methods,<br />
etc. When ram <strong>and</strong> ewe groups were pooled (Table 7), differences (P ≤ 0.05) were found for pH 48 , WBS<br />
values <strong>and</strong> cooking loss. Rams had higher ultimate pH <strong>and</strong> cooking loss values <strong>and</strong> a lower WBS value than<br />
ewes (P < 0.05). There was a tendency for the higher pH 48 values to result in lower WBS values, with the<br />
pooled ram group having the highest pH 48 value <strong>and</strong> the lowest WBS value. Results in Table 7 also indicate a<br />
The South <strong>African</strong> Journal <strong>of</strong> Animal Science is available online at http://www.sasas.co.za/Sajas.html
South <strong>African</strong> Journal <strong>of</strong> Animal Science 2003, 33 (1)<br />
© South <strong>African</strong> Society for Animal Science<br />
58<br />
line effect on meat tenderness. The positive line group had higher (P ≤ 0.05) WBS values, indicating that<br />
meat derived from the positive line is less tender compared to the meat from the negative line.<br />
Table 7 Means <strong>of</strong> pH 48 , drip loss, cooking loss <strong>and</strong> shear force resistance <strong>of</strong> lamb<br />
M. longissimus dorsi as influenced by line <strong>and</strong> sex<br />
Line<br />
Sex<br />
Positive Negative LSD c Ram Ewe LSD<br />
pH 48 5.67 5.73 NS d 5.80 a 5.61 b 0.09<br />
Drip loss (%) 1.28 1.33 NS 1.18 1.43 NS<br />
Cooking loss (%) 27.83 27.47 NS 30.72 27.77 NS<br />
WBS e (N) 137.3 a 112.4 b 18.66 101.0 b 148.8 a 18.66<br />
a,b Means in the same row with different superscripts are significantly different (P ≤ 0.05)<br />
c<br />
Least significant difference (P = 0.05)<br />
d Not significant (P > 0.05)<br />
e Warner Bratzler shear force value<br />
Conflicting reports regarding the relationship between pH <strong>and</strong> tenderness (WBS <strong>and</strong> sensory<br />
tenderness) are found in the literature. Young et al. (1993) showed a curvilinear relationship between pH <strong>and</strong><br />
WBS values, while Safari et al. (2001) found no relationship between pH <strong>and</strong> WBS or tenderness in four<br />
lamb genotypes. No significant correlations were found in this investigation.<br />
Results from this study indicated differences (P ≤ 0.05) between the four groups involved in the line x<br />
sex interaction regarding the Ca, Fe, K, Mg, P <strong>and</strong> Zn concentrations (Table 8). The major contributors to the<br />
mineral concentration <strong>of</strong> the <strong>mutton</strong> were K (±122 mg/100 g meat sample) <strong>and</strong> P (ca. 110 mg/100 g meat<br />
sample). There was a general tendency for the PE group to have the highest mineral concentration, except for<br />
Zn <strong>and</strong> Cu, whereas the NE group had the lowest concentration in all the minerals, except for Se.<br />
Table 8 Means for mineral composition <strong>of</strong> M. semimembranosus as influenced by the<br />
interactions between the main effects <strong>of</strong> line <strong>and</strong> sex (mg/100 g meat sample)<br />
Line Positive Negative<br />
Sex Ewe Ram Ewe Ram LSD c<br />
Ca 6.498 a 5.792 a 3.347 b 4.622 ab 2.420<br />
Fe 1.828 a 1.747 a 1.108 b 1.335 ab 0.575<br />
Se 0.087 0.054 0.067 0.054 NS<br />
K 134.5 a 128.1 ab 99.63 b 126.9 ab 28.73<br />
Mg 19.15 a 18.13 ab 14.93 b 16.57 ab 3.998<br />
Na 17.56 17.76 13.36 17.29 NS<br />
P 124.1 a 117.1 a 92.02 b 107.7 ab 24.49<br />
Zn 2.717 a 2.966 a 2.077 b 2.403 ab 0.583<br />
Cu 0.003 0.012 tr e 0.028 NS<br />
Pb 0.007 0.001 tr 0.003 NS<br />
a,b Means in the same row with different superscripts are significantly different (P ≤ 0.05)<br />
c<br />
Least significant difference (P = 0.05)<br />
d<br />
NS = Not significant (P > 0.05)<br />
e trace = < 0.001 mg/100 g meat sample<br />
When pooled together across sexes for positive <strong>and</strong> negative reproduction groups (Table 9), positive<br />
line animals had higher concentrations <strong>of</strong> Ca, Fe, P <strong>and</strong> Zn than their negative line contemporaries. Rams<br />
<strong>and</strong> ewes did not differ with regard to mineral concentrations.<br />
The South <strong>African</strong> Journal <strong>of</strong> Animal Science is available online at http://www.sasas.co.za/Sajas.html
South <strong>African</strong> Journal <strong>of</strong> Animal Science 2003, 33 (1)<br />
© South <strong>African</strong> Society for Animal Science<br />
59<br />
Table 9 Means for mineral composition <strong>of</strong> M. semimembranosus as influenced by<br />
the main effects <strong>of</strong> line <strong>and</strong> sex (mg/100 g meat sample)<br />
Line<br />
Sex<br />
Positive Negative LSD d Ram Ewe LSD c<br />
Ca 6.106 a 4.144 b 1.678 5.207 5.148 NS d<br />
Fe 1.783 a 1.250 b 0.399 1.541 1.519 NS<br />
Se 0.069 0.058 NS 0.054 0.078 NS<br />
K 130.9 116.7 NS 127.5 119.5 NS<br />
Mg 18.58 15.95 NS 17.35 17.34 NS<br />
Na 17.67 15.82 NS 17.53 15.76 NS<br />
P 120.2 a 101.8 b 16.97 112.4 110.3 NS<br />
Zn 2.855 a 2.281 b 0.404 2.685 2.443 NS<br />
Cu 0.007 0.017 NS 0.021 0.001 NS<br />
Pb 0.004 tr e NS 0.002 0.002 NS<br />
a,b<br />
Means in the same row with different superscripts are significantly different (P ≤ 0.05)<br />
c<br />
Least significant difference (P = 0.05)<br />
d Not significant (P > 0.05)<br />
e trace = < 0.001 mg/100 g meat sample<br />
Marked variations in the mineral composition <strong>of</strong> meat due to the effects <strong>of</strong> age, feeding regimen (diet),<br />
breed, season <strong>and</strong> geographical differences have been noted. The mineral content <strong>of</strong> retail cuts within any<br />
single carcass also varies significantly (Ono et al,. 1984; Lin et al., 1989). The latter is caused by variation in<br />
muscle fibre type <strong>and</strong> physical activity between muscles (Kotula & Lusby, 1982). The sheep in the present<br />
study were selected from a single geographical location, feeding regimen (diet) <strong>and</strong> the same age group. It is<br />
well known that meat is an excellent food source <strong>of</strong> Fe <strong>and</strong> Zn, especially considering the higher bioavailability<br />
<strong>of</strong> these two minerals compared to that from plants (Lin et al., 1989). Approximately 40% <strong>of</strong> the<br />
Fe in meat is heme iron, <strong>and</strong> this form <strong>of</strong> Fe is more available to man than non-heme iron (Simonsen et al.,<br />
1988). Meat, therefore, contributes significantly to the minerals required in the human diet. The<br />
concentration <strong>of</strong> Fe, Zn <strong>and</strong> Cu in meat is higher than that provided by the other food sources (non animal) in<br />
the rest <strong>of</strong> the diet as a whole (Williams, 1987). The results from this investigation indicated significant<br />
differences in the mineral composition between lines. The meat from the positive line could contribute<br />
higher concentrations <strong>of</strong> minerals to the human diet than the negative line could.<br />
The fatty acid composition <strong>of</strong> the M. semimembranosus from the four sheep groups is presented in<br />
Table 10. Oleic acid (C18:1n-9) occurred at the highest proportion <strong>of</strong> all fatty acids, contributing to<br />
approximately 39% <strong>of</strong> the total fatty acid content, followed by palmitic acid (C16:0) (±27%) <strong>and</strong> stearic acid<br />
(C18:0) (±23%). These results agree with those <strong>of</strong> Webb et al. (1997) who found that C16:0, C18:0 <strong>and</strong><br />
C18:1n-9 constituted the highest proportion <strong>of</strong> the fatty acids in the meat <strong>of</strong> South <strong>African</strong> Mutton Merino<br />
wethers. No significant differences existed between the four groups in the concentration <strong>of</strong> the major<br />
saturated fatty acids (SFA), i.e. C16:0 <strong>and</strong> C18:0 (Table 10). However, there were significant differences (P<br />
≤ 0.05) between groups in arachidic acid (C20:0) <strong>and</strong> lignoceric acid (C24:0) concentrations. Total SFA<br />
concentrations did not differ significantly between the four groups. Eicosenoic acid (C20:1n-9) was the only<br />
mono-unsaturated fatty acid (MUFA) that differed (P ≤ 0.05) between the four groups, with the ewes having<br />
a higher proportion than the rams. Total MUFA did not differ (P > 0.05) between groups. As far as the<br />
polyunsaturated fatty acids (PUFA) are concerned, differences (P ≤ 0.05) were detected between the groups<br />
in linoleic acid (C18:2n-6), homo-γ-linolenic acid (C20:3n-6), arachidonic acid (C20:4n-6), eicosapentaenoic<br />
acid (C20:5n-3), docosadienoic acid (C22:2n-6), docosapentaenoic acid (C22:5n-3) <strong>and</strong> docosahexaenoic<br />
acid (C22:6n-3) concentrations. These differences in individual PUFA resulted in a significant difference (P<br />
≤ 0.05) in total PUFA between the four groups. The PR group had the highest total PUFA concentration<br />
(±8%) <strong>and</strong> the NR the lowest (±6%).<br />
The South <strong>African</strong> Journal <strong>of</strong> Animal Science is available online at http://www.sasas.co.za/Sajas.html
South <strong>African</strong> Journal <strong>of</strong> Animal Science 2003, 33 (1)<br />
© South <strong>African</strong> Society for Animal Science<br />
60<br />
Table 10 Means proportions <strong>of</strong> the fatty acid content <strong>of</strong> M. semimembranosus as<br />
influenced by the interaction between the main effects <strong>of</strong> line <strong>and</strong> sex (% by weight<br />
<strong>of</strong> total fatty acids)<br />
Line Positive Negative<br />
Sex Ewe Ram Ewe Ram LSD d<br />
C14:0 2.988 2.342 2.383 2.412 NS e<br />
C16:0 26.33 27.65 27.02 27.65 NS<br />
C18:0 23.27 21.63 24.28 22.84 NS<br />
C20:0 0.317 a 0.202 b 0.263 ab 0.303 a 0.068<br />
C22:0 0.063 0.044 0.047 0.056 NS<br />
C24:0 0.038 ab 0.050 a 0.040 ab 0.026 b 0.021<br />
C16:1n-7 1.423 1.590 1.197 1.542 NS<br />
C18:1n-9 38.56 38.52 38.22 39.18 NS<br />
C20:1n-9 0.200 a 0.106 b 0.247 a 0.098 b 0.065<br />
C24:1n-9 0.023 0.020 0.017 0.016 NS<br />
C18:2n-6 3.735 ab 4.356 a 3.570 ab 3.406 b 0.817<br />
C18:3n-6 0.093 0.053 0.070 0.074 NS<br />
C18:3n-3 1.310 1.260 1.277 1.140 NS<br />
C20:2n-6 0.055 0.022 0.033 0.040 NS<br />
C20:3n-6 0.098 b 0.138 a 0.087 b 0.076 b 0.030<br />
C20:4n-6 0.605 ab 0.848 a 0.470 b 0.472 b 0.266<br />
C20:3n-3 0.025 0.010 0.013 0.014 NS<br />
C20:5n-3 0.298 ab 0.450 a 0.220 b 0.270 b 0.176<br />
C22:2n-6 0.080 ab 0.074 b 0.220 a 0.036 b 0.141<br />
C22:4n-6 0.028 0.038 0.025 0.026 NS<br />
C22:5n-3 0.398 ab 0.500 a 0.210 c 0.284 bc 0.167<br />
C22:6n-3 0.120 a 0.118 a 0.060 b 0.072 b 0.046<br />
SFA f 52.97 51.89 54.04 53.25 NS<br />
MUFA g 40.21 40.23 39.69 40.83 NS<br />
PUFA h 6.835 ab 7.924 a 6.293 ab 5.914 b 1.699<br />
PUFA:SFA i 0.130 ab 0.154 a 0.120 ab 0.112 b 0.036<br />
DFA j 70.31 69.78 70.27 69.59 NS<br />
(C18:0+C18:1):C16:0 2.370 2.202 2.313 2.266 NS<br />
a,b,c Means in the same row with different superscripts differ significantly (P ≤ 0.05)<br />
d<br />
Least significant difference (P = 0.05)<br />
e Not significant (P > 0.05)<br />
f Saturated fatty acids<br />
g Mono-unsaturated fatty acids<br />
h Polyunsaturated fatty acids<br />
i<br />
Ratio <strong>of</strong> polyunsaturated to saturated fatty acids<br />
j Desirable fatty acids<br />
When pooled across selection lines, no concentration differences (P > 0.05) occurred between sexes<br />
for total SFA, total MUFA or total PUFA (Table 11). Except for C20:1n-9, no differences (P > 0.05) were<br />
detected in the individual fatty acid composition. The absence <strong>of</strong> significant differences in SFA, MUFA <strong>and</strong><br />
PUFA concentrations between males <strong>and</strong> females suggests that the fatty acid pr<strong>of</strong>ile was independent <strong>of</strong> sex<br />
(at a slaughter weight <strong>of</strong> ca. 43 kg). These results agree with the findings <strong>of</strong> Horcoda et al. (1998), but differ<br />
from those <strong>of</strong> Solomon et al. (1990), who found that the ram lambs had lipids richer in PUFA <strong>and</strong> poorer in<br />
SFA than ewes. The latter could be due to an age effect as the sheep used in the present investigation were<br />
older.<br />
When pooled across sexes (Table 11), the positive line animals had a higher PUFA concentration (ca.<br />
7%) than their N group contemporaries (ca. 6%). The total SFA <strong>and</strong> MUFA composition did not differ (P ><br />
0.05) between the lines. The higher (P ≤ 0.05) proportions <strong>of</strong> the C18:2n-6, C20:3n-6, C20:4n-6, C20:5n-3,<br />
C22:5n-3 <strong>and</strong> C22:6n-3 PUFAs in the P group resulted in this group having a higher (P ≤ 0.05) total PUFA<br />
concentration than the N group.<br />
The South <strong>African</strong> Journal <strong>of</strong> Animal Science is available online at http://www.sasas.co.za/Sajas.html
South <strong>African</strong> Journal <strong>of</strong> Animal Science 2003, 33 (1)<br />
© South <strong>African</strong> Society for Animal Science<br />
61<br />
Table 11 Means proportions <strong>of</strong> the fatty acid content <strong>of</strong> M. semimembranosus as<br />
affected by the main effects <strong>of</strong> line <strong>and</strong> sex (% by weight <strong>of</strong> total fatty acids)<br />
Line<br />
Sex<br />
Positive Negative LSD d Ram Ewe LSD<br />
C14:0 2.629 2.401 NS e 2.377 2.729 NS<br />
C16:0 27.06 27.41 NS 27.65 26.63 NS<br />
C18:0 23.38 22.36 NS 22.23 23.61 NS<br />
C20:0 0.245 0.286 NS 0.247 0.290 NS<br />
C22:0 0.052 0.053 NS 0.050 0.055 NS<br />
C24:0 0.043 0.031 NS 0.035 0.039 NS<br />
C16:1n-7 1.516 1.413 NS 1.566 1.326 NS<br />
C18:1n-9 38.54 38.82 NS 38.85 38.42 NS<br />
C20:1n-9 0.148 0.154 NS 0.102 b 0.220 a 0.046<br />
C24:1n-9 0.021 0.016 NS 0.018 0.020 NS<br />
C18:2n-6 4.080 a 3.468 b 0.566 3.881 3.664 NS<br />
C18:3n-6 0.073 0.073 NS 0.064 0.083 NS<br />
C18:3n-3 1.282 1.191 NS 1.200 1.296 NS<br />
C20:2n-6 0.037 0.038 NS 0.031 0.046 NS<br />
C20:3n-6 0.120 a 0.080 b 0.021 0.107 0.093 NS<br />
C20:4n-6 0.740 a 0.471 b 0.184 0.660 0.547 NS<br />
C20:3n-3 0.017 0.014 NS 0.012 0.020 NS<br />
C20:5n-3 0.382 a 0.251 b 0.122 0.360 0.264 NS<br />
C22:2n-6 0.077 0.105 NS 0.055 0.140 NS<br />
C22:4n6 0.033 0.026 NS 0.031 0.027 NS<br />
C22:5n3 0.454 a 0.256 b 0.115 0.392 0.317 NS<br />
C22:6n3 0.119 a 0.068 b 0.032 0.095 0.094 NS<br />
SFA f 52.37 53.55 NS 52.57 53.42 NS<br />
MUFA g 40.22 40.40 NS 40.53 39.98 NS<br />
PUFA h 7.440 a 6.056 b 1.177 6.919 6.603 NS<br />
PUFA:SFA i 0.143 a 0.115 b 0.025 0.133 0.126 NS<br />
DFA j 70.13 69.84 NS 69.68 70.29 NS<br />
(C18:0+C18:1):C16:0 2.277 2.284 NS 2.234 2.346 NS<br />
a,b<br />
Means in the same row with different superscripts differ (P ≤ 0.05)<br />
d<br />
Least significant difference (P = 0.05)<br />
e<br />
NS = Not significant (P > 0.05)<br />
f Saturated fatty acids<br />
g Mono-unsaturated fatty acids<br />
h Polyunsaturated fatty acids<br />
i Ratio <strong>of</strong> polyunsaturated to saturated fatty acids<br />
j Desirable fatty acids<br />
Desirable fatty acids (DFA), according to the health classification <strong>of</strong> Rhee (1992), are the sum <strong>of</strong> all<br />
unsaturated fatty acids <strong>and</strong> stearic acid. Oleic acid (C18:1n-9), Palmitic acid (C16:0) <strong>and</strong> stearic acid (C18:0)<br />
represented the majority <strong>of</strong> the fatty acids measured in the M. semimembranosus in this investigation. It is<br />
well known that C16:0 increases blood cholesterol levels, whereas C18:0 has no effect <strong>and</strong> C18:1n-9<br />
decreases blood cholesterol content. Therefore, the ratio <strong>of</strong> (C18:0 + C18:1):C16:0 indicates the possible<br />
health effects <strong>of</strong> the lipids (Grundy, 1997; Banskalievaa et al., 2000). Within the four reproduction fitness<br />
groups (Table 10), as well as in the pooled groups for sexes <strong>and</strong> lines (Table 11), no significant differences<br />
were detected in DFA or (C18:0+C18:1):C16.<br />
The PUFA:SFA ratio is an important guideline illustrating the total impact <strong>of</strong> SFA on blood<br />
cholesterol. Values <strong>of</strong> 0.45 or above for the PUFA:SFA ratio in dietary fats have been recommended in the<br />
United Kingdom (Warris, 2000). The PUFA:SFA ratio is lower in ruminant than non-ruminant meat because<br />
<strong>of</strong> the bio-hydrogenation <strong>of</strong> dietary unsaturated fatty acids by ruminal micro-organisms (Banskalievaa et al.,<br />
2000). Particularly the concentration <strong>of</strong> linoleic acid (C18:2n-6), the major plant fatty acid, is therefore much<br />
lower in ruminant than in non-ruminant tissue. These factors lead to ruminant meat having a PUFA:SFA<br />
ratio below the value <strong>of</strong> 0.45 required in the human diet (Warris, 2000). Previous reports found PUFA:SFA<br />
The South <strong>African</strong> Journal <strong>of</strong> Animal Science is available online at http://www.sasas.co.za/Sajas.html
South <strong>African</strong> Journal <strong>of</strong> Animal Science 2003, 33 (1)<br />
© South <strong>African</strong> Society for Animal Science<br />
62<br />
ratio <strong>of</strong> lipids from bovine or lamb meat to be between 0.11 <strong>and</strong> 0.15 (Geay et al.,2001). The PUFA:SFA<br />
ratio <strong>of</strong> the four groups in this investigation differed (P ≤ 0.05), but were all markedly below the<br />
recommended value <strong>of</strong> 0.45. The P group had a higher PUFA:SFA ratio <strong>of</strong> 0.143, compared to the N<br />
production group that had a PUFA:SFA ratio <strong>of</strong> 0.115.<br />
Conclusions<br />
The <strong>objective</strong> <strong>of</strong> this investigation was to determine if meat <strong>quality</strong> differed between two lines <strong>of</strong><br />
South <strong>African</strong> Merino sheep that were divergently selected for <strong>and</strong> against multiple-rearing ability.<br />
Differences detected in meat <strong>quality</strong> between the two lines were <strong>of</strong> a slight magnitude, although more<br />
important differences were found in the WBS values <strong>and</strong> mineral <strong>and</strong> fatty acid composition <strong>of</strong> the meat.<br />
However, the latter did not affect the sensory <strong>quality</strong> <strong>of</strong> the meat. This investigation provides important<br />
scientific insight into the effect <strong>of</strong> reproduction rate on general <strong>mutton</strong> <strong>quality</strong>. Results indicated that the<br />
selection <strong>of</strong> sheep for an increased multiple-rearing ability did not result in negative correlated responses on<br />
general <strong>mutton</strong> <strong>quality</strong> <strong>and</strong> therefore appears to be feasible. The only exception was with regard to<br />
tenderness, where the <strong>mutton</strong> derived from the positive line animals was generally tougher, according to<br />
WBS measurements, than the negative line contemporaries. This point needs further elucidation, as this is a<br />
<strong>quality</strong> attribute that plays an important role in a consumer’s decision on whether to purchase or not to<br />
purchase a specific meat type.<br />
Analytical results <strong>of</strong> the fatty acid <strong>and</strong> mineral content <strong>of</strong> <strong>mutton</strong> derived from sheep raised under<br />
typical South <strong>African</strong> conditions are reported on a fresh meat basis <strong>and</strong> will serve as valuable information to<br />
use in national food composition tables.<br />
Acknowledgement<br />
The financial contributions <strong>of</strong> the South <strong>African</strong> wool industry to the maintenance <strong>of</strong> the breeding flock, the<br />
Technology <strong>and</strong> Human Resources for Industry Program (THRIP) <strong>and</strong> the National Resources Foundation<br />
(NRF) <strong>of</strong> South Africa are gratefully acknowledged.<br />
References<br />
Alex<strong>and</strong>er, G., 1988. What makes a good mother? Proc. Austr. Soc. Anim. Prod. 17, 25-41.<br />
AM<strong>SA</strong>, 1978. Guidelines for cookery <strong>and</strong> sensory evaluation <strong>of</strong> meat. American Meat Science Association,<br />
National Livestock <strong>and</strong> Meat board, Chicago, IL.<br />
AOAC, 1997. Official Methods <strong>of</strong> Analysis. (16 th ed.). Association <strong>of</strong> Official Analytical Chemists, Inc.,<br />
Arlington, Virginia, U<strong>SA</strong>.<br />
Banskalievaa, V., Sahlu, T. & Goetsch, A. L., 2000. Fatty acid composition <strong>of</strong> goat muscles <strong>and</strong> fat<br />
deposits: a review. Small Rum. Res. 37, 255-268.<br />
Cloete, S.W.P., 1999. Selection for weight <strong>of</strong> lamb weaned per breeding ewe. Elsenburg J. 1/2, 13-16.<br />
Cloete, S.W.P. & Dur<strong>and</strong>, A., 1994. A preliminary note on Merino sheep subjected to divergent selection on<br />
maternal values for lambs weaned per ewe joined. S. Afr. J. Anim. Sci. 24, 27-29.<br />
Cloete, S.W.P. & Olivier, J.J., 1998. Direct correlated responses to divergent selection for multiple-rearing<br />
ability on South <strong>African</strong> Merinos. In: Proc. 36 th National Congr. S. Afr. Soc. Anim. Sci., University <strong>of</strong><br />
Stellenbosch <strong>and</strong> Elsenburg, 5-8 April 1998, pp. 65-68.<br />
Cloete, S.W.P. & Scholtz, A.J., 1998. Lamb survival in relation to lambing <strong>and</strong> neonatal behaviour in<br />
medium wool Merino lines divergently selected for multiple-rearing ability. Aust. J. Exp. Agric. 38,<br />
801-811.<br />
Crouse, J.D., Ferrel, C.L. & Cross, H.R., 1983. The effect <strong>of</strong> dietary ingredients, sex, <strong>and</strong> slaughter weight<br />
on cooked meat flavour pr<strong>of</strong>iles <strong>of</strong> market lamb. J. Anim. Sci. 57, 1146-1153.<br />
Ellis, M., Webster, G.M., Merrell, B.G. & Brown, I., 1997. The influence <strong>of</strong> terminal sire breed on carcass<br />
composition <strong>and</strong> eating <strong>quality</strong> <strong>of</strong> crossbred lambs. Anim. Sci. 64, 77-86.<br />
Fisher, A.V., Enser, M., Richardson, R.I., Wood, J.D., Nute, G.R., Kurt, E., Sinclair, L.A. & Wilkonson,<br />
R.G., 1999. Fatty acid composition <strong>and</strong> eating <strong>quality</strong> <strong>of</strong> lamb types derived from four diverse breed x<br />
production systems. Meat Sci. 55, 141-147.<br />
Geay, Y., Boauchart, D., Hocquette J. & Culiole, J., 2001. Effect <strong>of</strong> nutritional factors on biochemical,<br />
structural <strong>and</strong> metabolic <strong>characteristics</strong> <strong>of</strong> muscles in ruminants, consequences on dietic value <strong>and</strong><br />
sensorial qualities <strong>of</strong> meat. Ruminant Nutr. & Meat Quality, 41, 1-26.<br />
The South <strong>African</strong> Journal <strong>of</strong> Animal Science is available online at http://www.sasas.co.za/Sajas.html
South <strong>African</strong> Journal <strong>of</strong> Animal Science 2003, 33 (1)<br />
© South <strong>African</strong> Society for Animal Science<br />
63<br />
Glass, G.V., Peckham, P.D. & S<strong>and</strong>ers, J.R., 1972. Consequences <strong>of</strong> failure to meet assumptions underlying<br />
the fixed effects analyses <strong>of</strong> variance <strong>and</strong> covariance. Rev. Educ. Res. 42, 237-288.<br />
Grundy, S.M., 1997. What is the desirable ratio <strong>of</strong> saturated, polyunsaturated <strong>and</strong> monounsaturated fatty<br />
acid in the diet? Amer. J. Clin. Nutr. 66, S988-S990.<br />
Honikel, K.O., 1998. Reference methods for the assessment <strong>of</strong> physical <strong>characteristics</strong> <strong>of</strong> meat. Meat Sci.,<br />
49, 447-457.<br />
Horcada, A., Beriain M.J., Pyrroyo, G., Lizaso, G. & Chasco, J., 1998. Effect <strong>of</strong> sex on meat <strong>quality</strong> <strong>of</strong><br />
Spanish lamb breeds (Lacha <strong>and</strong> Rasa Aragonesa). Anim. Sci. 67, 541-547.<br />
Jeremiah, L.E., Jones, S.D.M., Tong, A.K.W., Robertson, W.M. & Gibson, L.L., 1997. The influence <strong>of</strong><br />
lamb chronical age, slaughter weight <strong>and</strong> gender on carcass composition. Sheep & Goat Res. J. 13,<br />
30-38.<br />
Jeremiah, L.E., Tong, A.K.W. & Gibson, L.L., 1998. The influence <strong>of</strong> lamb chronical age, slaughter weight,<br />
<strong>and</strong> gender on cooking properties <strong>and</strong> palatability. Sheep & Goat Res. J. 14, 156-166.<br />
Kemp, J.D., Johnson, A.E., Steward, D.F., Ely, D.G. & Fox, J.D., 1976. Effect <strong>of</strong> dietary protein, slaughter<br />
weight, <strong>and</strong> sex on carcass composition, organoleptic properties, <strong>and</strong> cooking losses <strong>of</strong> lamb. J. Anim.<br />
Sci. 42, 575-583.<br />
Kotula, A.W. & Lusby, W.R., 1982. Mineral composition <strong>of</strong> muscles <strong>of</strong> 1-6 year old steers. J. Anim. Sci.<br />
54, 544-548.<br />
Laas, T.M., 1995. Breeding for <strong>quality</strong> <strong>and</strong> pr<strong>of</strong>it. Proc. Austr. Assoc. Anim. Breeding & Genetics, 11, 22-<br />
33.<br />
Lee, C.M., Trevino, B. & Chaiyawat, M., 1996. A simple <strong>and</strong> rapid solvent extraction method for<br />
determining total lipids in fish tissue. J. AOAC Int. 79, 487-492.<br />
Lin, K.C. Cross, H.R., Johnson, H.K., Bernstein, B.C., R<strong>and</strong>ecker, V. & Field, R.A., 1989. Mineral<br />
composition <strong>of</strong> lamb carcasses from the United States <strong>and</strong> New Zeal<strong>and</strong>. Meat Sci. 24, 47-59.<br />
Morrison, W.R. & Smith, M.L., 1964. Preparation <strong>of</strong> fatty acid methyl esters <strong>and</strong> dimethylacetals from<br />
lipids with boron fluoride-methanol. J. Lipid Res. 5, 600-602.<br />
Olivier, J.J., 1999. The South <strong>African</strong> Merino performance testing scheme. Premium Quality Wool<br />
Symposium. In: Proc. Assoc. Advancement <strong>of</strong> Animal Breeding & Genetics 13, 119-124.<br />
Ono, K., Berry, B.W., Johnson, E., Russek, E., Parker, C.F., Cahill, V.R. & Althouse, P.G., 1984. Nutrient<br />
composition <strong>of</strong> Lamb <strong>of</strong> Two Age Groups. J. Food Sci. 49, 1233-1239.<br />
Pinta, M., 1982. Modern methods for trace element analysis. (3rd ed.). Butterworths Ltd., Borough Green,<br />
Sevenoaks.<br />
Rhee, K.S., 1992. Fatty acids in meat <strong>and</strong> meat products. In: Fatty acids in foods <strong>and</strong> their health<br />
implications. Eds. Chow, C.K., Marcel Dekker Inc., New York.<br />
Safari, E., Forgarty, N.M., Ferrier, G.R., Hopkins, L.D. & Gilmour, A., 2001. Diverse lamb genotypes. 3.<br />
Eating <strong>quality</strong> <strong>and</strong> the relationship between its <strong>objective</strong> measurement <strong>and</strong> sensory assessment. Meat<br />
Sci. 57, 153-159.<br />
<strong>SA</strong>S, 1990. Statistical Analysis Systems user’s guide (4th ed.). <strong>SA</strong>S Institute Inc., Cary, NC.<br />
Shapiro, S.S. & Wilk, M.B., 1965. An analysis <strong>of</strong> variance test for normality (complete samples).<br />
Biometrika 52, 591-611.<br />
Simonsen, B., Hamm, R. & Rogowski, B., 1988. Meat as Food. In: World Animal Science, Meat Science,<br />
Milk Science <strong>and</strong> Technology. Eds. Cross, H.R. & Overby, A.J., Elsevier Science Publishers B.V.,<br />
New York. pp. 141-165.<br />
Solomon, M.B., Lynch, G.P., Ono, K. & Paroczay, E., 1990. Lipid composition <strong>of</strong> muscle <strong>and</strong> adipose tissue<br />
from crossbred ram, wether <strong>and</strong> cryptorchid lambs. J. Anim. Sci. 68, 137-142.<br />
Viljoen, D.L., Muller, M., De Swart, J.B., Sadie, A. & Vosloo, M.C., 2001. Computerized electronic<br />
temperature control system for thermal efficiency during baking in food research. Int. J. Cons. Studies<br />
25, 30-42.<br />
Voisey, P.W., 1976. Engineering assessment <strong>and</strong> critique <strong>of</strong> instruments used for meat tenderness<br />
evaluation. J. Text. Stud. 7, 11-48.<br />
Warris, P.D., 2000. Meat science: An introductory text. CABI Publishing, New York.<br />
Webb, E.C., Bosman, M.J.C. & Casey, N.H., 1994. Dietary influences on subcutaneous fatty acid pr<strong>of</strong>iles<br />
<strong>and</strong> sensory <strong>characteristics</strong> <strong>of</strong> Dorper <strong>and</strong> <strong>SA</strong> Mutton Merino wethers. S. Afr. J. Food Sci. Nutr. 6, 45-<br />
50.<br />
The South <strong>African</strong> Journal <strong>of</strong> Animal Science is available online at http://www.sasas.co.za/Sajas.html
South <strong>African</strong> Journal <strong>of</strong> Animal Science 2003, 33 (1)<br />
© South <strong>African</strong> Society for Animal Science<br />
64<br />
Webb, E.C., Bosman, M.J.C. & Casey, N.H., 1997. Influence <strong>of</strong> dietary presentation on the composition <strong>of</strong><br />
fatty acids <strong>and</strong> sensory <strong>characteristics</strong> <strong>of</strong> meat derived from wethers. S. Afr. J. Food Sci. Nutr. 9, 69-<br />
76.<br />
Williams, J.C., 1987. Contribution <strong>of</strong> red meat to the U.S. diet. Food <strong>and</strong> Nutrition News 59, 37-40.<br />
Young, O.A., Reid, D.H. & Scales, G.H., 1993. Effect <strong>of</strong> breed <strong>and</strong> ultimate pH on the odour <strong>and</strong> flavour <strong>of</strong><br />
sheep meat. N. Z. J. Agric. Res. 36, 363-370.<br />
The South <strong>African</strong> Journal <strong>of</strong> Animal Science is available online at http://www.sasas.co.za/Sajas.html