Sensory and objective mutton quality characteristics of SA - African ...
Sensory and objective mutton quality characteristics of SA - African ...
Sensory and objective mutton quality characteristics of SA - African ...

You also want an ePaper? Increase the reach of your titles
YUMPU automatically turns print PDFs into web optimized ePapers that Google loves.
South <strong>African</strong> Journal <strong>of</strong> Animal Science 2003, 33 (1)<br />
© South <strong>African</strong> Society for Animal Science<br />
59<br />
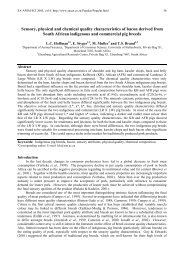
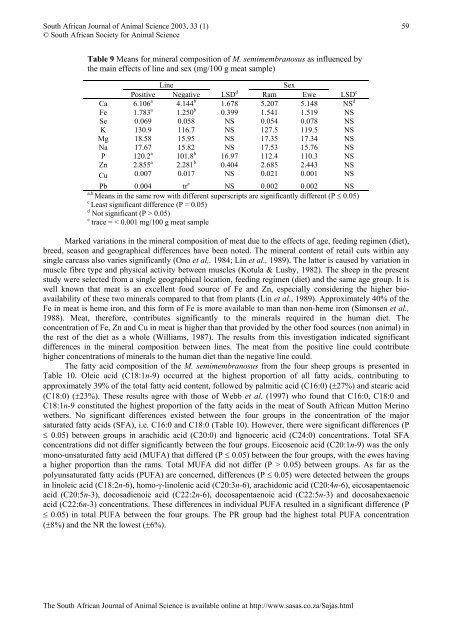
Table 9 Means for mineral composition <strong>of</strong> M. semimembranosus as influenced by<br />
the main effects <strong>of</strong> line <strong>and</strong> sex (mg/100 g meat sample)<br />
Line<br />
Sex<br />
Positive Negative LSD d Ram Ewe LSD c<br />
Ca 6.106 a 4.144 b 1.678 5.207 5.148 NS d<br />
Fe 1.783 a 1.250 b 0.399 1.541 1.519 NS<br />
Se 0.069 0.058 NS 0.054 0.078 NS<br />
K 130.9 116.7 NS 127.5 119.5 NS<br />
Mg 18.58 15.95 NS 17.35 17.34 NS<br />
Na 17.67 15.82 NS 17.53 15.76 NS<br />
P 120.2 a 101.8 b 16.97 112.4 110.3 NS<br />
Zn 2.855 a 2.281 b 0.404 2.685 2.443 NS<br />
Cu 0.007 0.017 NS 0.021 0.001 NS<br />
Pb 0.004 tr e NS 0.002 0.002 NS<br />
a,b<br />
Means in the same row with different superscripts are significantly different (P ≤ 0.05)<br />
c<br />
Least significant difference (P = 0.05)<br />
d Not significant (P > 0.05)<br />
e trace = < 0.001 mg/100 g meat sample<br />
Marked variations in the mineral composition <strong>of</strong> meat due to the effects <strong>of</strong> age, feeding regimen (diet),<br />
breed, season <strong>and</strong> geographical differences have been noted. The mineral content <strong>of</strong> retail cuts within any<br />
single carcass also varies significantly (Ono et al,. 1984; Lin et al., 1989). The latter is caused by variation in<br />
muscle fibre type <strong>and</strong> physical activity between muscles (Kotula & Lusby, 1982). The sheep in the present<br />
study were selected from a single geographical location, feeding regimen (diet) <strong>and</strong> the same age group. It is<br />
well known that meat is an excellent food source <strong>of</strong> Fe <strong>and</strong> Zn, especially considering the higher bioavailability<br />
<strong>of</strong> these two minerals compared to that from plants (Lin et al., 1989). Approximately 40% <strong>of</strong> the<br />
Fe in meat is heme iron, <strong>and</strong> this form <strong>of</strong> Fe is more available to man than non-heme iron (Simonsen et al.,<br />
1988). Meat, therefore, contributes significantly to the minerals required in the human diet. The<br />
concentration <strong>of</strong> Fe, Zn <strong>and</strong> Cu in meat is higher than that provided by the other food sources (non animal) in<br />
the rest <strong>of</strong> the diet as a whole (Williams, 1987). The results from this investigation indicated significant<br />
differences in the mineral composition between lines. The meat from the positive line could contribute<br />
higher concentrations <strong>of</strong> minerals to the human diet than the negative line could.<br />
The fatty acid composition <strong>of</strong> the M. semimembranosus from the four sheep groups is presented in<br />
Table 10. Oleic acid (C18:1n-9) occurred at the highest proportion <strong>of</strong> all fatty acids, contributing to<br />
approximately 39% <strong>of</strong> the total fatty acid content, followed by palmitic acid (C16:0) (±27%) <strong>and</strong> stearic acid<br />
(C18:0) (±23%). These results agree with those <strong>of</strong> Webb et al. (1997) who found that C16:0, C18:0 <strong>and</strong><br />
C18:1n-9 constituted the highest proportion <strong>of</strong> the fatty acids in the meat <strong>of</strong> South <strong>African</strong> Mutton Merino<br />
wethers. No significant differences existed between the four groups in the concentration <strong>of</strong> the major<br />
saturated fatty acids (SFA), i.e. C16:0 <strong>and</strong> C18:0 (Table 10). However, there were significant differences (P<br />
≤ 0.05) between groups in arachidic acid (C20:0) <strong>and</strong> lignoceric acid (C24:0) concentrations. Total SFA<br />
concentrations did not differ significantly between the four groups. Eicosenoic acid (C20:1n-9) was the only<br />
mono-unsaturated fatty acid (MUFA) that differed (P ≤ 0.05) between the four groups, with the ewes having<br />
a higher proportion than the rams. Total MUFA did not differ (P > 0.05) between groups. As far as the<br />
polyunsaturated fatty acids (PUFA) are concerned, differences (P ≤ 0.05) were detected between the groups<br />
in linoleic acid (C18:2n-6), homo-γ-linolenic acid (C20:3n-6), arachidonic acid (C20:4n-6), eicosapentaenoic<br />
acid (C20:5n-3), docosadienoic acid (C22:2n-6), docosapentaenoic acid (C22:5n-3) <strong>and</strong> docosahexaenoic<br />
acid (C22:6n-3) concentrations. These differences in individual PUFA resulted in a significant difference (P<br />
≤ 0.05) in total PUFA between the four groups. The PR group had the highest total PUFA concentration<br />
(±8%) <strong>and</strong> the NR the lowest (±6%).<br />
The South <strong>African</strong> Journal <strong>of</strong> Animal Science is available online at http://www.sasas.co.za/Sajas.html