The Hidden Epidemic (A Report On Child & Family Poverty In Toronto)

Create successful ePaper yourself
Turn your PDF publications into a flip-book with our unique Google optimized e-Paper software.
<strong>The</strong> <strong>Hidden</strong> <strong>Epidemic</strong><br />
A <strong>Report</strong> on <strong>Child</strong> and <strong>Family</strong> <strong>Poverty</strong> in <strong>Toronto</strong><br />
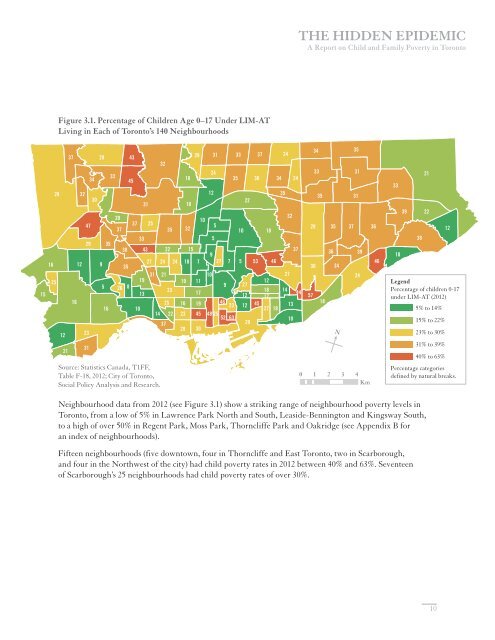
Figure 3.1. percentage of children Age 0–17 Under Lim-AT<br />
Living in each of <strong>Toronto</strong>’s 140 neighbourhoods<br />
28<br />
37<br />
32<br />
29<br />
33<br />
43<br />
45<br />
31<br />
32<br />
18<br />
18<br />
29<br />
12<br />
20<br />
32<br />
10<br />
47<br />
37 25<br />
5<br />
28 35 37 36<br />
37<br />
35 32<br />
10 18<br />
33<br />
5<br />
29 35<br />
38 43 22 15<br />
37<br />
36 39<br />
9<br />
7 5<br />
16 12 9<br />
27 24 24 10 7 27<br />
53 46<br />
46<br />
35<br />
30 34<br />
31 21<br />
10<br />
27<br />
24<br />
25 19<br />
19 11<br />
12<br />
5 8<br />
9 27<br />
26<br />
23<br />
18 14<br />
15<br />
13<br />
17<br />
44<br />
12 17<br />
57<br />
16<br />
25 16 19 46<br />
13<br />
18<br />
23 12 45<br />
16 10<br />
27 18<br />
14 22 23 45 48 25<br />
52 63<br />
10<br />
37<br />
29<br />
28 30<br />
12<br />
23<br />
21<br />
31<br />
34<br />
30<br />
Source: Statistics Canada, T1FF,<br />
Table F-18, 2012; City of <strong>Toronto</strong>,<br />
Social Policy Analysis and Research.<br />
31<br />
24<br />
35<br />
33<br />
22<br />
30<br />
37<br />
34<br />
35<br />
24<br />
24<br />
34<br />
33<br />
35<br />
N<br />
35<br />
31<br />
31<br />
0 1 2 3 4<br />
Km<br />
33<br />
10<br />
39<br />
38<br />
21<br />
22<br />
12<br />
Legend<br />
Percentage of children 0-17<br />
under LIM-AT (2012)<br />
5% to 14%<br />
15% to 22%<br />
23% to 30%<br />
31% to 39%<br />
40% to 63%<br />
Percentage categories<br />
defined by natural breaks.<br />
Neighbourhood data from 2012 (see Figure 3.1) show a striking range of neighbourhood poverty levels in<br />
<strong>Toronto</strong>, from a low of 5% in Lawrence Park North and South, Leaside-Bennington and Kingsway South,<br />
to a high of over 50% in Regent Park, Moss Park, Thorncliffe Park and Oakridge (see Appendix B for<br />
an index of neighbourhoods).<br />
Fifteen neighbourhoods (five downtown, four in Thorncliffe and East <strong>Toronto</strong>, two in Scarborough,<br />
and four in the Northwest of the city) had child poverty rates in 2012 between 40% and 63%. Seventeen<br />
of Scarborough’s 25 neighbourhoods had child poverty rates of over 30%.<br />
10