inequality-polarization-poverty-definitions

You also want an ePaper? Increase the reach of your titles
YUMPU automatically turns print PDFs into web optimized ePapers that Google loves.
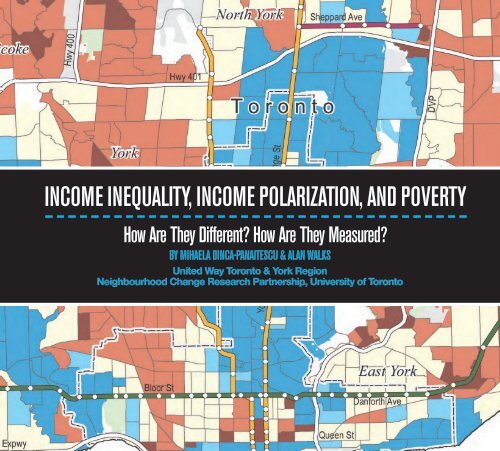
Income Inequality, Income Polarization, and Poverty<br />
How Are They Different? How Are They Measured?<br />
By Mihaela Dinca-Panaitescu & Alan Walks<br />
United Way Toronto & York Region<br />
Neighbourhood Change Research Partnership, University of Toronto
THE NEIGHBOURHOOD CHanGE RESEARCH PartnersHIP<br />
Income Inequality, Income Polarization, and Poverty: How Are They Different? How Are They Measured?<br />
By Mihaela Dinca-Panaitescu, United Way Toronto & York Region, and Alan Walks, University of Toronto.<br />
This is a joint publication by United Way Toronto & York Region and the Neighbourhood Change Research Partnership based at the Factor-Inwentash Faculty of Social<br />
Work, University of Toronto.<br />
Mihaela Dinca-Panaitescu is a Manager of Research, Public Policy and Evaluation at United Way Toronto & York Region. Over the last 15 years, she has been involved<br />
in World Health Organization community-based projects and various research and evaluation projects focused on social determinants of health and how access to opportunity<br />
in Toronto is being impacted by income <strong>inequality</strong>. She has a master’s degree in environmental science from Ryerson University and has published in the areas of<br />
income <strong>inequality</strong> and access to opportunity, social determinants of health, and disability rights.<br />
Alan Walks is associate professor of geography and planning at the University of Toronto. He has written scholarly articles on urban social <strong>inequality</strong> and <strong>polarization</strong>,<br />
housing policy, gentrification of the inner city, economic restructuring, rising household indebtedness, gated communities, and neighbourhood-based political attitudes<br />
and ideology. He is co-author and editor of the books The Urban Political Economy and Ecology of Automobility: Driving Cities, Driving Inequality, Driving Politics<br />
(Routledge 2015) and The Political Ecology of the Metropolis (ECPR Press 2013).<br />
Acknowledgements. The authors would like to thank David Hulchanski, Michelynn Laflèche, Laura McDonough, Robert Murdie, Emily Paradis, and Stephanie Procyk for<br />
their contributions to the conceptualization of this paper and feedback on drafts, as well as Philippa Campsie, who edited the final version of this paper. Thanks also to<br />
Richard Maaranen for help with the maps and graphs, and Dylan Simone for help calculating the Gini coefficients.<br />
Building Opportunity is a United Way Toronto & York Region initiative that seeks to build understanding, foster dialogue, and consider action on the issue of growing<br />
income <strong>inequality</strong> and its impact on equitable access to opportunity in the city. By creating new research and leveraging the research of its partners, Building Opportunity<br />
seeks to create a common understanding of income <strong>inequality</strong> in Toronto. This knowledge will be used to generate a city-wide conversation about why income <strong>inequality</strong><br />
matters to Torontonians and how we can all work together to mitigate its impacts. www.unitedwaytyr.com<br />
The Neighbourhood Change Research Partnership is examining trends in <strong>inequality</strong>, diversity, and change at the neighbourhood level across Canadian cities with<br />
academic and non-academic partners, including United Way Toronto & York Region. The objective is to better understand the connection between <strong>inequality</strong> and sociospatial<br />
exclusion. A key part of the research agenda is to identify similarities and differences among and within major metropolitan areas. The research is funded by a multiyear<br />
grant from the Social Sciences and Humanities Research Council of Canada. The research initiative is titled Neighbourhood Inequality, Diversity and Change: Trends,<br />
Processes, Consequences and Policy Options for Canada’s Large Metropolitan Areas (J David Hulchanski, Principal Investigator). www.NeighbourhoodChange.ca<br />
Design and Editing. Matthew Blackett and Julie Fish of Spacing Media provided design and art direction. Philippa Campsie of Hammersmith Communications edited<br />
the text. Richard Maaranen, the Neighbourhood Change Research Partnership’s data analyst, prepared the maps and charts.<br />
The Social Sciences and Humanities Research Council of Canada funded the publication of this research through a grant to the Neighbourhood Change Research<br />
Partnership. www.NeighbourhoodChange.ca<br />
December 2015<br />
© Neighbourhood Change Research Partnership, University of Toronto, 2015. ISBN 978-0-7727-9115-3<br />
The authors’ moral rights are protected with a Creative Commons license that allows users to quote from, link to, copy, transmit and distribute this<br />
report for non-commercial purposes, provided they attribute it to the author and publisher. The license does not allow users to alter, transform, or<br />
build upon the report. More details about this Creative Commons license can be viewed at www.creativecommons.org/licenses/by-nc-nd/2.5/ca
Introduction<br />
Income <strong>inequality</strong> has become the defining economic issue of our<br />
times. “Severe income <strong>inequality</strong>” topped the list of global risks identified<br />
by experts from industry, government, academia, and civil society<br />
who were surveyed for the World Economic Forum’s Global Risks 2012<br />
report.<br />
In the past, income <strong>inequality</strong> in developed countries increased during<br />
recessions and decreased in times of economic growth. However,<br />
since the 1980s, income <strong>inequality</strong> has risen even during periods of<br />
solid economic growth. Canada has mirrored these international trends.<br />
Different measures of income <strong>inequality</strong> all tell a similar story: income<br />
<strong>inequality</strong> has increased in Canada over the past two decades.<br />
Yet defining income <strong>inequality</strong> is a challenge. The term is applied to<br />
a range of measures using different kinds of data. In addition, income<br />
<strong>inequality</strong> is often confused with income <strong>polarization</strong> and with <strong>poverty</strong>.<br />
This backgrounder explains the differences between income <strong>inequality</strong>,<br />
income <strong>polarization</strong>, and <strong>poverty</strong>, and describes how they are<br />
measured. The intent is to help readers interpret research and media<br />
commentary on income <strong>inequality</strong> and income <strong>polarization</strong>.<br />
The paper also lays the groundwork for further research on the<br />
Toronto Region that is part of the United Way Toronto & York Region’s<br />
Building Opportunity initiative and the Neighbourhood Change<br />
Research Partnership.<br />
What are income <strong>inequality</strong> and income <strong>polarization</strong>?<br />
How do they differ from <strong>poverty</strong>?<br />
Income <strong>inequality</strong> describes a situation in which income is distributed<br />
unevenly in a country or region. Inequality exists when one group<br />
receives income that is disproportionate to its size. Income <strong>inequality</strong> has<br />
implications for health, political participation, educational outcomes, and<br />
general social well-being. Income <strong>inequality</strong> increases when the poor get<br />
poorer, the rich get richer, or the middle-income group declines in numbers<br />
or in income, or when any combination of these processes occurs.<br />
Income <strong>polarization</strong> describes a process in which income concentrates<br />
into two separate poles or groups, one rich, and another poor.<br />
Often this means that there are fewer people in the middle-income group<br />
and more in the high-income and low-income groups.<br />
Rising <strong>polarization</strong> is associated with claims about the “disappearing<br />
middle class.” The “middle class” is a commonly used but vague term.<br />
While it is difficult to precisely define and measure a middle class for<br />
research purposes, it is possible to define and measure a group in the<br />
NeighbourhoodChange.ca 1
middle of the income spectrum. Tracking such a measure over a number<br />
of years establishes whether or not the proportion of people in the<br />
middle-income group is increasing or decreasing.<br />
Income <strong>polarization</strong> may occur if changes in income mean that those<br />
in the middle group move towards one of the two poles (either the rich or<br />
the poor pole), or if population growth occurs only among the poor or the<br />
rich, not among the middle-income group. It may also occur if the level<br />
of variability of incomes among the rich declines such that rich incomes<br />
come closer to the average income of the rich group and at the same<br />
time, the level of variability of incomes among the poor similarly declines<br />
such that poor incomes come together closer to the average income of<br />
the poor group.<br />
What is the difference between income <strong>inequality</strong> and<br />
income <strong>polarization</strong>?<br />
The two terms are often confused. Measures of income <strong>inequality</strong> look<br />
at how income is distributed across the entire population. If income is<br />
transferred from a richer person to someone poorer, <strong>inequality</strong> decreases<br />
(or if transferred from a poorer to a richer person, <strong>inequality</strong> increases).<br />
Polarization, meanwhile, refers to the tendency for income to shift away<br />
from the centre of a distribution and into two separate groups – the rich<br />
and the poor – creating a hollowed-out middle.<br />
In measuring income <strong>polarization</strong>, researchers consider two principles,<br />
or “axioms.” The first is the “spread axiom,” which is that <strong>polarization</strong><br />
increases whenever the income distribution of the population shifts away<br />
from the median income (that is, the “spread widens”). This first axiom<br />
is also typically associated with increasing <strong>inequality</strong>. The second is the<br />
“bipolarity axiom,” in which <strong>polarization</strong> increases when the income<br />
distribution becomes concentrated into two poles that do not straddle the<br />
middle. The bipolarity axiom is met whenever the population becomes<br />
more concentrated into these two poles, even when this means that the<br />
very poorest see their income increase (but to a level less than the average<br />
for the poor pole) or the richest see their incomes fall (but to a level<br />
higher than the average for the rich pole). Note that the latter case could<br />
represent a situation in which <strong>polarization</strong> is increasing, while <strong>inequality</strong><br />
is decreasing.<br />
Poverty is a term that defines the amount of income required for a particular<br />
standard of living and the ability to purchase the necessities of life.<br />
The level of <strong>poverty</strong> in a society (or city) is usually measured in relation to<br />
the number of individuals, families, or households with incomes below a<br />
defined income cut-off line. Absolute measures of <strong>poverty</strong> set the <strong>poverty</strong><br />
cut-off line at a minimum income necessary to maintain a particular<br />
standard of living. Relative measures of <strong>poverty</strong> set the <strong>poverty</strong> cut-off<br />
in relation to the average income in a city, region, province, or nation.<br />
Poverty measures are separate and distinct from measures of income<br />
<strong>inequality</strong> and income <strong>polarization</strong>, and <strong>poverty</strong> rates may increase or<br />
decrease without affecting whether income <strong>inequality</strong> or income <strong>polarization</strong><br />
increases or decreases.<br />
How does <strong>poverty</strong> contrast with <strong>inequality</strong>?<br />
Poverty research focuses on individuals, families, households, or neighbourhoods<br />
with incomes below a defined level. In contrast, the study<br />
of income <strong>inequality</strong> focuses on disparities in living standards across the<br />
entire population, not only on people whose incomes fall below a <strong>poverty</strong><br />
line. A focus on income <strong>inequality</strong> advances a broader analysis of societal<br />
trends, one that includes much more than the subset of the population<br />
defined as those living in <strong>poverty</strong>.<br />
At the same time, however, actions to prevent rising income <strong>inequality</strong><br />
and income <strong>polarization</strong> can help reduce <strong>poverty</strong> levels. Addressing<br />
income <strong>inequality</strong> is a <strong>poverty</strong> reduction strategy. A holistic focus<br />
on <strong>inequality</strong> rather than <strong>poverty</strong> can address problems related to the<br />
distribution of income that a more narrow focus on those living in <strong>poverty</strong><br />
cannot address. Addressing <strong>poverty</strong>, something that affects a defined<br />
subgroup within society, is not the same as addressing income <strong>inequality</strong><br />
and income <strong>polarization</strong>, issues that affect all people in society.<br />
2 Income Inequality, Income Polarization, and Poverty
Two ways to report on income <strong>inequality</strong> and income <strong>polarization</strong>:<br />
people (individuals, households) or places<br />
Income <strong>inequality</strong> and <strong>polarization</strong> measures that describe income<br />
differences among individuals, families, or households throughout a<br />
city, province, or nation reflect non-geographic <strong>inequality</strong> and <strong>polarization</strong>.<br />
Where individuals, families, or households live is not taken into<br />
account, except as a general identifier for the whole group (e.g., Canadians<br />
as a whole, or Torontonians as a whole).<br />
However, income <strong>inequality</strong> and <strong>polarization</strong> measures can also<br />
describe income differences among areas where individuals, families,<br />
or households live, that is, geographic (or socio-spatial) <strong>inequality</strong> and<br />
<strong>polarization</strong>. In this case, the specific places where individuals, families,<br />
or households live are being compared. The terms geographic, spatial,<br />
and socio-spatial are used here interchangeably.<br />
The urban geographic unit typically used in spatial <strong>inequality</strong> and<br />
<strong>polarization</strong> research is the neighbourhood. In Canada, census tracts<br />
are commonly used to represent neighbourhoods. They are geographic<br />
units created by Statistics Canada whose boundaries follow main transportation<br />
routes, waterways, or features such as parks. They typically<br />
contain between 2,000 and 8,000 residents.<br />
Geographic measures of <strong>inequality</strong> and <strong>polarization</strong> indicate the<br />
extent to which individuals, families, or households are geographically<br />
concentrated and segregated by income in a city or region. In association<br />
with other data, these geographic measures can capture processes<br />
that affect the spatial distribution of income. For instance, it is possible<br />
to examine how shifts in the labour market or in government transfers<br />
affect either the distribution of income among households in general<br />
(that is, non-geographically), or among neighbourhoods (geographically,<br />
or socio-spatially).<br />
Inequality or <strong>polarization</strong> may increase among all households without<br />
changing the differences among neighbourhoods. This would occur if,<br />
for example, every neighbourhood includes some rich and poor, and the<br />
rich became richer or the poor became poorer everywhere at the same<br />
rates. Similarly, <strong>inequality</strong> or <strong>polarization</strong> may increase among neighbourhoods<br />
(geographically), but not among households (non-geographically).<br />
The latter situation could arise if incomes did not change, but the<br />
rich moved out of poor neighbourhoods and the poor moved out of rich<br />
neighbourhoods, leaving rich and poor more segregated from each other.<br />
Examining both processes – geographic and non-geographic <strong>inequality</strong><br />
and <strong>polarization</strong> – allows researchers to determine what is producing<br />
rising socio-spatial <strong>inequality</strong> and <strong>polarization</strong>, that is, whether sociospatial<br />
<strong>inequality</strong> and <strong>polarization</strong> are being driven by income changes<br />
among households, or by the active segregation of households of different<br />
incomes from each other, or both (see Figure 1). Usually, both<br />
processes happen together, and feed off each other: income <strong>inequality</strong><br />
usually spurs the rich to become more concentrated in rich neighbourhoods,<br />
while the poor are displaced from all but the poorest neighbourhoods<br />
because they can no longer afford to live anywhere else.<br />
Although changes in geographic and non-geographic <strong>inequality</strong> and<br />
<strong>polarization</strong> often move in the same direction, they tend to change at<br />
different rates. Because they are distinct processes, geographic and<br />
non-geographic forms of <strong>inequality</strong> and <strong>polarization</strong> need to be analyzed<br />
separately.<br />
NeighbourhoodChange.ca 3
Figure 1: Non-geographic and geographic income <strong>inequality</strong> and <strong>polarization</strong><br />
neighbourhood 1<br />
neighbourhood 2<br />
neighbourhood 3<br />
Non- geographic <strong>inequality</strong> and <strong>polarization</strong><br />
refers to the comparison of all individuals or<br />
households with each other in a large jurisdiction,<br />
such as a municipality, province, or country. The<br />
unit being measured is individual or household<br />
income.<br />
Geographic <strong>inequality</strong> and <strong>polarization</strong> refers to<br />
the comparison of geographic clusters of individuals or<br />
households (e.g., neighbourhoods or census tracts).<br />
The unit being measured is the average income<br />
of the geographic area.<br />
How do we measure income <strong>inequality</strong> and income <strong>polarization</strong>?<br />
Measures of income <strong>inequality</strong><br />
Measures of <strong>inequality</strong> focus on the relative position of different<br />
individuals, families, or households within an income distribution.<br />
Inequality measures should not be affected by the population size or by<br />
absolute levels of income. Inequality measures must, however, decrease<br />
when income is transferred from a richer to a poorer unit (individual,<br />
family, household, or neighbourhood, depending on the unit of analysis)<br />
and increase when income is transferred from a poorer to a richer unit,<br />
all other things being equal. Most measures of <strong>inequality</strong> vary between<br />
4 Income Inequality, Income Polarization, and Poverty<br />
zero and one, with 0.0 indicating perfect equality, and 1.0 indicating<br />
absolute <strong>inequality</strong>, in which only the top group, individual, place, or<br />
household has all the income.<br />
Different measures of income <strong>inequality</strong> are sensitive to different<br />
parts of the income distribution – some are better at measuring changes<br />
at the bottom of the income distribution, while others are better at<br />
measuring changes at the middle or top. The following measures of<br />
income <strong>inequality</strong> have been used in Canadian studies.
Share and ratio of income<br />
One straightforward way to describe how income<br />
<strong>inequality</strong> is articulated is by looking at how the total<br />
income in an area is shared amongst various segments<br />
of the population. For example, in 2009, the top 20<br />
0.60<br />
percent of Canadians received 39 percent of the national<br />
income, while the bottom 20 percent received only 7<br />
0.55<br />
percent (Conference Board of Canada, 2009). We have<br />
evidence of rising <strong>inequality</strong> if the share of the top 20<br />
percent increases, the share of the bottom 20 percent<br />
0.50<br />
decreases, and if there is no change in the middle 60<br />
percent of the distribution.<br />
Another common approach is to compare the<br />
0.45<br />
incomes of two different groups in the form of a ratio.<br />
Decile or quintile ratios are frequently used and compare<br />
the income earned by the top 10 percent (decile)<br />
0.40<br />
or 20 percent (quintile) of individuals, families, households,<br />
or neighbourhoods with the income earned by the<br />
0.35<br />
poorest 10 percent or 20 percent of individuals, families,<br />
households, or neighbourhoods. For example, in 2011,<br />
Canadian families in the top 20 percent had after-tax incomes<br />
that were 9.28 times larger than the incomes of those in bottom<br />
20 percent. If this ratio increases, <strong>inequality</strong> is rising (Statistics Canada,<br />
2011).<br />
These measures, however, typically do not capture what is happening<br />
to the income distribution as a whole. Therefore other formal<br />
measures, such as the Gini coefficient, have been developed.<br />
Figure 2<br />
Gini coefficient<br />
The Gini coefficient is the best-known and most accurate income <strong>inequality</strong><br />
measure. It is therefore the one cited most extensively in international<br />
studies that compare income <strong>inequality</strong> among countries. The<br />
Gini coefficient meets all the criteria for valid measures of <strong>inequality</strong>.<br />
The Gini coefficient measures the extent to which the distribution<br />
of income among individuals, families, households, or geographic areas<br />
within a country or region deviates from an absolutely equal distribution.<br />
A coefficient of 0.0 represents perfect equality among individuals,<br />
Gini Coefficient<br />
Income Inequality among Individuals in Canada's<br />
Three Largest Metropolitan Areas (CMAs):<br />
Gini Coefficients 1980–2005<br />
Toronto<br />
Vancouver<br />
Montréal<br />
1980 1990 2000 2005<br />
A Gini coefficient<br />
value of 0.0<br />
represents perfect<br />
equality. All<br />
individuals would<br />
have the exact same<br />
proportion of income<br />
relative to their share<br />
of the population. A<br />
Gini coefficient value<br />
of 1.0 represents<br />
perfect <strong>inequality</strong>. All<br />
of the income would<br />
be taken by one<br />
single individual while<br />
others take none.<br />
Notes<br />
Calculated by the<br />
authors from total<br />
individual income from<br />
all sources, before-tax<br />
using census<br />
microdata.<br />
Source: Statistics<br />
Canada, Census<br />
microdata 1981–2006.<br />
families, or households (in the case of non-geographic equality) or<br />
among neighbourhoods (in the case of geographic equality) in society.<br />
A coefficient of 0.0 would mean that every unit in the group studied is<br />
receiving the same amount of income. A coefficient of 1.0 represents a<br />
situation of total <strong>inequality</strong> in which one person, household, or family<br />
(or one neighbourhood) receives all the income and everyone else<br />
receives no income at all.<br />
An intuitive way of understanding the Gini coefficient is that the<br />
number corresponds to the share of total income that would need to<br />
be redistributed to achieve perfect income equality. For example, in<br />
2010, the after-tax Gini coefficient for all family units in Canada was<br />
0.39, which means that 39 percent of Canada’s national after-tax income<br />
would need to be redistributed among families to have each family<br />
ending up with exactly the same income (Statistics Canada, Cansim<br />
database). Figure 2 shows that 54 percent of the income going to individuals<br />
in the Toronto CMA would need to be redistributed in 2005 for<br />
everyone to have the same income.<br />
NeighbourhoodChange.ca 5
Other measures<br />
The following table lists a few other measures of income <strong>inequality</strong> that<br />
may appear in research reports.<br />
Name Uses Limitations<br />
Exponent<br />
coefficient<br />
Coefficient of<br />
Variation<br />
Squared<br />
Theil measure<br />
A method for analyzing<br />
the amount of income<br />
dispersion from the mean<br />
A method for analyzing<br />
the amount of income<br />
dispersion from the mean<br />
Focuses on the lack of<br />
diversity or the extent of<br />
non-random distribution of<br />
incomes. The Theil indices<br />
have the advantage of<br />
being de-composable into<br />
constituent parts<br />
More sensitive to<br />
changes in the lower end<br />
of income distribution<br />
More sensitive<br />
to changes in the<br />
upper end of the<br />
income distribution<br />
Overly sensitive to<br />
extreme values,<br />
particularly at the<br />
lower end<br />
Size of the middle-income group<br />
A simple, although inaccurate, way to measure <strong>polarization</strong> is to measure<br />
the size of the middle-income group relative to the total population<br />
and determine whether this group has become smaller over time. The<br />
middle-income group can be defined in different ways. For example,<br />
the group may be defined as individuals, families, or households that<br />
receive incomes that are 50 to 150 percent of the median income, or 75<br />
to 125 percent of the median income. It is important to inspect multiple<br />
ranges around the median before establishing if <strong>polarization</strong> is truly<br />
present in an income distribution. Although this method is commonly<br />
used, it does not adhere to the bipolarity axiom (described in section 2,<br />
above), and thus is not a true <strong>polarization</strong> measure.<br />
Foster-Wolfson (“P”) and Esteban &<br />
Ray (“ER”) indices<br />
The Foster-Wolfson “P” index (or Wolfson index) and Esteban and Ray<br />
index are the two main indices for measuring income <strong>polarization</strong>. The<br />
Measures of income <strong>polarization</strong><br />
Income <strong>polarization</strong> measures have been developed<br />
more recently than <strong>inequality</strong> measures. Some general<br />
properties are common to a range of <strong>polarization</strong> measures.<br />
Polarization increases when numbers of people (or<br />
households, or other units) shift away from the middle<br />
of the income distribution towards the extremes.<br />
Instead of the mean, <strong>polarization</strong> measures typically<br />
examine distance from the median (or middle) value in<br />
a distribution.<br />
Because the properties of income <strong>polarization</strong><br />
measures are distinct from those of income <strong>inequality</strong><br />
measures, research may find that <strong>inequality</strong> trends are<br />
different and even opposite to <strong>polarization</strong> trends.<br />
The following measures of income <strong>polarization</strong> have<br />
been used in Canadian studies.<br />
6 Income Inequality, Income Polarization, and Poverty<br />
Figure 3<br />
Gini Coefficient<br />
0.24<br />
0.22<br />
0.20<br />
0.18<br />
0.16<br />
Socio-Spatial Segregation of Household Income between<br />
Neighbourhoods in Canada's Three Largest CMAs:<br />
Gini Coefficients 1970–2005<br />
Toronto<br />
Vancouver<br />
Montréal<br />
A Gini coefficient value<br />
of 0.0 represents<br />
perfect equality. All<br />
census tracts would<br />
have the exact same<br />
proportion of household<br />
income relative to their<br />
share of total<br />
households.<br />
A Gini coefficient value<br />
of 1.0 represents<br />
perfect <strong>inequality</strong>. All<br />
of the household income<br />
would be taken by one<br />
single census tract while<br />
others take none.<br />
Notes<br />
Calculated by the<br />
0.14<br />
authors from census<br />
tract average household<br />
income from all sources,<br />
before-tax using census<br />
0.12<br />
data.<br />
Source: Statistics<br />
Canada, Census Profile<br />
Series, 1971-2006.<br />
0.10<br />
1970 1980 1990 2000 2005
Wolfson index varies between zero and one, where 0.0<br />
indicates no <strong>polarization</strong> at all (perfect equality) and 1.0<br />
indicates that half of the population has no income, and<br />
the other half collectively has twice the average income.<br />
The Esteban and Ray index is a measure of income <strong>polarization</strong><br />
that focuses on the rise of income groups that<br />
are becoming more internally homogenous and more<br />
separate from other groups.<br />
While considered the best measures for detecting<br />
<strong>polarization</strong> among individuals, families, or households,<br />
these two measures cannot be calculated using<br />
income data grouped into ranges or geographic units<br />
such as neighbourhoods with different populations.<br />
Unfortunately, this is often the format of census data<br />
made available for public use, so it is difficult to use the<br />
Wolfson or ER indices for analyzing neighbourhoodbased<br />
<strong>polarization</strong>.<br />
Figure 4<br />
Polarization measures that use income<br />
data grouped into ranges or geographic<br />
units<br />
The Wang-Tsui (WT) index and the Coefficient of<br />
Polarization (CoP) can be calculated using data grouped into ranges<br />
or neighbourhoods. The WT index is highly sensitive to changes in the<br />
upper end of the income distribution, but not as much to changes in<br />
incomes below the median. The CoP is better at capturing changes in<br />
both the upper and lower ends of the income distribution, but cannot<br />
take into account people, households, or other units that have no<br />
income at all.<br />
Both measures are fairly flexible for policy analysis. However, their<br />
values are not capped at 1.0 (that is, 0.0 indicates a lack of <strong>polarization</strong>,<br />
but 1.0 does not necessarily indicate absolute <strong>polarization</strong>). Nevertheless,<br />
the ranges of values of the WT and CoP indices generally vary in<br />
similar ways to the measures discussed above. Because these measures<br />
can be calculated using income data aggregated in spatial units with different<br />
populations, they are appropriate for calculating neighbourhoodbased<br />
income <strong>polarization</strong>.<br />
Coefficient of Polarization<br />
0.35<br />
0.33<br />
0.31<br />
0.29<br />
0.27<br />
0.25<br />
0.23<br />
0.21<br />
0.19<br />
0.17<br />
Socio-Spatial Polarization of Household Income between<br />
Neighbourhoods in Canada's Three Largest CMAs:<br />
Coefficient of Polarization (CoP) 1970–2005<br />
Montréal<br />
Toronto<br />
Vancouver<br />
0.15<br />
1970 1980 1990 2000 2005<br />
A COP value<br />
of 0.0 represents the<br />
complete absence of<br />
<strong>polarization</strong>. All<br />
census tracts would<br />
be middle income,<br />
each having the exact<br />
same average. As<br />
census tracts move<br />
away from each other,<br />
towards higher or<br />
lower incomes, the<br />
COP value increases<br />
with no maximum.<br />
Notes<br />
Calculated by the<br />
authors from census<br />
tract average<br />
household income<br />
from all sources,<br />
before-tax using<br />
census data. Source:<br />
Statistics Canada,<br />
Census Profile Series,<br />
1971-2006.<br />
Figures 3 and 4 show how Canada’s three largest metropolitan areas<br />
have changed in terms of socio-spatial <strong>inequality</strong> at the neighbourhood<br />
level, as measured using the Gini Coefficient (Figure 3), and<br />
socio-spatial <strong>polarization</strong> as measured using the Coefficient of Polarization<br />
(Figure 4). While the patterns of neighbourhood-based income<br />
segregation are similar between the two figures, as you can see they are<br />
not the same. While <strong>inequality</strong> and <strong>polarization</strong> measures often move in<br />
tandem, they are nonetheless distinct measures.<br />
NeighbourhoodChange.ca 7
What else do we need to know<br />
to make sense of the existing research<br />
on income <strong>inequality</strong> and <strong>polarization</strong>?<br />
The source of the data<br />
The advantages and drawbacks of the different sources of data should be<br />
considered when comparing results from different sources.<br />
Census<br />
Tax-filer data<br />
Source<br />
Survey of Consumer Finance (SCF)/<br />
Survey of Labour Income Dynamics<br />
(SLID)<br />
Characteristics<br />
Available every five years since<br />
1971, using income data for the<br />
preceding year, at the census tract<br />
level. The 1971 census (using 1970<br />
income data) is the earliest census<br />
containing information comparable<br />
to that of later censuses<br />
Available every year since 1982<br />
Available annually since 1976. SCF<br />
replaced by SLID in 1996.<br />
Before 2011, the Census provided the most reliable and complete data<br />
for analyzing income <strong>inequality</strong> in Canada, because it collected comprehensive<br />
information at both the high and low ends of the income scale,<br />
as well as for geographic areas large and small. The federal government<br />
under the Harper Conservatives cancelled the 2011 long-form census. It<br />
was replaced by a voluntary survey, the National Household Survey, the<br />
results from which are not comparable to previous censuses because a<br />
different sampling methodology was used. A further shortcoming of the<br />
Census is the lack of information on after-tax income before 2006.<br />
Tax-filer data for individuals are based on a large sample size; however,<br />
they contain much less socio-economic information than the Census and<br />
SCF/SLID, and the income variables are limited: there is no household<br />
income data, nor average family income (only median), in the tax-filer<br />
datasets.<br />
SCF/SLID provides information on both income transfers and taxes<br />
for individuals. However, in comparison with census and tax-filer data,<br />
this source underrepresents individuals and households with either very<br />
low or very high incomes.<br />
All these data sources collect information only on specific types of<br />
income. This limitation, as well as issues related to underreported or<br />
unreported income, can affect the quality of income statistics, and, implicitly,<br />
the results of income <strong>inequality</strong> analyses. Inequality studies using<br />
different sources of data cannot be compared if the data sources do not<br />
track the same types of income.<br />
Researchers have documented considerable under-reporting of certain<br />
types of income, such as employment insurance and social assistance<br />
incomes, as well as self-employment income and stock options. Unreported<br />
income, such as offshore accounts, tips, or rental income, would<br />
ideally also be considered in discussing the findings and recommendations<br />
of <strong>inequality</strong> studies, as this income affects the values of <strong>inequality</strong><br />
measures.<br />
8 Income Inequality, Income Polarization, and Poverty
The income measure<br />
The choice of income measure sometimes depends on the availability<br />
of data, and the data source may affect the findings of <strong>inequality</strong> and<br />
<strong>polarization</strong> studies. The following types of income are most often used in<br />
Canadian studies on income <strong>inequality</strong> and <strong>polarization</strong>.<br />
Type of income<br />
Employment<br />
Market income<br />
What it includes<br />
Wages, salaries, and<br />
self-employment income<br />
Wages, salaries, self-employment<br />
income, investment income, private<br />
pension income<br />
The income reporting unit<br />
Besides different <strong>definitions</strong> of income, there are various income reporting<br />
units, mainly the individual, the family, and the household.<br />
There is no ideal unit to measure income for the purpose of assessing<br />
<strong>inequality</strong> and <strong>polarization</strong>. Neighbourhood income values (including<br />
average and median incomes by neighbourhood) may use any of the following<br />
income-reporting units.<br />
Since each income reporting unit has its own limitations, the purpose<br />
of the <strong>inequality</strong> research will guide the rationale for choosing one<br />
unit over another. Moreover, the interpretation of the findings should<br />
acknowledge the limitations associated with the use of the specific<br />
income-reporting unit.<br />
Before-tax (but after transfers)<br />
income, or total income<br />
Market income, plus government<br />
transfers (Employment Insurance<br />
benefits, social assistance, workers’<br />
compensation, GST tax cedit, child<br />
tax benefits, public pensions)<br />
Income-reporting unit<br />
Individual income<br />
Characteristics<br />
Pertains to the total population, or to the population<br />
above a certain age. May be misleading if<br />
the researcher fails to consider the number of<br />
dependents who share an individual’s income<br />
After-tax income<br />
All forms of income, plus transfers,<br />
minus taxes<br />
Market income is sometimes used to illustrate changes in income<br />
<strong>inequality</strong> generated from the economy as a whole. Measures of income<br />
<strong>inequality</strong> and <strong>polarization</strong> based on market income overestimate income<br />
<strong>inequality</strong> and <strong>polarization</strong> by ignoring the effects of income transfer<br />
mechanisms on the overall social effects of redistribution.<br />
After-tax income is used to determine whether the policy system<br />
keeps pace with changes in income <strong>inequality</strong> generated from the economy.<br />
It is generally considered the income measure most closely related to<br />
well-being, as it reflects the total purchasing power after personal income<br />
taxes have been paid and transfers received. However, after-tax income is<br />
not available in the census before 2006, which makes comparisons over<br />
time difficult. For this reason, many studies of income <strong>inequality</strong> and<br />
<strong>polarization</strong> use before-tax income.<br />
Family income<br />
Household income<br />
Adjusted adult-equivalent<br />
income variable<br />
The measure used most often by Statistics Canada<br />
and other researchers in income <strong>inequality</strong><br />
studies. It indicates how families pool resources,<br />
but leaves out non-family households, which<br />
made up about 30 percent of all households in<br />
2006<br />
Represents the basic spending unit in any society.<br />
However, household size has been declining<br />
over time, and many households are now made<br />
up of unrelated people who may or may not<br />
pool their resources<br />
Used in some studies to measure the resources<br />
available to adults within a family after adjusting<br />
for family size and economies of scale. However,<br />
calculating this variable requires access to raw<br />
census data, which is not available for public<br />
use. Furthermore, researchers disagree on<br />
whether this measure is adequate to determine<br />
the difference among households in real incomerelated<br />
capacities to consume<br />
NeighbourhoodChange.ca 9
Conclusion<br />
This backgrounder is intended for those who read and write about income<br />
<strong>inequality</strong> and income <strong>polarization</strong>.<br />
Research and media reports on income <strong>inequality</strong>, income <strong>polarization</strong>,<br />
and <strong>poverty</strong> need to distinguish between income <strong>inequality</strong> and<br />
income <strong>polarization</strong>. Research and reports should also not confuse<br />
<strong>inequality</strong> with <strong>poverty</strong>, since many measures of <strong>poverty</strong> have little to do<br />
with measuring income <strong>inequality</strong> and <strong>polarization</strong>.<br />
It is also inaccurate to refer to the “middle class” rather than “middleincome<br />
groups” in discussions of the “disappearing middle.”<br />
Finally, any reports about these trends should identify what is being<br />
measured and why certain measures have been used – such as the type<br />
of income (before-tax or after-tax) and the reporting unit (individual,<br />
household, census tract, etc.) – as well as clearly identifying the source of<br />
the data used and its limitations.<br />
Glossary of terms<br />
After-tax income: includes wages, salaries, self-employment, investment<br />
income, and private pension income, plus government transfers<br />
and minus federal and provincial income taxes; also referred to as<br />
disposable income.<br />
Census tract: geographic unit created by Statistics Canada the boundaries<br />
of which follow main transportation routes, waterways, or features<br />
such as parks. Each census tract typically contains between 2,000<br />
and 8,000 residents. Census tracts are commonly used as proxies for<br />
neighbourhoods.<br />
Coefficient of Polarization (CoP): a <strong>polarization</strong> measure proposed<br />
by Walks (2013), determined by comparing incomes to the median<br />
income, and calculated by dividing the population (households, individuals,<br />
etc.) into income ranges. It is fairly equally sensitive to both the<br />
upper and lower ends of the income range.<br />
Coefficient of variation: the ratio of a standard deviation to the mean<br />
that shows the extent of income variability in relation to the mean<br />
income of the population.<br />
Decile: one of ten equal groups into which a population can be divided<br />
according to the distribution of income.<br />
Earnings income: includes wages, salaries, and self-employment.<br />
Esteban and Ray index: a measure of income <strong>polarization</strong> that<br />
focuses on the rise of income groups that are becoming more internally<br />
homogenous and more separate from one another.<br />
Exponent coefficient: a measure of income <strong>inequality</strong> that mainly<br />
captures changes in the lower end of income distribution.<br />
Foster-Wolfson “P” index: a measure of income <strong>polarization</strong> that<br />
compares all incomes in a distribution to the median income and<br />
simultaneously tracks both the dispersion of incomes in relation to the<br />
median as well as the extent to which they are clustered.<br />
Geographic <strong>inequality</strong>: income <strong>inequality</strong> between spatial units –<br />
areas where individuals, families, or households live.<br />
Geographic <strong>polarization</strong>: income <strong>polarization</strong> between spatial units –<br />
areas where individuals, families, or households live.<br />
10 Income Inequality, Income Polarization, and Poverty
Gini coefficient/Gini concentration ratio: a standard measure of<br />
income <strong>inequality</strong> that ranges from 0 (perfect equality – income is distributed<br />
evenly among the population) to 1.0 ( perfect <strong>inequality</strong> – one<br />
person has everything and everyone else has nothing).<br />
Government transfers: financial support given by the government to<br />
individuals through programs and services such as Employment Insurance<br />
benefits, social assistance, workers’ compensation, GST tax credits,<br />
child benefits, and public pensions.<br />
Income <strong>inequality</strong>: the extent to which income is distributed unevenly<br />
in a country or region. Inequality exists when any group or individual<br />
receives income that is disproportionate to the group’s size or share of<br />
the population.<br />
Income <strong>polarization</strong>: the extent to which the middle of the income<br />
distribution becomes hollowed out and the population moves from the<br />
middle to two poles in the higher and lower tails of the income distribution.<br />
Market income: includes wages, salaries, self-employment, investment<br />
income, and private pension income.<br />
Middle class: term commonly used to refer to a group of people that<br />
occupies the intermediate position between the poor and the rich. A<br />
strong middle class is seen as an important indicator of economic development,<br />
political stability, and social cohesion.<br />
Middle-income group: group of people whose income is equal to the<br />
median income of the entire group or falls within a certain percentage<br />
of the median income (for example, 15 percent or 20 percent, rendering<br />
30 percent or 40 percent of the entire group in the middle of the income<br />
distribution).<br />
National Household Survey (NHS): the replacement for the mandatory<br />
long-form census used in Canada’s 2011 Census; considered less<br />
accurate than the long-form census.<br />
Neighbourhood: a geographic section of a larger community, city,<br />
or region that contains residents (and sometimes institutions) and has<br />
distinct characteristics with definable boundaries.<br />
Non-geographic <strong>inequality</strong>: income <strong>inequality</strong> between individuals,<br />
families, or households calculated without regard to where they live.<br />
Non-geographic <strong>polarization</strong>: income <strong>polarization</strong> between individuals,<br />
families, or households calculated without regard to where they<br />
live.<br />
Polarization index: see Foster-Wolfson “P” index, Esteban-Ray (ER)<br />
Index, Coefficient of Polarization (CoP), and Wang-Tsui (WT) Index.<br />
Quintile: one of five equal groups into which a population can be<br />
divided according to the distribution of income.<br />
Survey of Consumer Finance (SCF)/Survey of Labour Income<br />
Dynamics (SLID): an annual survey of Canadian individuals and<br />
households, last conducted in 2011, that tracks changes in family makeup,<br />
paid work, receipt of government transfers, and other factors. SCF<br />
was replaced by SLID in 1996.<br />
Theil measures: a measure of income <strong>inequality</strong> that focuses on the<br />
lack of diversity or the extent of non-random distribution of incomes.<br />
Total income: includes market income plus government transfers; also<br />
referred to as before-tax (but after transfers) income.<br />
Wang-Tsui (WT) index: a measure of income <strong>polarization</strong> produced<br />
from the sum of the absolute differences in income between each individual<br />
(or the average income of individuals in a given income range)<br />
and the median income. It is highly sensitive to changes in the upper<br />
end of the income distribution, but not very sensitive to changes in<br />
incomes below the median.<br />
Wolfson index: see Foster-Wolfson “P” index.<br />
NeighbourhoodChange.ca 11
Further reading<br />
Conference Board of Canada. (2009). Is Canada becoming more unequal? Web document. Retrieved from http://www.conferenceboard.ca/<br />
hcp/hot-topics/can<strong>inequality</strong>.aspx<br />
Esteban, J.M., and Ray, D. (1994). On the measurement of <strong>polarization</strong>. Econometrica 62(4): 819–51.<br />
Foster, J.E., and Wolfson, M.C. (2010 republished; originally 1992). Polarization and the decline of the middle class: Canada and the US.<br />
Journal of Economic Inequality 8(2): 247–273.<br />
Frenette, M., Green, D., and Milligan, K. (2009). Revisiting Recent Trends in Canadian After-tax Income Inequality using Census Data.<br />
Analytical Studies Research Paper Series. Catalogue no. 11FOO19MIE2006274. Ottawa: Statistics Canada.<br />
Heisz, A. (2007). Income Inequality and Redistribution in Canada: 1976–2004. Catalogue No. 11F00119MIE-No.298. Statistics Canada.<br />
Hulchanski, David. (2010) The Three Cities Within Toronto: Income Polarization Among Toronto’s Neighbourhoods, 1970-2005.<br />
Toronto: University of Toronto, Cities Centre.<br />
Ley, David, and Nicholas Lynch. (2012) Divisions and Disparities in Lotus-Land: Socio-Spatial Income Polarization in Greater Vancouver,<br />
1970-2005. Research Paper No. 223. Toronto: University of Toronto, Cities Centre.<br />
Murdie, Robert, Richard Maaranen, and Jennifer Logan. (2013). Eight Canadian Metropolitan Areas: Who Lived Where in 2006? Research<br />
Paper No. 229. Toronto: University of Toronto, Cities Centre.<br />
OECD (2011). Divided We Stand – Why Income Inequality Keeps Rising. Paris: OECD Publishing.<br />
Procyk, Stephanie. (2014) Understanding Income Inequality in Canada, 1980–2014. Research Paper No. 232. Toronto: University of<br />
Toronto, Cities Centre.<br />
Rose, Damaris, and Amy Twigge-Molecey (2013) A City-Region Growing Apart? Taking Stock of Income Disparity in Greater Montréal,<br />
1970-2005. Research Paper No. 222. Toronto: University of Toronto, Cities Centre.<br />
Statistics Canada (2011) Indicators of Well-being in Canada: Financial security- income distribution.<br />
Statistics Canada. (2013). High-income trends among Canadian taxfilers, 1982 to 2010. The Daily, January 28.<br />
Statistics Canada, CANSIM database, Table 202-0705. Gini coefficients of market, total and after-tax income, by economic family type.<br />
United Way Toronto with EKOS Research Associates and the Neighbourhood Change Research Partnership. (2015) The Opportunity<br />
Equation: Building opportunity in the face of growing income <strong>inequality</strong>.<br />
Wang, Y., and Tsui, K. (2000). Polarization orderings and new classes of <strong>polarization</strong> indices. Journal of Public Economic Theory 2(3):<br />
349–363.<br />
Walks, A. (2013). Income Inequality and Polarization in Canada’s Cities: An Examination and New Form of Measurement. Research Paper<br />
No. 227. Toronto: University of Toronto, Cities Centre.<br />
Wolfson, M. (1997). Divergent Inequalities: Theory and Empirical Results. Analytical Studies Branch Research Paper Studies. Catalogue<br />
no. 11F0019MPE199766. Ottawa: Statistics Canada.<br />
Yalnizyan, A. (2010). The Rise of Canada’s Richest 1%. Ottawa: Canadian Centre for Policy Alternatives.<br />
12 Income Inequality, Income Polarization, and Poverty
Average Individual Income, Toronto Census Metropolitan Area, 2012<br />
Average Individual Income, Toronto Census Metropolitan Area, 2012<br />
Mono<br />
New Tecumseth<br />
East Gwillimbury<br />
Orangeville<br />
Newmarket<br />
Uxbridge<br />
5 2.5 0 5<br />
Caledon<br />
King<br />
Hwy 400<br />
Aurora<br />
Richmond<br />
Hill<br />
Hwy 404<br />
Whitchurch<br />
Stouffville<br />
Kilometers<br />
Markham<br />
Hwy 407<br />
Halton Hills<br />
Hwy 401<br />
Milton<br />
October 2014<br />
www.NeighbourhoodChange.ca<br />
Hwy 407<br />
Oakville<br />
Brampton<br />
Hwy 410<br />
Mississauga<br />
Hwy 401<br />
Notes<br />
QEW<br />
Etobicoke<br />
Hwy 427<br />
Vaughan<br />
Hwy 407<br />
York<br />
North York<br />
T o r o n t o<br />
(1) 2012 average individual<br />
Income is from the Canada<br />
Revenue Agency’s taxfiler<br />
data and includes income<br />
from all sources, before-tax.<br />
(2) Statistics Canada census tract<br />
and municipal boundaries are for 2011.<br />
(3) Data provided by the 2011 National<br />
Household Survey (NHS) has been proven to<br />
be untrustworthy. No NHS data is used here.<br />
East York<br />
DVP<br />
Scarborough<br />
Land Use Categories<br />
GREEN<br />
GREY<br />
WHITE<br />
Parks and Other<br />
Recreational Uses<br />
Commercial, Industrial,<br />
Institutional, Resource<br />
and Government Uses<br />
Open Space, Water<br />
and Rural Uses<br />
Pickering<br />
Ajax<br />
Hwy 401<br />
Census Tract Average<br />
Individual Income compared to the<br />
Toronto CMA Average of $46,666<br />
Very High - 140% to 697%<br />
CMA = 130 CTs, 12%<br />
City of Toronto = 87 CTs, 16%<br />
High - 120% to 140%<br />
CMA = 77 CTs, 7%<br />
City of Toronto = 28 CTs, 5%<br />
Middle Income - 80% to 120%<br />
CMA = 468 CTs, 43%<br />
City of Toronto = 162 CTs, 30%<br />
Low - 60% to 80%<br />
CMA = 316 CTs, 29%<br />
City of Toronto = 192 CTs, 36%<br />
Very Low - 36% to 60%<br />
CMA = 89 CTs, 8%<br />
City of Toronto = 72 CTs, 13%
Average Individual Income, City Of Toronto, 2012<br />
Census Tract Average Individual Income compared to the Toronto Census Metropolitan Area Average of $46,666<br />
Very High - 140% to 697%<br />
(87 CTs, 16% of the City)<br />
High - 120% to 140%<br />
(28 CTs, 5% of the City)<br />
Middle Income - 80% to 120%<br />
(162 CTs, 30% of the City)<br />
Low - 60% to 80%<br />
(192 CTs, 36% of the City)<br />
Very Low - 36% to 60%<br />
(72 CTs, 13% of the City)<br />
December 2015