Unequal City: The Hidden Divide Among Toronto's Children and Youth

You also want an ePaper? Increase the reach of your titles
YUMPU automatically turns print PDFs into web optimized ePapers that Google loves.
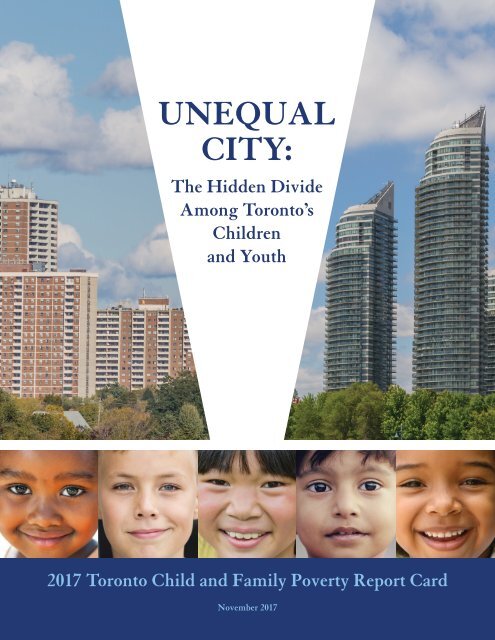
UNEQUAL CITY:<br />
<strong>The</strong> <strong>Hidden</strong> <strong>Divide</strong> <strong>Among</strong> Toronto’s <strong>Children</strong> <strong>and</strong> <strong>Youth</strong><br />
2017 Toronto Child <strong>and</strong> Family Poverty Report Card<br />
UNEQUAL<br />
CITY:<br />
<strong>The</strong> <strong>Hidden</strong> <strong>Divide</strong><br />
<strong>Among</strong> Toronto’s<br />
<strong>Children</strong><br />
<strong>and</strong> <strong>Youth</strong><br />
2017 Toronto Child <strong>and</strong> Family Poverty Report Card<br />
November 2017 i
UNEQUAL CITY:<br />
<strong>The</strong> <strong>Hidden</strong> <strong>Divide</strong> <strong>Among</strong> Toronto’s <strong>Children</strong> <strong>and</strong> <strong>Youth</strong><br />
2017 Toronto Child <strong>and</strong> Family Poverty Report Card<br />
Acknowledgements<br />
This report was researched <strong>and</strong> written by a working group that included:<br />
Michael Polanyi<br />
Community Development <strong>and</strong> Prevention Program, <strong>Children</strong>’s Aid Society of Toronto<br />
Beth Wilson<br />
Social Planning Toronto<br />
Jessica Mustachi<br />
Family Service Toronto (Ontario Campaign 2000)<br />
Manolli Ekra<br />
Ontario Council of Agencies Serving Immigrants<br />
michael kerr<br />
Colour of Poverty – Colour of Change<br />
Research <strong>and</strong> data analysis support provided by the <strong>City</strong> of Toronto is gratefully acknowledged. We also<br />
thank Well Living House <strong>and</strong> Seventh Generation Midwives for providing data from Our Health Counts.<br />
Special thanks to Dr. Janet Smylie, Director of Well Living House at St. Michaels Hospital; Sara Wolfe,<br />
Community Knowledge User at Seventh Generation Midwives Toronto; <strong>and</strong> Dr. Raglan Maddox, Post-<br />
Doctoral Fellow <strong>and</strong> Research Associate at St. Michaels Hospital for preparing Our Health Counts data<br />
<strong>and</strong> providing context.<br />
Financial support for this report was provided by the <strong>Children</strong>’s Aid Society of Toronto <strong>and</strong> the <strong>Children</strong>’s<br />
Aid Foundation’s Community Initiative Program. Design support was provided by Peter Grecco. We also<br />
thank Kharthika Mohanach<strong>and</strong>ran for her assistance with the preparation of the report.<br />
We would like to acknowledge that the l<strong>and</strong> on which this work was carried out is the traditional <strong>and</strong><br />
unceded territories of the Huron-Wendat, Anishinabek Nation, the Haudenosaunee Confederacy, the<br />
Mississaugas of the New Credit First Nation, <strong>and</strong> the Métis Nation, <strong>and</strong> is home to Indigenous people<br />
of many nations. This territory was the subject of the Dish With One Spoon Wampum Belt Covenant, an<br />
agreement between the Iroquois Confederacy <strong>and</strong> the Ojibwe <strong>and</strong> allied nations to peaceably share <strong>and</strong><br />
care for the resources around the Great Lakes. We hope to honour the spirit of the Dish With One Spoon<br />
agreement by working to build a nation-to-nation relationship with Indigenous communities in Toronto,<br />
as we seek to ensure that all families <strong>and</strong> children have access to needed services <strong>and</strong> supports.<br />
ii
UNEQUAL CITY:<br />
<strong>The</strong> <strong>Hidden</strong> <strong>Divide</strong> <strong>Among</strong> Toronto’s <strong>Children</strong> <strong>and</strong> <strong>Youth</strong><br />
2017 Toronto Child <strong>and</strong> Family Poverty Report Card<br />
Contents<br />
List of Figures<br />
iv<br />
Summary 1<br />
Introduction 2<br />
<strong>The</strong> High Cost of Poverty 3<br />
Government <strong>and</strong> Communities Can Make a Difference 4<br />
Recommendations to Toronto’s Mayor <strong>and</strong> <strong>City</strong> Council 5<br />
Key Findings 6<br />
Conclusions: Next Steps for Action on Child <strong>and</strong> Family Poverty in Toronto 20<br />
Appendix 1 – Note on Data Sources 22<br />
Appendix 2 – Selected Approved <strong>City</strong> Strategies 23<br />
Appendix 3 – Map of Toronto Census Metropolitan Area 24<br />
Appendix 4 – Map of Toronto Neighbourhoods 25<br />
Notes 26<br />
iii
UNEQUAL CITY:<br />
<strong>The</strong> <strong>Hidden</strong> <strong>Divide</strong> <strong>Among</strong> Toronto’s <strong>Children</strong> <strong>and</strong> <strong>Youth</strong><br />
2017 Toronto Child <strong>and</strong> Family Poverty Report Card<br />
List of Figures<br />
Figure 1: Percentage of children aged 0-17 years living in low-income families<br />
in large urban areas, 2015 6<br />
Figure 2: Percentage of population with low incomes by age category,<br />
municipalities & regions in the GTHA, 2015 7<br />
Figure 3: Annual percentage point change in children living in low-income<br />
families, <strong>City</strong> of Toronto, 1998-2015 8<br />
Figure 4: Percentage of non-racialized <strong>and</strong> racialized children aged 0-17<br />
in low-income families, Toronto Region (CMA), 2015 10<br />
Figure 5: Percentage of racialized children aged 0-17 living in low-income<br />
families by specific population group, Toronto Region (CMA), 2015 11<br />
Figure 6: Percentage of children aged 0-17 living in low-income families<br />
by immigration status, Toronto Region (CMA), 2015 12<br />
Figure 7: Percentage of children aged 0-17 living in low-income families<br />
by period of immigration, Toronto Region (CMA), 2015 13<br />
Figure 8: Percentage of racialized <strong>and</strong> non-racialized children aged 0-17 living<br />
in low-income families, by generation in Canada, Toronto Region (CMA), 2015 14<br />
Figure 9: Percentage of children aged 0-17 living in low-income families by<br />
ethno-racial group <strong>and</strong> generation in Canada, Toronto Region (CMA), 2015 15<br />
Figure 10: Percentage of children aged 0-17 living in low-income families<br />
by family structure <strong>and</strong> gender of parent, Toronto Region (CMA), 2015 16<br />
Figure 11: Percentage of children aged 0-17 living in low-income families<br />
by census tract, 2015 17<br />
Figure 12: Percentage of children aged 0-17 living in low-income families<br />
by Toronto neighbourhood, 2015 18<br />
Figure 13: Percentage change of children aged 0-17 living in low-income families<br />
by Toronto neighbourhood, 2010-2015 19<br />
iv
UNEQUAL CITY:<br />
<strong>The</strong> <strong>Hidden</strong> <strong>Divide</strong> <strong>Among</strong> Toronto’s <strong>Children</strong> <strong>and</strong> <strong>Youth</strong><br />
2017 Toronto Child <strong>and</strong> Family Poverty Report Card<br />
Summary<br />
This report draws on the Statistics Canada 2016 Census <strong>and</strong> other new data sources<br />
to describe the level, distribution <strong>and</strong> depth of poverty among Toronto children,<br />
youth <strong>and</strong> their families.<br />
Its main findings 1 are the following:<br />
- Indigenous families with children in the <strong>City</strong> of Toronto experience an<br />
extremely high poverty rate of 84%.<br />
- More than one in four children under 18 years of age (26.3%) live in poverty in<br />
the city of Toronto. This is the highest rate among large urban areas in Canada.<br />
- <strong>Children</strong> in racialized families 2 are more than twice as likely to be living in<br />
poverty compared to children in non-racialized families (25.3% compared<br />
to 11.4%) in the Toronto region (i.e., Census Metropolitan Area or CMA).<br />
- Almost one in two children who are of West Asian (46.8%) or Arab (46.7%) background live in poverty<br />
in the Toronto region. This is more than four times the rate of poverty of children in non-racialized<br />
families.<br />
- Almost one in two Toronto region children who arrived in Canada between 2011 <strong>and</strong> 2016 (47.2%)<br />
live in poverty. This is almost three times the rate of poverty experienced by children in non-immigrant<br />
families.<br />
- Child poverty rates for children who are second <strong>and</strong> third generation Canadian remain particularly high<br />
for Black <strong>and</strong> Latin American families in the Toronto region.<br />
- 37.8% of children in lone-parent families in the Toronto region live in poverty, while the rate for children<br />
in female lone-parent households is 40%, more than twice the poverty rate of two-parent families.<br />
- <strong>The</strong> gap in child poverty rates across Toronto neighbourhoods remains stark, ranging from 4.1%<br />
in Kingsway South to 60.1% in Thorncliffe Park.<br />
- Thirteen city wards have areas of child poverty where rates are 50% or more.<br />
As shown in this report, the divide in incomes along Indigenous, racial, immigration status, <strong>and</strong> gender lines<br />
is staggering. Rates of poverty for marginalized communities are several times what they are for others.<br />
As more than half of Toronto’s population identify as racialized (51.5%), this is a deep concern. Building<br />
a successful city must include providing the necessary measures to ensure no one is left behind <strong>and</strong> that<br />
systemic inequalities are addressed within <strong>City</strong> policies <strong>and</strong> programs.<br />
Addressing these inequities will require concerted effort. <strong>The</strong> <strong>City</strong> must work together with community<br />
partners to address systemic barriers present in <strong>City</strong> policies, programs <strong>and</strong> services. It must provide adequate<br />
funding to implement approved strategies, including the Poverty Reduction Strategy, the Toronto Newcomer<br />
Strategy, the <strong>Youth</strong> Equity Strategy <strong>and</strong> other relevant plans. <strong>The</strong> <strong>City</strong> must also pass the final Toronto Action<br />
Plan to Confront Anti-Black Racism which is expected to come forward to the Executive Committee <strong>and</strong> <strong>City</strong><br />
Council shortly, as well as create gender equity <strong>and</strong> racial justice strategies. Reducing racial, gendered <strong>and</strong><br />
other disparities <strong>and</strong> inequities must be a top priority if the <strong>City</strong> is committed to reducing child <strong>and</strong> family<br />
poverty in Toronto.<br />
1
UNEQUAL CITY:<br />
<strong>The</strong> <strong>Hidden</strong> <strong>Divide</strong> <strong>Among</strong> Toronto’s <strong>Children</strong> <strong>and</strong> <strong>Youth</strong><br />
2017 Toronto Child <strong>and</strong> Family Poverty Report Card<br />
Introduction<br />
Two years after the creation of TO Prosperity, Toronto’s Poverty Reduction Strategy 3 , our city continues to<br />
struggle to address the high rates of poverty experienced by children <strong>and</strong> youth. As <strong>City</strong> Manager, Peter<br />
Wallace, recently remarked during his 2017 state of city government speech, child poverty in Toronto<br />
is an “area of really big failure”. 4<br />
Indeed, as 2016 Census data reported below shows, more than one in four children under 18 years of age<br />
(26.3%) <strong>and</strong> more than one in four youth aged 18-24 years (27%) in the city of Toronto live in poverty.<br />
Even more concerning are the disproportionately high rates of poverty experienced by Indigenous children,<br />
racialized children <strong>and</strong> children who are recent immigrants, which reveal a disturbing picture of the different<br />
realities faced by children across the Toronto region.<br />
It is deeply concerning, in a city as wealthy as Toronto, that children from certain neighbourhoods <strong>and</strong><br />
populations have a 50% rate of poverty. This is not just a big failure, it is inexcusable.<br />
In a city whose motto is “Diversity Our Strength”, we must ask ourselves whether we are supporting this<br />
diversity if we are allowing children who are Indigenous, racialized or recent immigrants to live with rates<br />
of poverty that are several times higher than other children experience. If we truly are to be a city that finds<br />
strength in diversity, then we must acknowledge <strong>and</strong> reverse the continued shift toward a city where some<br />
have a lot <strong>and</strong> many have too little. We need to ask who is being included, <strong>and</strong> who is being left behind,<br />
when we speak of building a great city.<br />
We need to look at the root causes of poverty in Toronto <strong>and</strong> ask ourselves, how many more children need to<br />
live without safe housing, go to sleep hungry, <strong>and</strong> live without basic necessities, before we commit to action –<br />
such as funding the services <strong>and</strong> programs needed to reduce these unacceptable numbers? We all have the<br />
responsibility to hold the <strong>City</strong> <strong>and</strong> other orders of government accountable. We need real change: so many<br />
of our children, youth <strong>and</strong> families depend on it.<br />
2
UNEQUAL CITY:<br />
<strong>The</strong> <strong>Hidden</strong> <strong>Divide</strong> <strong>Among</strong> Toronto’s <strong>Children</strong> <strong>and</strong> <strong>Youth</strong><br />
2017 Toronto Child <strong>and</strong> Family Poverty Report Card<br />
<strong>The</strong> High Cost of Poverty<br />
<strong>The</strong> high rates of poverty among children outlined below are troubling. Much research now shows that<br />
poverty greatly impacts children’s life opportunities <strong>and</strong> life outcomes, <strong>and</strong> can contribute to a multigenerational<br />
cycle of poverty. 5<br />
In addition to causing hardship, poverty in Toronto necessitates the spending of billions of dollars on<br />
downstream health care, social services, child welfare, policing <strong>and</strong> incarceration costs – much of which could<br />
be avoided by investing in poverty reduction measures such as affordable housing, employment <strong>and</strong> training,<br />
<strong>and</strong> other supports. 6<br />
3
UNEQUAL CITY:<br />
<strong>The</strong> <strong>Hidden</strong> <strong>Divide</strong> <strong>Among</strong> Toronto’s <strong>Children</strong> <strong>and</strong> <strong>Youth</strong><br />
2017 Toronto Child <strong>and</strong> Family Poverty Report Card<br />
Government <strong>and</strong> Communities Can Make a Difference<br />
Federal <strong>and</strong> provincial governments have stepped up to the plate in recent years to address poverty reduction<br />
through the creation of child benefits, improvements to employment conditions <strong>and</strong> wages, <strong>and</strong> income<br />
supports. <strong>The</strong> findings from our research suggest that these government initiatives are making a modest<br />
difference in reducing overall poverty rates.<br />
As the front line deliverer of many services <strong>and</strong> a key policy maker, the <strong>City</strong> of Toronto has an important<br />
role to play in decreasing the rate of child <strong>and</strong> family poverty. In unanimously adopting its Poverty Reduction<br />
Strategy in 2015, the <strong>City</strong> took an important first step forward. However, while it has implemented some<br />
changes, including providing free public transit for children under 12 <strong>and</strong> exp<strong>and</strong>ing important nutrition<br />
<strong>and</strong> social-recreational programs for children <strong>and</strong> youth, much of the strategy’s proposed initiatives remain<br />
unfunded.<br />
<strong>The</strong> <strong>City</strong> of Toronto must commit to allocating revenue <strong>and</strong> coordinating resources to build a fairer <strong>and</strong><br />
equitable environment with improved equity of access to good jobs, housing, transit <strong>and</strong> other city services for<br />
all. In addition, <strong>City</strong> policies, programs <strong>and</strong> services must focus on the inequities experienced by Indigenous,<br />
racialized, children who are recent immigrants, <strong>and</strong> children in female lone-parent households, <strong>and</strong> commit<br />
to substantial funding, <strong>and</strong> clear timelines <strong>and</strong> targets for actions that will reduce the rates of poverty amongst<br />
these groups.<br />
<strong>The</strong> <strong>City</strong> of Toronto will soon launch the public process to determine its 2018 Budget. This is the last<br />
opportunity before the 2018 municipal election for Toronto’s Mayor <strong>and</strong> Council to invest in policies that<br />
reduce poverty <strong>and</strong> improve the lives <strong>and</strong> opportunities of all residents in this city. It is imperative that they<br />
take this opportunity to work together <strong>and</strong> make a strong commitment to ending child <strong>and</strong> family poverty<br />
in Toronto.<br />
By addressing poverty <strong>and</strong> inequality, we can, together, build a fairer, more equitable <strong>and</strong> unified city<br />
for everyone.<br />
<strong>The</strong> time for action is now.<br />
4
UNEQUAL CITY:<br />
<strong>The</strong> <strong>Hidden</strong> <strong>Divide</strong> <strong>Among</strong> Toronto’s <strong>Children</strong> <strong>and</strong> <strong>Youth</strong><br />
2017 Toronto Child <strong>and</strong> Family Poverty Report Card<br />
Recommendations to Toronto’s Mayor <strong>and</strong> <strong>City</strong> Council<br />
- Fully fund all of the <strong>City</strong>’s strategies that have been passed by Toronto <strong>City</strong> Council, including the<br />
TO Prosperity: Toronto Poverty Reduction Strategy, Toronto Newcomer Strategy, <strong>Youth</strong> Equity Strategy,<br />
Child Care Strategy, <strong>and</strong> Housing Opportunities Toronto.<br />
- Commit to implementing the Truth <strong>and</strong> Reconciliation Commission of Canada’s 94 Calls to Action<br />
as one approach to supporting Indigenous children <strong>and</strong> families.<br />
- Pass <strong>and</strong> fund the Toronto Action Plan to Confront Anti-Black Racism.<br />
- Create <strong>and</strong> fund Racial Justice <strong>and</strong> Gender Equity Strategies.<br />
- Consistently collect disaggregated demographic data – by gender identity, ethno-racial background,<br />
(dis)ability, sexuality, faith/spirituality, etc. – for all <strong>City</strong> programs <strong>and</strong> services.<br />
- Fully implement gender responsive budgeting for the <strong>City</strong> budget.<br />
- Create, fully fund <strong>and</strong> staff equity offices, including offices focused on Indigenous Peoples, gender,<br />
immigrants, accessibility, anti-black racism, <strong>and</strong> racial justice.<br />
5
UNEQUAL CITY:<br />
<strong>The</strong> <strong>Hidden</strong> <strong>Divide</strong> <strong>Among</strong> Toronto’s <strong>Children</strong> <strong>and</strong> <strong>Youth</strong><br />
2017 Toronto Child <strong>and</strong> Family Poverty Report Card<br />
Key Findings<br />
Below we outline the 14 key findings in the report.<br />
1. Toronto: Highest rate of child poverty among large Canadian cities<br />
Figure 1: Percentage of children aged 0-17 years living in low-income families in large urban areas, 2015<br />
Toronto<br />
Winnipeg<br />
22.9%<br />
Montréal<br />
22.6%<br />
Hamilton<br />
21.0%<br />
Greater Vancouver<br />
18.9%<br />
Peel<br />
18.1%<br />
Ottawa<br />
16.0%<br />
Waterloo<br />
15.3%<br />
York<br />
14.2%<br />
Edmonton<br />
13.3%<br />
Durham<br />
13.3%<br />
Calgary<br />
12.0%<br />
Halton<br />
10.5%<br />
Québec <strong>City</strong><br />
10.1%<br />
Source: Statistics Canada, 2016 Census of Population, Catalogue no. 98-400-X2016127.<br />
26.3%<br />
- According to the 2016 Census, 26% of children in the city of Toronto are experiencing poverty –<br />
the highest rate among large urban areas in Canada, a full 3.4 percentage points higher than<br />
the rate in second-place Winnipeg, <strong>and</strong> about twice as high as in Calgary <strong>and</strong> Edmonton.<br />
- In total, 125,675 children in the city of Toronto are living in low-income families.<br />
<strong>The</strong> low-income threshold used is the Low-Income Measure (After Tax)<br />
which is calculated as 50% of the median income adjusted for household<br />
size. “Large urban areas” are Census Divisions with populations greater than<br />
500,000. See “Note on Data Sources “ in Appendix 1 for further details.<br />
6
UNEQUAL CITY:<br />
<strong>The</strong> <strong>Hidden</strong> <strong>Divide</strong> <strong>Among</strong> Toronto’s <strong>Children</strong> <strong>and</strong> <strong>Youth</strong><br />
2017 Toronto Child <strong>and</strong> Family Poverty Report Card<br />
2. Toronto has the highest rate of low income in the Greater Toronto <strong>and</strong> Hamilton<br />
Area (GTHA) across all age groups<br />
Figure 2: Percentage of population with low incomes by age category, municipalities <strong>and</strong> regions in<br />
the GTHA, 2015<br />
Prevalance of low income (LIM-AT)<br />
30%<br />
25%<br />
20%<br />
15%<br />
10%<br />
5%<br />
26.3<br />
26.3 27.0<br />
18.0<br />
17.7<br />
17.4<br />
22.9<br />
20.2<br />
17.8<br />
14.0<br />
13.7<br />
11.6<br />
19.3<br />
17.6<br />
12.8<br />
11.7<br />
9.5 10.3<br />
14.4<br />
14.1<br />
12.0<br />
11.4<br />
11.2<br />
11.5<br />
13.7<br />
13.1<br />
9.1<br />
8.7<br />
8.8<br />
8.2<br />
9.2 11.0<br />
8.3<br />
7.4<br />
7.6<br />
7.3<br />
0%<br />
Toronto Hamilton Peel York Durham Halton<br />
Under 6 years 6 to 17 years 18 to 24 years 25 to 54 years 55 to 64 years 65 years <strong>and</strong> over<br />
Source: Statistics Canada, 2016 Census of Population, Catalogue no. 98-400-X2016127.<br />
- Toronto has the highest poverty rates among cities <strong>and</strong> regions in the Greater Toronto <strong>and</strong> Hamilton<br />
Area across all age groups.<br />
- Toronto children (ages 0-17 years) <strong>and</strong> youth (ages 18-24 years) experience significantly higher rates<br />
of poverty than adults <strong>and</strong> seniors.<br />
7
1998<br />
UNEQUAL CITY:<br />
<strong>The</strong> <strong>Hidden</strong> <strong>Divide</strong> <strong>Among</strong> Toronto’s <strong>Children</strong> <strong>and</strong> <strong>Youth</strong><br />
2017 Toronto Child <strong>and</strong> Family Poverty Report Card<br />
3. <strong>The</strong>re has been a recent decline in Toronto’s child poverty rate but limited progress<br />
over the longer term<br />
Figure 3: Annual percentage point change in children living in low-income families, <strong>City</strong> of Toronto,<br />
1998-2015<br />
5%<br />
4%<br />
3%<br />
Percentage Point Change<br />
2%<br />
1%<br />
0%<br />
-1%<br />
-2%<br />
-3%<br />
-0.7<br />
0.4<br />
1.3<br />
-0.4<br />
0.6<br />
2.0<br />
0.9<br />
-4%<br />
-5%<br />
2005<br />
2004<br />
2003<br />
2002<br />
2001<br />
2000<br />
1999<br />
-0.9<br />
-1.7<br />
-0.4 -0.2 -0.3<br />
2007<br />
2006<br />
Years<br />
2013<br />
2012<br />
2011<br />
2010<br />
2009<br />
2008<br />
-2.2<br />
1.7<br />
0.5<br />
-0.1<br />
-1.8<br />
-2.5<br />
Source: Statistics Canada, T1 Family File, 1997-2015, Table F-18 - Low Income (LIM-AT).<br />
2015<br />
2014<br />
- According to Statistics Canada T1 Family File (T1FF), the low-income rate among children under<br />
the age of 18 in the <strong>City</strong> of Toronto decreased for the second year in a row in 2015.<br />
- <strong>The</strong> decline in Toronto mirrors declines in many other Ontario <strong>and</strong> Canadian cities, <strong>and</strong> is likely related<br />
to improvements in provincial <strong>and</strong> federal policies. 7<br />
8
UNEQUAL CITY:<br />
<strong>The</strong> <strong>Hidden</strong> <strong>Divide</strong> <strong>Among</strong> Toronto’s <strong>Children</strong> <strong>and</strong> <strong>Youth</strong><br />
2017 Toronto Child <strong>and</strong> Family Poverty Report Card<br />
4. High rates of poverty among Indigenous children <strong>and</strong> families<br />
Due to concerns about the accuracy of the Canadian Census in relation to capturing low-income rates<br />
in Toronto’s Indigenous population, we have drawn data from Our Health Counts Toronto, an inclusive<br />
community-driven population health survey for Indigenous residents of Toronto. 8 <strong>The</strong> survey used<br />
respondent-driven sampling <strong>and</strong> a large-scale survey of the urban Indigenous population. It demonstrates<br />
<strong>and</strong> addresses weaknesses with the Canadian Census, which underestimates the size of the Indigenous<br />
population in Toronto by a factor of two to four. 9<br />
of Indigenous families<br />
with children are low-income<br />
More than 8 in 10 Indigenous families are living in poverty in Toronto.<br />
Poverty is a devastating lived reality for Indigenous children in Toronto. According to Our Health Counts<br />
Toronto, approximately 84% (with a 95% Confidence Interval 10 of 77.4-90.9%) of Indigenous families with<br />
children under the age of 18 were found to be living below the before-tax Low Income Cut-off (LICO) in<br />
2014-2015. 11 <strong>The</strong> burden of poverty in Indigenous communities is crushing, exacerbating intergenerational<br />
legacies of trauma <strong>and</strong> keeping Indigenous children <strong>and</strong> families cycling through crisis <strong>and</strong> instability.<br />
Even under the most conservative assumptions, Our Health Counts Toronto estimated the Indigenous 12<br />
population in Toronto to be between 55,000–74,000 (2.1-2.8% of the Toronto population) 13 ; approximately<br />
double the census estimate of 23,065. 14 Of this Indigenous population, 10,000-14,000 were Indigenous children<br />
aged under 15 years. <strong>The</strong> undercounting in the Census is due to a number of Indigenous data quality<br />
challenges, including misclassification errors <strong>and</strong> non-response bias which systematically contributes to<br />
a significant underestimate of inequities between Indigenous <strong>and</strong> non-Indigenous peoples in Canada. 15<br />
9
UNEQUAL CITY:<br />
<strong>The</strong> <strong>Hidden</strong> <strong>Divide</strong> <strong>Among</strong> Toronto’s <strong>Children</strong> <strong>and</strong> <strong>Youth</strong><br />
2017 Toronto Child <strong>and</strong> Family Poverty Report Card<br />
5. High rates of poverty among racialized children<br />
Figure 4: Percentage of non-racialized <strong>and</strong> racialized children aged 0-17<br />
in low-income families, Toronto Region (CMA), 2015<br />
30%<br />
25%<br />
20%<br />
25.3%<br />
15%<br />
10%<br />
11.4%<br />
5%<br />
0%<br />
Non-racialized<br />
Racialized<br />
Source: Statistics Canada, 2016 Census of Population, Catalogue no. 98-400-X2016211.<br />
- <strong>Children</strong> in racialized families in the Toronto region are more than twice as<br />
likely to be living in poverty compared to children in non-racialized families.<br />
Due to data availability, low-income rates in Figures 4 to 10 are reported at the<br />
Toronto Region Census Metropolitan Area (CMA). See map in Appendix 3.<br />
All other maps <strong>and</strong> figures are reported at the level of the <strong>City</strong> of Toronto.<br />
We define “racialized” (or “peoples of colour”) as the equivalent to Statistics<br />
Canada’s “visible minorities”. Visible minorities, as defined in the federal Employment<br />
Equity Act, refer to “persons, other than Aboriginal persons, who are non-Caucasian<br />
in race or non-white in colour”. <strong>The</strong> visible minority population consists mainly of<br />
the following groups: South Asian, Chinese, Black, Filipino, Latin American, Arab,<br />
Southeast Asian, West Asian, Korean <strong>and</strong> Japanese.<br />
http://www12.statcan.gc.ca/nhs-enm/2011/as-sa/99-010-x/99-010-x2011001-eng.cfm#a4<br />
Statistics Canada includes individuals who identify as a member of an Indigenous<br />
group as well as people who identify as white in the non-racialized (or non-visible<br />
minority) group. According to Statistics Canada, the Indigenous population represents<br />
1.6% of the non-racialized group in the Toronto region. As shown later in the report,<br />
the child poverty rate for the non-racialized group does not reflect the experience of<br />
the Indigenous population.<br />
10
UNEQUAL CITY:<br />
<strong>The</strong> <strong>Hidden</strong> <strong>Divide</strong> <strong>Among</strong> Toronto’s <strong>Children</strong> <strong>and</strong> <strong>Youth</strong><br />
2017 Toronto Child <strong>and</strong> Family Poverty Report Card<br />
6. High rates of poverty among children of certain ethno-racial backgrounds<br />
Figure 5: Percentage of racialized children aged 0-17 living in low-income families by specific population<br />
group, Toronto Region (CMA), 2015<br />
50% 46.8% 46.7%<br />
40%<br />
30%<br />
20%<br />
10%<br />
32.8%<br />
29.5% 28.0%<br />
23.1% 23.1% 21.4%<br />
12.0% 9.5%<br />
0%<br />
West Asian<br />
Arab<br />
Black<br />
Korean<br />
Latin American<br />
South Asian<br />
Southeast Asian<br />
Chinese<br />
Japanese<br />
Filipino<br />
Source: Statistics Canada, 2016 Census of Population, Catalogue no. 98-400-X2016124.<br />
- 47% of children in families of Arab <strong>and</strong> West Asian backgrounds are living in poverty, more than<br />
four times the proportion of children in non-racialized families who are living on low incomes.<br />
- Poverty rates for children in Black families are almost three times that of children in non-racialized<br />
families.<br />
Statistics Canada collects information about ethno-racial <strong>and</strong> specific population groups in accordance with the<br />
federal Employment Equity Act. <strong>The</strong>se groups should not be confused with citizenship or nationality. According<br />
to Statistics Canada, the South Asian group includes individuals who are East Indian, Pakistani, Sri Lankan, etc.<br />
<strong>The</strong> Southeast Asian group includes individuals who are Vietnamese, Cambodian, Laotian, Thai, etc. <strong>The</strong> West<br />
Asian group includes individuals who are Iranian, Afghan, etc. <strong>The</strong> Latin American group includes individuals<br />
who are Chilean, Columbian, Salvadorean, Brazilian, etc.<br />
11
UNEQUAL CITY:<br />
<strong>The</strong> <strong>Hidden</strong> <strong>Divide</strong> <strong>Among</strong> Toronto’s <strong>Children</strong> <strong>and</strong> <strong>Youth</strong><br />
2017 Toronto Child <strong>and</strong> Family Poverty Report Card<br />
7. High rates of poverty among immigrant <strong>and</strong> non-permanent<br />
resident children<br />
Figure 6: Percentage of children aged 0-17 living in low-income families<br />
by immigration status, Toronto Region (CMA), 2015<br />
60%<br />
50%<br />
50.4%<br />
40%<br />
35.6%<br />
30%<br />
20%<br />
16.7%<br />
10%<br />
0%<br />
Non-immigrants<br />
Immigrants<br />
Non-permanent<br />
residents<br />
Source: Statistics Canada, 2016 Census of Population, Catalogue no. 98-400-X2016124.<br />
- One in two children who are non-permanent residents in the Toronto region are<br />
living in a low-income situation.<br />
- <strong>Children</strong> who were born outside of Canada are twice as likely to be living<br />
in poverty as their non-immigrant counterparts.<br />
“Immigrant” as defined by Statistics Canada refers to a person who is, or who has ever been, a<br />
l<strong>and</strong>ed immigrant or permanent resident. Immigrants who have obtained Canadian citizenship<br />
by naturalization are included in this group. People who are not Canadian citizens by birth,<br />
<strong>and</strong> who answered “no” to the immigrant status question, are considered to be non-permanent<br />
residents. “Non-permanent residents” include persons from another country who have a work<br />
or study permit or who are refugee claimants, <strong>and</strong> their family members are sharing the same<br />
permit <strong>and</strong> living in Canada with them.<br />
http://www12.statcan.gc.ca/census-recensement/2016/ref/guides/007/98-500-x2016007-eng.cfm<br />
12
UNEQUAL CITY:<br />
<strong>The</strong> <strong>Hidden</strong> <strong>Divide</strong> <strong>Among</strong> Toronto’s <strong>Children</strong> <strong>and</strong> <strong>Youth</strong><br />
2017 Toronto Child <strong>and</strong> Family Poverty Report Card<br />
8. Higher rates of child poverty among recent immigrants<br />
Figure 7: Percentage of children aged 0-17 living in low-income families by period<br />
of immigration, Toronto Region (CMA), 2015<br />
50% 47.2%<br />
40%<br />
30%<br />
20%<br />
28.5%<br />
21.9%<br />
20.2%<br />
10%<br />
0%<br />
2011-2016 2006-2010 2001-2005<br />
1991-2000<br />
Source: Statistics Canada, 2016 Census of Population, Catalogue no. 98-400-X2016124.<br />
- Almost one in two children who are recent immigrants (arriving between<br />
2011 <strong>and</strong> 2016) in the Toronto region live in poverty.<br />
- <strong>The</strong> low-income rate among children in the Toronto region who have been<br />
living in Canada between 5 <strong>and</strong> 10 years is significantly lower than that of<br />
those still in their first 5 years in the country; however, the low-income rate<br />
for immigrant children remains higher that of non-immigrants even among<br />
children who have been in Canada for 10 to 15 years.<br />
13
UNEQUAL CITY:<br />
<strong>The</strong> <strong>Hidden</strong> <strong>Divide</strong> <strong>Among</strong> Toronto’s <strong>Children</strong> <strong>and</strong> <strong>Youth</strong><br />
2017 Toronto Child <strong>and</strong> Family Poverty Report Card<br />
9. Higher rates of poverty for racialized children persist across<br />
generations<br />
Figure 8: Percentage of racialized <strong>and</strong> non-racialized children aged 0-17 living in<br />
low-income families, by generation in Canada, Toronto Region (CMA), 2015<br />
40% 37.9%<br />
35%<br />
30% 28.1%<br />
25%<br />
22.3%<br />
20%<br />
15%<br />
13.3%<br />
15.9%<br />
10%<br />
8.4%<br />
5%<br />
0%<br />
1st generation 2nd generation 3rd generation<br />
Source: Statistics Canada, 2016 Census of Population, Catalogue no. 98-400-X2016211.<br />
Non-racialized<br />
Racialized<br />
- Racialized children in first generation, second generation <strong>and</strong> third or more<br />
generation families in the Toronto region experience elevated rates of poverty<br />
compared to non-racialized children.<br />
First generation refers to people who were born outside Canada. It also includes any<br />
non-Canadian-born family members living with them in Canada. Also included in<br />
the first generation are Canadian citizens by birth (i.e., people born outside Canada to<br />
parents who are Canadian citizens). Second generation includes individuals who were<br />
born in Canada <strong>and</strong> had at least one parent born outside Canada. Third generation<br />
or more refers to people who are born in Canada with both parents born in Canada.<br />
14
UNEQUAL CITY:<br />
<strong>The</strong> <strong>Hidden</strong> <strong>Divide</strong> <strong>Among</strong> Toronto’s <strong>Children</strong> <strong>and</strong> <strong>Youth</strong><br />
2017 Toronto Child <strong>and</strong> Family Poverty Report Card<br />
10. Higher rates of child poverty across generations for immigrant children in families<br />
of particular ethno-racial backgrounds<br />
Figure 9: Percentage of children aged 0-17 living in low-income families by ethno-racial group <strong>and</strong><br />
generation in Canada, Toronto Region (CMA), 2015<br />
70%<br />
60%<br />
50%<br />
40%<br />
30%<br />
20%<br />
10%<br />
0%<br />
61.8<br />
39.5<br />
West Asian<br />
21.7<br />
59.8<br />
34.8<br />
Arab<br />
11.8<br />
50.1<br />
23.0<br />
Korean<br />
3.8<br />
40.631.8<br />
30.0<br />
39.3<br />
Black<br />
18.0<br />
Chinese<br />
4.7<br />
South Asian<br />
Latin American<br />
Japanese<br />
Southeast Asian<br />
1st generation 2nd generation 3rd generation or more<br />
33.4<br />
Source: Statistics Canada, 2016 Census of Population, Catalogue no. 98-400-X2016211.<br />
20.6<br />
6.2<br />
33.1<br />
26.5<br />
22.6<br />
30.6<br />
12.3<br />
3.5<br />
30.5<br />
22.1<br />
17.0 16.9<br />
- More than one in two (over 50%) of first generation children from West Asian, Arab <strong>and</strong> Korean<br />
backgrounds live in poverty in the Toronto region.<br />
- Child poverty rates in many of the groups fall significantly from first generation to second <strong>and</strong> third<br />
generation in Canada; however for some ethno-racial groups (Black, Latin America <strong>and</strong> Southeast<br />
Asian) the persistence of child poverty does not dramatically decline.<br />
Filipino<br />
6.7 5.6<br />
15
UNEQUAL CITY:<br />
<strong>The</strong> <strong>Hidden</strong> <strong>Divide</strong> <strong>Among</strong> Toronto’s <strong>Children</strong> <strong>and</strong> <strong>Youth</strong><br />
2017 Toronto Child <strong>and</strong> Family Poverty Report Card<br />
11. <strong>Children</strong> in female-led lone-parent families most at risk of poverty<br />
Figure 10: Percentage of children aged 0-17 living in low-income families by family<br />
structure <strong>and</strong> gender of parent, Toronto Region (CMA), 2015<br />
45%<br />
40%<br />
35%<br />
30%<br />
25%<br />
20%<br />
15%<br />
10%<br />
5%<br />
0%<br />
15.3%<br />
Two-parent<br />
families<br />
37.8%<br />
Lone-parent<br />
families<br />
24.4%<br />
Male lone-parent<br />
families<br />
Source: Statistics Canada, 2016 Census of Population, Catalogue no. 98-400-X2016124.<br />
40.0%<br />
Female lone-parent<br />
families<br />
- <strong>Children</strong> in lone-parent families in the Toronto region (of which 82.8% are led<br />
by women) experience much higher levels of poverty than children in two-parent<br />
families.<br />
- 40% of female-led lone-parent families live in poverty in comparison to 24%<br />
of male-led lone-parent families.<br />
- <strong>Children</strong> in larger families (i.e., families with more children) also experience higher<br />
levels of poverty, particularly in lone-parent families.<br />
Due to the gender wage gap, women’s salaries are, on average, lower than<br />
men’s, which contributes to an increased risk of living in poverty. <strong>The</strong> wage<br />
gap for women in Toronto is 77%, equaling a difference of $9,000 between<br />
the annual wages of women <strong>and</strong> men. 16<br />
16
UNEQUAL CITY:<br />
<strong>The</strong> <strong>Hidden</strong> <strong>Divide</strong> <strong>Among</strong> Toronto’s <strong>Children</strong> <strong>and</strong> <strong>Youth</strong><br />
2017 Toronto Child <strong>and</strong> Family Poverty Report Card<br />
12. Child poverty rates by census tract in Toronto<br />
Figure 11: Percentage of children aged 0-17 living in low-income families by census tract, 2015<br />
1<br />
7<br />
8<br />
10<br />
23<br />
24<br />
33<br />
39<br />
41<br />
42<br />
2<br />
9<br />
40<br />
12<br />
15<br />
16<br />
25<br />
34<br />
37<br />
38<br />
43<br />
44<br />
4<br />
11<br />
3<br />
6<br />
5<br />
13<br />
14<br />
17<br />
19<br />
21<br />
20<br />
22<br />
27<br />
28<br />
30<br />
29<br />
26<br />
31<br />
18<br />
2.4% to 12.5%<br />
32<br />
35<br />
36<br />
4<br />
Km<br />
0 1 2 3 Ward boundaries<br />
LIM-AT 0 to 17 years<br />
12.6% to 25.0%<br />
25.1% to 37.5%<br />
37.6% to 50.0%<br />
50.1% to 72.3%<br />
No data<br />
N<br />
Source: Statistics Canada, Census of Population 2016, Census profile data table.<br />
- Thirteen Toronto wards contain census tracts with child poverty rates above 50%: Ward 2, Ward 7,<br />
Ward 8, Ward 12, Ward 15, Ward 23, Ward 26, Ward 27, Ward 28, Ward 35, Ward 36, Ward 38<br />
<strong>and</strong> Ward 43 (see shaded Ward labels on the above map).<br />
- Census tracts with child low-income rates above 50% have populations with above-average percentages<br />
of racialized children, recent immigrants, <strong>and</strong> lone-parent families.<br />
17
UNEQUAL CITY:<br />
<strong>The</strong> <strong>Hidden</strong> <strong>Divide</strong> <strong>Among</strong> Toronto’s <strong>Children</strong> <strong>and</strong> <strong>Youth</strong><br />
2017 Toronto Child <strong>and</strong> Family Poverty Report Card<br />
13. Neighbourhood disparities in the rate of child poverty<br />
Figure 12: Percentage of children aged 0-17 living in low-income families by Toronto neighbourhood, 2015<br />
11<br />
27<br />
32<br />
46<br />
29 31 28 27<br />
29<br />
39<br />
33<br />
22<br />
33<br />
33<br />
19<br />
41 30<br />
31 24<br />
27<br />
35<br />
22<br />
28<br />
14<br />
35<br />
32<br />
36<br />
28<br />
15<br />
21<br />
15<br />
29<br />
9<br />
32<br />
40<br />
49 22<br />
5<br />
40<br />
26 24<br />
12 16<br />
28<br />
24<br />
36<br />
6<br />
24<br />
37 41 20 16<br />
35<br />
33<br />
10<br />
23<br />
25<br />
18<br />
7<br />
49<br />
15<br />
9 13<br />
21 12<br />
11<br />
6 60<br />
31<br />
37<br />
25 14<br />
12<br />
32 29<br />
13<br />
12<br />
29<br />
13<br />
15<br />
4<br />
6<br />
9 28<br />
23<br />
19<br />
14 16<br />
15<br />
15<br />
44<br />
7 10<br />
55<br />
22<br />
20 11 16 48<br />
18<br />
16<br />
12<br />
20 8 28<br />
13<br />
14<br />
18<br />
13 43<br />
21<br />
19<br />
33<br />
37<br />
50<br />
58<br />
7<br />
37<br />
20<br />
22 25<br />
9<br />
21<br />
26<br />
19<br />
30<br />
29<br />
15<br />
30<br />
30<br />
36 16<br />
32 37<br />
9<br />
36<br />
39<br />
9<br />
47<br />
25<br />
Proportion of <strong>Children</strong> (
UNEQUAL CITY:<br />
<strong>The</strong> <strong>Hidden</strong> <strong>Divide</strong> <strong>Among</strong> Toronto’s <strong>Children</strong> <strong>and</strong> <strong>Youth</strong><br />
2017 Toronto Child <strong>and</strong> Family Poverty Report Card<br />
-1.2<br />
-1.2<br />
0.1<br />
-3.8<br />
14. Neighbourhood change in percentage of children living in low-income families<br />
(2010-2015)<br />
Figure 13: Percentage change of children aged 0-17 living in low-income families by Toronto neighbourhood,<br />
2010-2015<br />
-4.5<br />
-1.8<br />
-2.2<br />
-3.8<br />
-3.1<br />
-1.7<br />
-4.2<br />
-1.9<br />
-2.4<br />
-3<br />
-1.7<br />
0.1<br />
0.6<br />
-3.8<br />
-0.1<br />
-5.2<br />
-3.3<br />
-1.2<br />
-2.1<br />
-0.9<br />
0.9<br />
-0.2<br />
-0.7<br />
-0.1<br />
-0.8 -2.7<br />
-1.1<br />
-3.4<br />
-2.7<br />
-0.3<br />
-1.1<br />
-1.5<br />
-3.5<br />
-1.9<br />
-4.8<br />
-6<br />
-0.4<br />
-1<br />
-1.8<br />
-3.6<br />
-1.5<br />
0.1<br />
-0.5<br />
-1.9<br />
0.5<br />
-1.6<br />
-3.3<br />
-1<br />
-3.6 -1 -2<br />
-2.4<br />
0.1<br />
-0.7<br />
-0.9<br />
-2.5 -3.2<br />
-1.3<br />
0.6<br />
-2.6<br />
-0.9<br />
-5.6 -2.9<br />
-2.3<br />
-0.1 0.6<br />
0<br />
-4.6<br />
-1.7<br />
-0.7<br />
1.1<br />
-0.9<br />
1.6<br />
-5<br />
-3.1 -1.5<br />
-3.4<br />
-0.2 -4.4<br />
-5.1<br />
-2.5 -2.4<br />
-4.3<br />
-3.3<br />
-3.7<br />
-3.1 -6.7<br />
-5.4<br />
-7 -4.9 -2.5 -3.3<br />
-4.1<br />
-1.1<br />
-2<br />
-5.3 -4.7 -7.9<br />
-5.7 3.9<br />
-7.2<br />
-3.8<br />
-1.4 -6.3 -3.6<br />
-4.8<br />
-6.6<br />
-4.8<br />
-3.1<br />
-5.2<br />
-4.7<br />
-3.5 -2.6<br />
-2.1<br />
-2.5<br />
-3.9<br />
-2.8<br />
-3.2<br />
-2.3<br />
N<br />
2.1<br />
-1.3<br />
1.3<br />
-2.3<br />
0 1 2 3 4<br />
Km<br />
-2.5<br />
1.5<br />
4.2<br />
-1.7<br />
0.2<br />
0<br />
-0.5<br />
-1<br />
0.1<br />
-0.5<br />
0.7<br />
-0.1<br />
Change 2010-2015<br />
-7.9% to -5.5%<br />
-5.4% to -3.0%<br />
-2.9% to -0.5%<br />
-0.4% to +0.5%<br />
+0.6% to +4.2%<br />
0.3<br />
Source: Statistics Canada, T1 Family File, table 18, 2010 & 2015<br />
- Between 2010 <strong>and</strong> 2015, low-income rates among children have decreased significantly in many<br />
downtown <strong>and</strong> southern Etobicoke neighbourhoods, while low-income rates have remained the<br />
same or increased in a number of Scarborough <strong>and</strong> other inner-suburb neighbourhoods.<br />
- <strong>The</strong> most significant percentage point decrease in child poverty was in Blake-Jones (7.9%),<br />
while the most significant percentage point increase was in Milliken (4.2%).<br />
19
UNEQUAL CITY:<br />
<strong>The</strong> <strong>Hidden</strong> <strong>Divide</strong> <strong>Among</strong> Toronto’s <strong>Children</strong> <strong>and</strong> <strong>Youth</strong><br />
2017 Toronto Child <strong>and</strong> Family Poverty Report Card<br />
Conclusions: Next Steps for Action on Child <strong>and</strong> Family<br />
Poverty in Toronto<br />
Toronto is Canada’s wealthiest city, but as this report shows Toronto’s children <strong>and</strong> youth are carrying<br />
an unequal burden of living in poverty:<br />
- Indigenous families in Toronto are experiencing an extremely high poverty rate of 84%.<br />
- Toronto region children in racialized families are more than twice as likely to be living in poverty<br />
compared to children in non-racialized families.<br />
- <strong>Children</strong> of West Asian, Arab, Black <strong>and</strong> Korean backgrounds are experiencing poverty rates<br />
three to four times higher than that of non-racialized children.<br />
- Toronto has the highest rate of child poverty among large urban areas in Canada.<br />
- Almost one in two Toronto region children who arrived in Canada between 2011 <strong>and</strong> 2016 (47.2%)<br />
live in poverty.<br />
<strong>The</strong> evidence is clear: we are in need of urgent action to end child <strong>and</strong> family poverty now.<br />
As we highlighted in our 2016 report <strong>Divide</strong>d <strong>City</strong> 17 , inequality of incomes translates into inequitable access<br />
to basic supports <strong>and</strong> services – such as education, good housing, social <strong>and</strong> recreational opportunities, child<br />
care <strong>and</strong> early learning programs, <strong>and</strong> decent transit services – all of which are crucial to the success <strong>and</strong><br />
well-being of children <strong>and</strong> their families.<br />
Indeed, unacceptably long waiting lists continue in Toronto for rent-geared-to-income subsidized housing<br />
(100,000 households), child care subsidies (15,000 children) <strong>and</strong> recreation programs (190,000 registrants). 18<br />
What must be done to improve the futures of children <strong>and</strong> families in Toronto?<br />
A United Way Toronto & York Region report recently called for a three-fold strategy to reduce inequality:<br />
better opportunities for young people, a fairer labour market, <strong>and</strong> action to reduce systemic barriers to success<br />
faced by marginalized groups. 19<br />
Reports from UNICEF have stated that a key to reducing child poverty is to invest in income support<br />
programs <strong>and</strong> public services. 20<br />
Toronto is well positioned to take action in these areas <strong>and</strong> indeed has made clear commitments to do so.<br />
In recent years the <strong>City</strong> has developed, <strong>and</strong> <strong>City</strong> Council has overwhelmingly approved, a range of strategies<br />
to improve access to training <strong>and</strong> good jobs, as well as key supports <strong>and</strong> services, by those who face the most<br />
barriers to success (see Appendix 2). However, many of these strategies have not been implemented because<br />
they have not been fully funded.<br />
In the coming months, Toronto <strong>City</strong> Council will make key decisions related to these strategies. Within the<br />
2018 <strong>City</strong> Budget, it will decide whether or not to fully fund Toronto’s poverty reduction strategy – <strong>and</strong><br />
related housing, transit, child care, newcomer, <strong>and</strong> youth strategies, among others. <strong>The</strong> deep divide revealed<br />
in this report should be evidence enough that it is time for strong leadership <strong>and</strong> action by Council to ensure<br />
the necessary programs <strong>and</strong> services are funded to start reducing the poverty that is experienced by so many<br />
of our children <strong>and</strong> youth.<br />
20
UNEQUAL CITY:<br />
<strong>The</strong> <strong>Hidden</strong> <strong>Divide</strong> <strong>Among</strong> Toronto’s <strong>Children</strong> <strong>and</strong> <strong>Youth</strong><br />
2017 Toronto Child <strong>and</strong> Family Poverty Report Card<br />
<strong>City</strong> staff have calculated that funding 12 key strategies that <strong>City</strong> Council has already adopted to address<br />
inequality <strong>and</strong> poverty would cost $66 million (not including funding of Housing Opportunities Toronto,<br />
which may be partly supported at the provincial level). This investment – less than 1% of the <strong>City</strong>’s operating<br />
budget – would be impactful: it would help improve access to better jobs, housing, transit, child care,<br />
recreation <strong>and</strong> other key programs for upwards of 50,000 people.<br />
<strong>The</strong> <strong>City</strong> must fund the strategies it has adopted (including the TO Prosperity: Toronto Poverty Reduction<br />
Strategy, Toronto Newcomer Strategy, <strong>Youth</strong> Equity Strategy, Child Care Strategy <strong>and</strong> Housing Opportunities<br />
Toronto) to start closing the growing income gaps in our city. It must also create <strong>and</strong> fund a Racial Justice<br />
Strategy <strong>and</strong> Gender Equity Strategy to address the specific issues facing these groups, <strong>and</strong> adopt a finalized<br />
version of the Toronto Action Plan to Confront Anti-Black Racism <strong>The</strong> unequal distribution of poverty among<br />
neighbourhoods <strong>and</strong> populations outlined in this report underscores the urgency for these targeted strategies<br />
to be funded. <strong>The</strong>re is no time to wait.<br />
To address Indigenous poverty, the <strong>City</strong> must also commit to implementing the Truth <strong>and</strong> Reconciliation<br />
Commission of Canada’s 94 Calls to Action as one approach to supporting Indigenous children <strong>and</strong> families.<br />
It should work with Indigenous communities <strong>and</strong> leaders to implement <strong>and</strong> resource relevant solutions<br />
to poverty.<br />
In addition, Toronto <strong>City</strong> Council needs to directly address the systemic inequalities that are experienced in<br />
this city. One important step would be for the <strong>City</strong> to create <strong>and</strong> fund equity offices including offices focused<br />
on Indigenous Peoples, gender, newcomers <strong>and</strong> immigrants, accessibility needs, anti-black racism, <strong>and</strong> racial<br />
justice. <strong>The</strong>se offices would work to ensure that equity issues <strong>and</strong> solutions to growing inequities are kept<br />
front <strong>and</strong> centre in decision-making, policy creation, <strong>and</strong> program <strong>and</strong> service implementation at the <strong>City</strong><br />
of Toronto. To be effective, they will require full funding <strong>and</strong> adequate staffing to achieve their respective<br />
goals. Through these offices, the <strong>City</strong> can make structural <strong>and</strong> targeted changes that will allow it to better<br />
take action on the deep <strong>and</strong> specific inequities identified in this report.<br />
As well, the <strong>City</strong> should move ahead with collecting disaggregated demographic data – by gender identity,<br />
ethno-racial background, (dis)ability, sexuality, faith/spirituality, etc. – for all <strong>City</strong> programs <strong>and</strong> services.<br />
And finally, the <strong>City</strong> should fulfill its promise to fully implementing a gender responsive budget within<br />
the <strong>City</strong> budget process.<br />
Poverty is not inevitable. It should not be the reality for children <strong>and</strong><br />
youth in Toronto. <strong>The</strong> choices we make, as a city, can prevent <strong>and</strong><br />
reduce poverty.<br />
In 2018, Toronto’s budget <strong>and</strong> its subsequent municipal election will<br />
provide an opportunity to engage in deep discussions about not only<br />
the kind of city we want to live in, but also how we are going to build<br />
that city – a city free from poverty <strong>and</strong> free from inequality <strong>and</strong><br />
inequities, where all children are supported.<br />
Now is the time to work together to rebuild a city where all children,<br />
youth <strong>and</strong> families have the opportunity to succeed.<br />
21
UNEQUAL CITY:<br />
<strong>The</strong> <strong>Hidden</strong> <strong>Divide</strong> <strong>Among</strong> Toronto’s <strong>Children</strong> <strong>and</strong> <strong>Youth</strong><br />
2017 Toronto Child <strong>and</strong> Family Poverty Report Card<br />
Appendix 1 – Note on Data Sources<br />
Statistics Canada has no official, government-m<strong>and</strong>ated poverty line. <strong>The</strong> Low-Income Measure – After Tax<br />
(LIM-AT) employed in this report was chosen as it is considered the best available statistic, collected annually<br />
at the local level.<br />
This report uses income data from Statistics Canada T1 Family File (T1FF), the 2016 Census <strong>and</strong> Our Health<br />
Counts Toronto (a survey of Indigenous people).<br />
<strong>The</strong> T1FF survey is based on “Tax-filer” data collected from income tax returns <strong>and</strong> Canada Child Tax<br />
Benefit (CCTB) <strong>and</strong> Canada Child Benefit (CCB) records. <strong>The</strong>re is a two-year lag in the data available from<br />
Statistics Canada <strong>and</strong> thus the low-income rates reported here are based on 2015 data.<br />
Tax-filer data operates on the concept of the Census family rather than a household. Statistics Canada<br />
constructs households <strong>and</strong> family income levels by matching individual tax files through family income<br />
calculations, <strong>and</strong> does not include income from other relatives living in the same household. LIM-AT<br />
is calculated as 50% of median after-tax income of family or household incomes to those of others, allowing<br />
for size of the family unit. In 2015, the LIM-AT thresholds for use with Tax-filer data were $25,498 for<br />
a family of one parent with one child 16 years or younger <strong>and</strong> $36,426 for a family with two adults <strong>and</strong><br />
two children. 21<br />
According to Statistics Canada, Tax-filer data provide a useful way of looking at trends over time <strong>and</strong><br />
comparing <strong>and</strong> contrasting low-income rates of different geographies. LIM-AT, the Low-Income Measure –<br />
After Tax, is one way of underst<strong>and</strong>ing the extent of poverty experienced in a community. Other ways<br />
of measuring low income can produce different perspectives.<br />
<strong>The</strong>re are methodological differences between the 2016 Census <strong>and</strong> the T1FF data in calculating low-income<br />
rates. While both report on low income based on Tax-filer data from 2015, T1FF uses the Census family<br />
as the unit of measure while the Census uses the household. This, coupled with the application of different<br />
equivalency scales to the data, results in different low-income thresholds <strong>and</strong> slightly different rates of child<br />
<strong>and</strong> family poverty. In 2015, the LIM-AT thresholds for use with Census data were $31,301 for a household<br />
of two <strong>and</strong> $44,266 for a household of four. 22 It is also notable that the 2016 Census calculation of low-income<br />
rates excludes First Nations people living on reserve, while these individuals are included in T1FF lowincome<br />
rates.<br />
In terms of geography, we used the <strong>City</strong> of Toronto boundaries, where possible. However, as some<br />
demographic data is not yet available at the city level, Figures 4-10 are reported at the Census Metropolitan<br />
Area or CMA.<br />
22
UNEQUAL CITY:<br />
<strong>The</strong> <strong>Hidden</strong> <strong>Divide</strong> <strong>Among</strong> Toronto’s <strong>Children</strong> <strong>and</strong> <strong>Youth</strong><br />
2017 Toronto Child <strong>and</strong> Family Poverty Report Card<br />
Appendix 2 – Selected Approved <strong>City</strong> Strategies<br />
Key <strong>City</strong><br />
Strategy<br />
Housing<br />
Opportunities<br />
Toronto<br />
Toronto Strong<br />
Neighbourhood<br />
Strategy<br />
Middle Childhood<br />
Strategy<br />
Recreation<br />
Services Plan<br />
Toronto<br />
Newcomer<br />
Strategy<br />
Seniors<br />
Strategy 1.0<br />
Date<br />
Adopted<br />
Council Vote<br />
Outcomes<br />
Number of<br />
Current<br />
Councillors<br />
Supporting<br />
Strategy<br />
Examples of Deliverables<br />
Sept/09 Carried 33-2 13 1,000 new affordable rental units<br />
1,100 new affordable ownership units<br />
March/12 Consent 31<br />
Engagement, employment training<br />
<strong>and</strong>/or food security activities for additional<br />
2,400 residents<br />
13 new community hub development<br />
projects<br />
Aug/12 Consent 31 After-school program subsidies for<br />
an additional 2,315 children<br />
Nov/12 Carried 41-0 31 Free swim classes for an additional<br />
3,500 Grade 4 children<br />
Feb/13 Carried 39-0 29<br />
May/13 Carried 35-0 27<br />
Parks Plan May/13 Carried 36-0 24<br />
<strong>Youth</strong> Equity<br />
Strategy<br />
Poverty Reduction<br />
Strategy<br />
Fair (Transit)<br />
Pass Program<br />
Child Care<br />
Growth Strategy<br />
Feb/14 Carried 31-0 23<br />
Eliminate free dental care wait list for<br />
3,000 seniors <strong>and</strong> add 10 new paramedics<br />
Range of programs including educational<br />
attainment, employment connections, <strong>and</strong><br />
support networks for youth<br />
Nov/15 Carried 40-0 38 Expansion of school snack programs to<br />
48 schools (13,000 students)<br />
Shelter expansion<br />
Dec/16 Carried 31-3 30 Reduced TTC fares for 36,000 social<br />
assistance recipients<br />
Apr/17 Carried 41-2 40 1,000 new child care spaces<br />
(including 500 fee subsidies)<br />
TO Climate July/17 Carried 43-0 41 Retrofit 50 million square feet of city<br />
Action<br />
buildings <strong>and</strong> double renewable energy<br />
capacity by 2020<br />
Energy efficient retrofits for 35-50 social<br />
housing towers by 2020<br />
23
UNEQUAL CITY:<br />
<strong>The</strong> <strong>Hidden</strong> <strong>Divide</strong> <strong>Among</strong> Toronto’s <strong>Children</strong> <strong>and</strong> <strong>Youth</strong><br />
2017 Toronto Child <strong>and</strong> Family Poverty Report Card<br />
Appendix 3 – Map of Toronto Census Metropolitan Area<br />
Lake Simcoe<br />
Georgina<br />
Brock<br />
N<br />
Dufferin<br />
Mono<br />
Simcoe<br />
Bradford<br />
New Tecumseth West Gwillimbury East Gwillimbury<br />
Orangeville<br />
Newmarket<br />
Uxbridge<br />
Caledon<br />
King<br />
Aurora<br />
Whitchurch-<br />
Stouffville<br />
Scugog<br />
Vaughan<br />
Richmond Hill<br />
York<br />
Markham<br />
Pickering<br />
Durham<br />
Halton Hills<br />
Brampton<br />
Peel<br />
Toronto<br />
Ajax<br />
Whitby<br />
Oshawa<br />
Oshawa CMA<br />
Clarington<br />
Halton<br />
Mississauga<br />
Lake Ontario<br />
Milton<br />
Burlington<br />
(part of Hamilton CMA)<br />
Oakville<br />
Toronto Urban Region<br />
Toronto Census Metropolitan Area<br />
Greater Toronto Area (GTA)<br />
Municipalities<br />
Upper-tier Regions (Census Divisions)<br />
Lower-tier Cities & Towns (Census Subdivisions)<br />
24
UNEQUAL CITY:<br />
<strong>The</strong> <strong>Hidden</strong> <strong>Divide</strong> <strong>Among</strong> Toronto’s <strong>Children</strong> <strong>and</strong> <strong>Youth</strong><br />
2017 Toronto Child <strong>and</strong> Family Poverty Report Card<br />
Appendix 4 – Map of Toronto Neighbourhoods<br />
116<br />
130<br />
21<br />
36<br />
49 48<br />
2<br />
24<br />
35<br />
50<br />
27<br />
37<br />
117<br />
129<br />
131<br />
22<br />
3<br />
25<br />
34<br />
51 52 47 46<br />
132<br />
1 4<br />
38<br />
53<br />
118<br />
128<br />
5<br />
40<br />
26<br />
33<br />
135 134<br />
23<br />
45<br />
39<br />
6<br />
28 29<br />
105<br />
119 126 127 137<br />
113<br />
31 32<br />
41 42<br />
30<br />
103<br />
136<br />
7 8<br />
115 112 108 102<br />
43<br />
125 138<br />
100<br />
140<br />
99 56<br />
11 10 9<br />
110 109 107 106 101 104<br />
55 44<br />
139<br />
111<br />
120 124<br />
91 92<br />
97<br />
54<br />
123<br />
13 90<br />
94 96<br />
58<br />
15 89<br />
98 57<br />
114<br />
93<br />
59 60<br />
12<br />
88<br />
95<br />
61<br />
67 66<br />
121<br />
14<br />
83 80 79 74<br />
62<br />
122<br />
71 68 69<br />
16 87<br />
65 64<br />
86 84 81 78 76 75<br />
73 72<br />
63<br />
85<br />
70<br />
82 77<br />
0 1 2 3 4<br />
20<br />
17<br />
Km<br />
N<br />
133<br />
19<br />
18<br />
1 West Humber-Clairville 38 Lansing-Westgate 75 Church-Yonge Corridor 112 Beechborough-Greenbrook<br />
2 Mount Olive-Silverstone-Jamestown 39 Bedford Park-Nortown 76 Bay Street Corridor 113 Weston<br />
3 Thistletown-Beaumond Heights 40 St. Andrew-Windfields 77 Waterfront Communities-<strong>The</strong> Isl<strong>and</strong> 114 Lambton Baby Point<br />
4 Rexdale-Kipling 41 Bridle Path-Sunnybrook-York Mills 78 Kensington-Chinatown 115 Mount Dennis<br />
5 Elms-Old Rexdale 42 Banbury-Don Mills 79 University 116 Steeles<br />
6 Kingsview Village-<strong>The</strong> Westway 43 Victoria Village 80 Palmerston-Little Italy 117 L’Amoreaux<br />
7 Willowridge-Martingrove-Richview 44 Flemingdon Park 81 Trinity-Bellwoods 118 Tam O’Shanter-Sullivan<br />
8 Humber Heights-Westmount 45 Parkwoods-Donalda 82 Niagara 119 Wexford/Maryvale<br />
9 Edenbridge-Humber Valley 46 Pleasant View 83 Dufferin Grove 120 Clairlea-Birchmount<br />
10 Princess-Rosethorn 47 Don Valley Village 84 Little Portugal 121 Oakridge<br />
11 Eringate-Centennial-West Deane 48 Hillcrest Village 85 South Parkdale 122 Birchcliffe-Cliffside<br />
12 Markl<strong>and</strong> Wood 49 Bayview Woods-Steeles 86 Roncesvalles 123 Cliffcrest<br />
13 Etobicoke West Mall 50 Newtonbrook East 87 High Park-Swansea 124 Kennedy Park<br />
14 Islington-<strong>City</strong> Centre West 51 Willowdale East 88 High Park North 125 Ionview<br />
15 Kingsway South 52 Bayview Village 89 Runnymede-Bloor West Village 126 Dorset Park<br />
16 Stonegate-Queensway 53 Henry Farm 90 Junction Area 127 Bendale<br />
17 Mimico (includes Humber Bay Shores) 54 O’Connor-Parkview 91 Weston-Pellam Park 128 Agincourt South-Malvern West<br />
18 New Toronto 55 Thorncliffe Park 92 Corso Italia-Davenport 129 Agincourt North<br />
19 Long Branch 56 Leaside-Bennington 93 Dovercourt-Wallace Emerson-Junction 130 Milliken<br />
20 Alderwood 57 Broadview North 94 Wychwood 131 Rouge<br />
21 Humber Summit 58 Old East York 95 Annex 132 Malvern<br />
22 Humbermede 59 Danforth-East York 96 Casa Loma 133 Centennial Scarborough<br />
23 Pelmo Park-Humberlea 60 Woodbine-Lumsden 97 Yonge-St. Clair 134 Highl<strong>and</strong> Creek<br />
24 Black Creek 61 Taylor-Massey 98 Rosedale-Moore Park 135 Morningside<br />
25 Glenfield-Jane Heights 62 East End-Danforth 99 Mount Pleasant East 136 West Hill<br />
26 Downsview-Roding-CFB 63 <strong>The</strong> Beaches 100 Yonge-Eglinton 137 Woburn<br />
27 York University Heights 64 Woodbine Corridor 101 Forest Hill South 138 Eglinton East<br />
28 Rustic 65 Greenwood-Coxwell 102 Forest Hill North 139 Scarborough Village<br />
29 Maple Leaf 66 Danforth 103 Lawrence Park South 140 Guildwood<br />
30 Brookhaven-Amesbury 67 Playter Estates-Danforth 104 Mount Pleasant West<br />
31 Yorkdale-Glen Park 68 North Riverdale 105 Lawrence Park North Source: Social Policy Analysis & Research<br />
32 Englemount-Lawrence 69 Blake-Jones 106 Humewood-Cedarvale unit , <strong>City</strong> of Toronto. Copyright <strong>City</strong> of<br />
33 Clanton Park 70 South Riverdale 107 Oakwood Village Toronto 2008 All Rights Reserved. Pub-<br />
34 Bathurst Manor 71 Cabbagetown-South St. James Town 108 Briar Hill-Belgravia lication Date: May 2008. Contact spar@<br />
35 Westminster-Branson 72 Regent Park 109 Caledonia-Fairbank toronto.ca for additional information.<br />
36 Newtonbrook West 73 Moss Park 110 Keelesdale-Eglinton West<br />
37 Willowdale West 74 North St. James Town 111 Rockcliffe-Smythe<br />
25
UNEQUAL CITY:<br />
<strong>The</strong> <strong>Hidden</strong> <strong>Divide</strong> <strong>Among</strong> Toronto’s <strong>Children</strong> <strong>and</strong> <strong>Youth</strong><br />
2017 Toronto Child <strong>and</strong> Family Poverty Report Card<br />
Notes<br />
1 Data on Indigenous low-income levels is based on Before Tax Low<br />
Income Cut Off (LICO) whereas Census Data low-income rates<br />
are based on Low Income Measure – After Tax. See Appendix 1<br />
for details. about data used.<br />
2 By “racialized” we mean “peoples of colour” or what Statistics<br />
Canada refers to as “visible minorities” as it is defined by the<br />
Employment Equity Act. This term refers to “persons, other than<br />
Aboriginal persons, who are non-Caucasian in race or non-white<br />
in colour”. For Statistics Canada purposes the “visible minority”<br />
population consists mainly of the following groups: South Asian,<br />
Chinese, Black, Filipino, Latin American, Arab, Southeast Asian,<br />
West Asian, Korean <strong>and</strong> Japanese. http://www12.statcan.gc.ca/<br />
nhs-enm/2011/as-sa/99-010-x/99-010-x2011001-eng.cfm#a4<br />
3 <strong>City</strong> of Toronto. (2015). TO Prosperity: Toronto Poverty Reduction<br />
Strategy. Retrieved from https://www1.toronto.ca/<strong>City</strong>%20Of%20<br />
Toronto/Social%20Development,%20Finance%20&%20<br />
Administration/Strategies/Poverty%20Reduction%20Strategy/<br />
PDF/TO_Prosperity_Final2015-reduced.pdf<br />
4 Keenan, E. (2017, October 27). What do Torontonians really want<br />
their city to be? Toronto Star. Retrieved from https://www.thestar.<br />
com/news/gta/2017/10/27/what-do-torontonians-really-want-theircity-to-be-keenan.html<br />
5 See, for example, Griggs, J. <strong>and</strong> Walker R. (2008). <strong>The</strong> costs of child<br />
poverty for individuals <strong>and</strong> society: A literature review. Joseph<br />
Rowntree Foundation. Retrieved from https://www.jrf.org.uk/sites/<br />
default/files/jrf/migrated/files/2301-child-poverty-costs.pdf<br />
6 Briggs, A., Lee, C., <strong>and</strong> Stapleton, J. (2016). <strong>The</strong> cost of poverty in<br />
Toronto. Retrieved from https://d3n8a8pro7vhmx.cloudfront.net/<br />
socialplanningtoronto/pages/523/attachments/original/1480338070/<br />
Cost-of-Poverty-R10-Final-forweb.pdf?1480338070<br />
7 While further analysis would be needed to explore causality, it is<br />
worth noting that the federal Universal Child Care Benefit was<br />
increased in 2015, <strong>and</strong> the Ontario Child Benefit was indexed in the<br />
same year. In addition, the Ontario minimum wage was increased<br />
from $11 to $11.25 in 2015.<br />
8 Rotondi, M.A., O’Campo, P., O’Brien, K., Firestone, M., Wolfe,<br />
S.H., Bourgeois, C., Maracle, S., Spiller, M., <strong>and</strong> Smylie, J. In press.<br />
Our Health Counts Toronto – Using respondent-driven sampling to<br />
unmask census undercounts of an urban indigenous population in<br />
Toronto, Canada. BMJ Open.<br />
9 Ibid.<br />
10 A 95% confidence interval means that, assuming a normal<br />
distribution of data, the actual percentage of poverty among all<br />
Indigenous families is expected to fall within the indicated range<br />
19 times out of 20.<br />
11 Well Living House <strong>and</strong> Seven Generation Midwives Toronto.<br />
(2017). Our Health Counts Toronto unpublished data. Due to<br />
inadequacies in existing health information intrastructures with<br />
respect to Indigenous data, the Indigenous child poverty rate here is<br />
based on a different measure of low income than used in the rest of<br />
the report. This measure is rigorously scientific <strong>and</strong> provides strong<br />
evidence that the experience of child poverty among Toronto’s<br />
Indigenous community is disturbingly <strong>and</strong> unacceptably high. <strong>The</strong><br />
use of Low Income Cut Off in place of Low Income Measure will<br />
likely have a minor impact when comparing across groups. Using<br />
the LICO, a family of four in a large urban centre with a before-tax<br />
income of less than $45,712 would be considered low income in 2015.<br />
12 Rotondi et al.<br />
13 Ibid.<br />
14 Statistics Canada. (2016). Census of Population. Retrieved from<br />
http://www12.statcan.gc.ca/census-recensement/2016/as-sa/fogs-spg/<br />
Facts-cd-eng.cfm?LANG=Eng&GK=CD&GC=3520&TOPIC=9<br />
15 Smylie, J., <strong>and</strong> Firestone, M. (2015). Back to the basics: Identifying<br />
<strong>and</strong> addressing underlying challenges in achieving high quality<br />
<strong>and</strong> relevant health statistics for Indigenous populations in Canada.<br />
Statistics Journal of the IAOS, 31, 67-87. doi: 10.3233/SJI-150864.<br />
16 McInturff, K. (2017). <strong>The</strong> best <strong>and</strong> worst places to be a woman<br />
in Canada 2017: <strong>The</strong> gender gap in Canada’s 25 biggest cities.<br />
Canadian Centre for Policy Alternatives. Retrieved from https://<br />
www.policyalternatives.ca/sites/default/files/uploads/publications/<br />
National%20Office/2017/10/Best%20<strong>and</strong>%20Worst%20Places%20<br />
to%20Be%20a%20Woman%202017.pdf<br />
17 Polanyi, M., Mustachi, J., kerr, m., <strong>and</strong> Meagher, S. (2016). <strong>Divide</strong>d<br />
city: Life in Canada’s child poverty capital. 2016 Toronto Child<br />
<strong>and</strong> Family Report Card. Retrieved from https://d3n8a8pro7vhmx.<br />
cloudfront.net/socialplanningtoronto/pages/515/attachments/<br />
original/1478891376/CAST-2016-report-v8-web.pdf?1478891376<br />
18 Toronto Social Dashboard at https://www1.toronto.ca/wps/<br />
portal/contentonly?vgnextoid=9792de0096180510Vgn<br />
VCM10000071d60f89RCRD; 2017 OPERATING BUDGET<br />
BRIEFING NOTE: Program Waitlists <strong>and</strong> Strategies to Address<br />
the Increase, http://www.toronto.ca/legdocs/mmis/2017/ex/bgrd/<br />
backgroundfile-100658.pdf<br />
19 United Way Toronto <strong>and</strong> York Region. (2017). <strong>The</strong> opportunity<br />
equation in the Greater Toronto Area: An update on<br />
neighbourhood income inequality <strong>and</strong> polarization. Retrieved from<br />
https://www.unitedwaytyr.com/file/2017_Opportunity_Equation_<br />
Update_Low-Res.pdf<br />
20 UNICEF Report Card 10. Canadian Companion.<br />
http://www.unicef.ca/sites/default/files/imce_uploads/DISCOVER/<br />
OUR%20WORK/ADVOCACY/DOMESTIC/RESEARCH%20<br />
AND%20POLICY/DOCS/canadian_companion_fa.pdf.<br />
21 Statistics Canada, Income Statistics Division. (2017). Technical<br />
reference guide for the annual income estimates for census families,<br />
individuals <strong>and</strong> seniors: T1 family file, final estimates, 2015.<br />
Retrieved from http://www.statcan.gc.ca/pub/72-212-x/72-212-<br />
x2017001-eng.pdf<br />
22 Statistics Canada. (2017). Low-income measures thresholds (LIM-<br />
AT <strong>and</strong> LIM-BT) for private households of Canada, 2015. Retrieved<br />
from http://www12.statcan.gc.ca/census-recensement/2016/ref/dict/<br />
tab/t4_2-eng.cfm<br />
26
A JOINT REPORT OF<br />
the <strong>Children</strong>’s Aid Society of Toronto, Colour of Poverty – Colour of Change,<br />
Family Service Toronto/Ontario Campaign 2000,<br />
Ontario Council of Agencies Serving Immigrants <strong>and</strong><br />
Social Planning Toronto with the support of the <strong>Children</strong>’s Aid Foundation