Cover single - Santos
Cover single - Santos
Cover single - Santos

You also want an ePaper? Increase the reach of your titles
YUMPU automatically turns print PDFs into web optimized ePapers that Google loves.
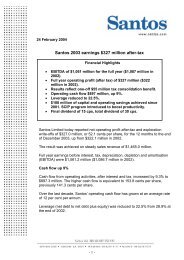
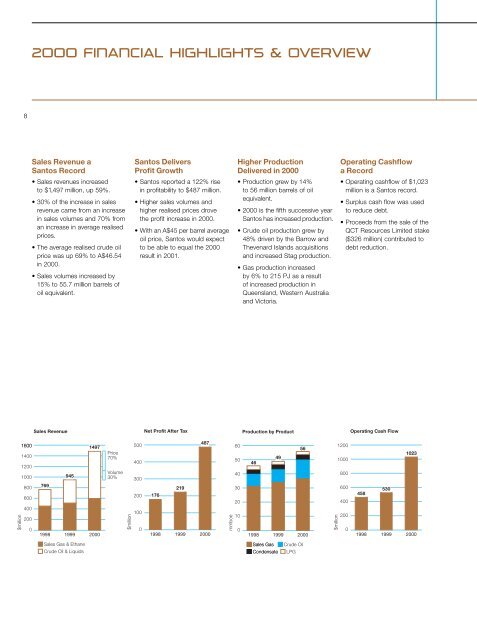
2000 FINANCIAL HIGHLIGHTS & OVERVIEW<br />
8<br />
Sales Revenue a<br />
<strong>Santos</strong> Record<br />
<strong>Santos</strong> Delivers<br />
Profit Growth<br />
Higher Production<br />
Delivered in 2000<br />
Operating Cashflow<br />
a Record<br />
• Sales revenues increased<br />
to $1,497 million, up 59%.<br />
• 30% of the increase in sales<br />
revenue came from an increase<br />
in sales volumes and 70% from<br />
an increase in average realised<br />
prices.<br />
• The average realised crude oil<br />
price was up 69% to A$46.54<br />
in 2000.<br />
• Sales volumes increased by<br />
15% to 55.7 million barrels of<br />
oil equivalent.<br />
• <strong>Santos</strong> reported a 122% rise<br />
in profitability to $487 million.<br />
• Higher sales volumes and<br />
higher realised prices drove<br />
the profit increase in 2000.<br />
• With an A$45 per barrel average<br />
oil price, <strong>Santos</strong> would expect<br />
to be able to equal the 2000<br />
result in 2001.<br />
• Production grew by 14%<br />
to 56 million barrels of oil<br />
equivalent.<br />
• 2000 is the fifth successive year<br />
<strong>Santos</strong> has increased production.<br />
• Crude oil production grew by<br />
48% driven by the Barrow and<br />
Thevenard Islands acquisitions<br />
and increased Stag production.<br />
• Gas production increased<br />
by 6% to 215 PJ as a result<br />
of increased production in<br />
Queensland, Western Australia<br />
and Victoria.<br />
• Operating cashflow of $1,023<br />
million is a <strong>Santos</strong> record.<br />
• Surplus cash flow was used<br />
to reduce debt.<br />
• Proceeds from the sale of the<br />
QCT Resources Limited stake<br />
($326 million) contributed to<br />
debt reduction.<br />
Sales Revenue<br />
Net Profit After Tax<br />
Production by Product<br />
Operating Cash Flow<br />
1600<br />
1400<br />
1200<br />
1000<br />
$million<br />
800<br />
600<br />
400<br />
200<br />
0<br />
769<br />
1998<br />
945<br />
1497<br />
1999 2000<br />
Price<br />
70%<br />
Volume<br />
30%<br />
$million<br />
500<br />
400<br />
300<br />
200<br />
100<br />
0<br />
176<br />
1998<br />
219<br />
487<br />
1999 2000<br />
mmboe<br />
60<br />
50<br />
40<br />
30<br />
20<br />
10<br />
0<br />
46<br />
1998<br />
49<br />
56<br />
1999 2000<br />
$million<br />
1200<br />
1000<br />
800<br />
600<br />
400<br />
200<br />
0<br />
458<br />
1998<br />
530<br />
1023<br />
1999 2000<br />
Sales Gas & Ethane<br />
Crude Oil & Liquids<br />
Sales Gas<br />
Condensate<br />
Crude Oil<br />
LPG