Cover single - Santos
Cover single - Santos
Cover single - Santos

You also want an ePaper? Increase the reach of your titles
YUMPU automatically turns print PDFs into web optimized ePapers that Google loves.
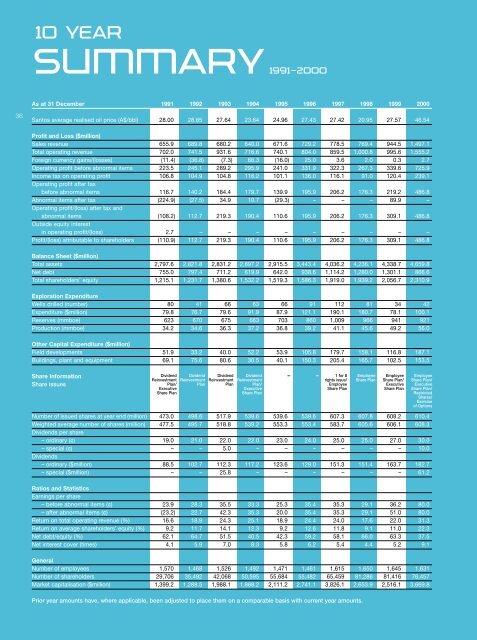
10 YEAR<br />
SUMMARY1991–2000<br />
As at 31 December 1991 1992 1993 1994 1995 1996 1997 1998 1999 2000<br />
36<br />
<strong>Santos</strong> average realised oil price (A$/bbl) 28.00 28.65 27.64 23.64 24.96 27.43 27.42 20.95 27.57 46.54<br />
Profit and Loss ($million)<br />
Sales revenue 655.9 689.8 680.2 640.0 671.6 729.2 778.5 769.4 944.5 1,497.1<br />
Total operating revenue 702.0 741.5 931.6 716.6 740.1 804.0 859.5 1,000.8 995.6 1,555.2<br />
Foreign currency gains/(losses) (11.4) (36.8) (7.3) 66.3 (16.0) 25.0 3.6 2.0 0.3 2.7<br />
Operating profit before abnormal items 223.5 245.1 289.2 295.9 241.0 331.9 322.3 267.3 339.6 725.9<br />
Income tax on operating profit 106.8 104.9 104.8 116.2 101.1 136.0 116.1 91.0 120.4 239.1<br />
Operating profit after tax<br />
before abnormal items 116.7 140.2 184.4 179.7 139.9 195.9 206.2 176.3 219.2 486.8<br />
Abnormal items after tax (224.9) (27.5) 34.9 10.7 (29.3) – – – 89.9 –<br />
Operating profit/(loss) after tax and<br />
abnormal items (108.2) 112.7 219.3 190.4 110.6 195.9 206.2 176.3 309.1 486.8<br />
Outside equity interest<br />
in operating profit/(loss) 2.7 – – – – – – – – –<br />
Profit/(loss) attributable to shareholders (110.9) 112.7 219.3 190.4 110.6 195.9 206.2 176.3 309.1 486.8<br />
Balance Sheet ($million)<br />
Total assets 2,797.6 2,821.8 2,831.2 2,897.2 2,915.5 3,443.4 4,036.2 4,236.1 4,338.7 4,659.8<br />
Net debt 755.0 797.4 711.2 619.9 642.0 938.6 1,114.2 1,280.0 1,301.1 866.6<br />
Total shareholders’ equity 1,215.1 1,231.7 1,380.6 1,532.2 1,519.3 1,586.3 1,919.0 1,939.2 2,056.7 2,310.9<br />
Exploration Expenditure<br />
Wells drilled (number) 80 41 66 63 66 91 112 81 34 42<br />
Expenditure ($million) 79.8 76.7 79.6 91.9 87.9 121.1 190.1 180.7 78.1 100.1<br />
Reserves (mmboe) 623 670 675 663 703 860 1,009 966 941 921<br />
Production (mmboe) 34.2 34.6 36.3 37.2 36.8 39.2 41.1 45.6 49.2 56.0<br />
Other Capital Expenditure ($million)<br />
Field developments 51.9 33.2 40.0 52.2 53.9 105.8 179.7 158.1 116.8 187.1<br />
Buildings, plant and equipment 69.1 75.6 80.6 30.5 40.1 150.3 205.4 165.7 102.5 153.5<br />
Share Information<br />
Share issues<br />
Dividend<br />
Reinvestment<br />
Plan/<br />
Executive<br />
Share Plan<br />
Dividend<br />
Reinvestment<br />
Plan<br />
Dividend<br />
Reinvestment<br />
Plan<br />
Dividend<br />
Reinvestment<br />
Plan/<br />
Executive<br />
Share Plan<br />
– – 1 for 8<br />
rights issue/<br />
Employee<br />
Share Plan<br />
Number of issued shares at year end (million) 473.0 498.6 517.9 539.6 539.6 539.6 607.3 607.8 608.2 610.4<br />
Weighted average number of shares (million) 477.5 495.7 518.8 539.2 553.3 553.4 583.7 605.6 606.1 608.3<br />
Dividends per share<br />
– ordinary (¢) 19.0 21.0 22.0 22.0 23.0 24.0 25.0 25.0 27.0 30.0<br />
– special (¢) – – 5.0 – – – – – – 10.0<br />
Dividends<br />
– ordinary ($million) 88.5 102.7 112.3 117.2 123.6 129.0 151.3 151.4 163.7 182.7<br />
– special ($million) – – 25.8 – – – – – – 61.2<br />
Ratios and Statistics<br />
Earnings per share<br />
– before abnormal items (¢) 23.9 28.3 35.5 33.3 25.3 35.4 35.3 29.1 36.2 80.0<br />
– after abnormal items (¢) (23.2) 22.7 42.3 35.3 20.0 35.4 35.3 29.1 51.0 80.0<br />
Return on total operating revenue (%) 16.6 18.9 24.3 25.1 18.9 24.4 24.0 17.6 22.0 31.3<br />
Return on average shareholders’ equity (%) 9.2 11.7 14.1 12.3 9.2 12.6 11.8 9.1 11.0 22.3<br />
Net debt/equity (%) 62.1 64.7 51.5 40.5 42.3 59.2 58.1 66.0 63.3 37.5<br />
Net interest cover (times) 4.1 5.9 7.0 8.3 5.8 6.2 5.4 4.4 5.2 9.1<br />
General<br />
Number of employees 1,570 1,468 1,526 1,492 1,471 1,461 1,615 1,650 1,645 1,631<br />
Number of shareholders 29,706 35,492 42,068 50,595 55,684 55,482 65,459 81,286 81,416 76,457<br />
Market capitalisation ($million) 1,399.2 1,288.5 1,988.1 1,868.2 2,111.2 2,741.1 3,826.1 2,653.9 2,516.1 3,669.8<br />
Prior year amounts have, where applicable, been adjusted to place them on a comparable basis with current year amounts.<br />
Employee<br />
Share Plan<br />
Employee<br />
Share Plan/<br />
Executive<br />
Share Plan<br />
Employee<br />
Share Plan/<br />
Executive<br />
Share Plan/<br />
Restricted<br />
Shares/<br />
Exercise<br />
of Options