Cover single - Santos
Cover single - Santos
Cover single - Santos

You also want an ePaper? Increase the reach of your titles
YUMPU automatically turns print PDFs into web optimized ePapers that Google loves.
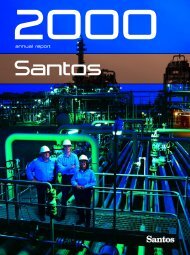
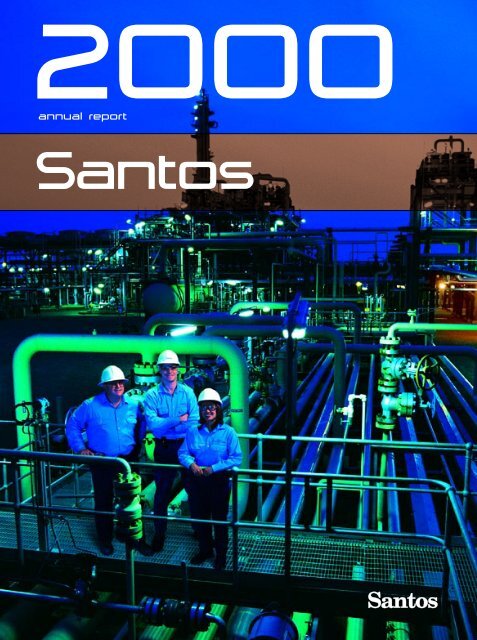
2000<br />
annual report<br />
<strong>Santos</strong>
CONTENTS<br />
Company Overview 1<br />
Chairman’s Review 2<br />
Managing Director’s Review 4<br />
Financial Highlights & Overview 7<br />
Business Unit Operations 12<br />
Review of Performance<br />
Exploration 14<br />
Development 16<br />
Reserves 18<br />
Australian Gas 19<br />
Production 20<br />
Environment & Safety 22<br />
Community 23<br />
Board of Directors 26<br />
Corporarte Governance 28<br />
Group Interests 30<br />
Glossary 32<br />
<strong>Santos</strong>’ Areas of Operation 34<br />
10 Year Summary 36<br />
Directors Statutory Report 38<br />
Financial Report 42<br />
Stock Exchange and<br />
Shareholder Information 72<br />
<strong>Cover</strong><br />
The year 2000 was<br />
an outstanding one<br />
for <strong>Santos</strong>. One of<br />
the many achievments<br />
was that the Company<br />
delivered record gas<br />
from south-west<br />
Queensland.<br />
<strong>Santos</strong>’ people are the drivers of technological<br />
innovation in developing the Company’s<br />
resources. Through the efforts of Rod McArdle<br />
and his team in Queensland, coal bed methane<br />
in the Scotia field is now being developed to<br />
supply up to 120 PJ of gas to CS Energy’s<br />
new gas fired power station at Swanbank,<br />
west of Brisbane.<br />
John Ellice-Flint<br />
Managing Director<br />
Pictured on the cover are Ray Johnson, Team<br />
Leader Petroleum Engineering, Brett Doherty,<br />
Area Superintendent Eastern Queensland and<br />
Pipelines, Bonnie Lowe-Young, Exploration<br />
Supervisor, Queensland and Northern Territory<br />
Business Unit and the Ballera Gas Plant in<br />
south-west Queensland.<br />
Port Bonython Liquids<br />
Processing Plant<br />
United States<br />
Exploration Acreage<br />
> Offshore – Gulf of Mexico<br />
> Onshore – Texas and Louisiana<br />
Gulf Coast and Arkoma Basin in<br />
Oklahoma<br />
United States<br />
Stag Production Facility<br />
Cooper Basin<br />
Production<br />
> Texas Gulf Coast<br />
> Gulf of Mexico<br />
Heytesbury Gas Plant<br />
Visit the <strong>Santos</strong> website<br />
www.santos.com.au<br />
<strong>Santos</strong> Ltd ABN 80 007 550 923<br />
Incorporated in Adelaide, South Australia<br />
on 18 March 1954. Quoted on the<br />
official list of the Australian Stock<br />
Exchange Ltd and the New Zealand<br />
Exchange. <strong>Santos</strong> American Depository<br />
Receipts issued by Morgan Guaranty in<br />
the USA are sponsored and are quoted<br />
on the NASDAQ system in the USA.
Bentu<br />
Korinci-Baru<br />
Indonesia<br />
Sampang<br />
Irian Jaya<br />
Warim<br />
Papua New<br />
Guinea<br />
Papua New Guinea<br />
Exploration Acreage<br />
> SE Gobe field<br />
Production<br />
> SE Gobe field<br />
Indonesia<br />
Exploration Acreage<br />
> Warim<br />
> Bentu<br />
> Korinci-Baru<br />
> Sampang<br />
Moomba Plant<br />
East Spar<br />
Offshore Australia<br />
Exploration Acreage<br />
> Carnarvon Basin<br />
> Browse Basin<br />
> Timor Sea<br />
Production<br />
> Carnarvon Basin –<br />
Oil (Stag, Chervil, and<br />
Barrow and Thevenard<br />
Islands’ fields) and sales<br />
gas and condensate<br />
(East Spar field)<br />
Carnarvon<br />
> Timor Sea –<br />
Oil (Elang/Kakatua/Kakatua<br />
North fields (Timor Gap);<br />
Jabiru and Challis<br />
(Timor Sea)<br />
Timor Sea<br />
Browse<br />
Amadeus<br />
Ballera and Jackson<br />
Moomba<br />
Queensland and Northern Territory<br />
Exploration Acreage<br />
> Cooper/Eromanga Basins (south-west Queensland)<br />
> Surat/Bowen Basins<br />
> Amadeus Basin<br />
Production<br />
> Ballera Gas Processing<br />
> Jackson Oil Processing<br />
> Amadeus Oil & Gas Processing<br />
> Surat/Bowen Oil & Gas Processing<br />
Surat/Bowen<br />
South Australia<br />
Exploration Acreage<br />
> Cooper/Eromanga Basins<br />
(South Australia)<br />
Production<br />
> Moomba Gas, Oil and<br />
Liquids Processing<br />
> Port Bonython Oil and<br />
Liquids Processing<br />
Port Bonython<br />
Otway<br />
Gippsland<br />
Bass<br />
Victoria<br />
Exploration Acreage<br />
> Onshore and Offshore<br />
Otway Basins<br />
> Offshore Bass Basin<br />
> Offshore Gippsland Basin<br />
Production<br />
> Heytesbury Gas Processing<br />
Barrow Island<br />
SE Gobe Production Facility
CHAIRMAN’S REVIEW<br />
2<br />
A New Era Begins for <strong>Santos</strong><br />
Chairman John Uhrig reports to shareholders<br />
Dear Shareholder,<br />
There have been many important<br />
developments at <strong>Santos</strong> over the<br />
past year.<br />
<strong>Santos</strong> delivered higher levels of<br />
production and earnings than at<br />
any time in its history.<br />
Gearing fell to its lowest level<br />
in 20 years.<br />
<strong>Santos</strong>’ share price increased<br />
by 45%.<br />
The Company’s long-standing<br />
investment in coal was sold.<br />
The South Australian Government<br />
commenced a review of the<br />
Company’s shareholding<br />
restriction.<br />
A new Managing Director, Mr<br />
John Ellice-Flint, was appointed.<br />
This marks the start of a new<br />
era for the Company.<br />
<strong>Santos</strong> was not unusual among<br />
oil and gas companies in<br />
achieving record earnings in<br />
2000. However, with record<br />
production of oil and liquids, the<br />
Company was well positioned<br />
to benefit from high oil prices.<br />
Gas production also continued<br />
to grow by a further 6.4%.<br />
Altogether, 30% of the increase in<br />
revenue came from higher<br />
production.<br />
With significantly increased<br />
production, <strong>Santos</strong> should be<br />
able to achieve higher earnings<br />
than it has in the past, even<br />
if oil prices return to more<br />
normal levels.<br />
Workplace safety and good<br />
environmental management<br />
are priorities for the Board. I<br />
am pleased to report that, in the<br />
context of increased production,<br />
the Company achieved a 20%<br />
improvement in its safety<br />
performance during 2000.<br />
Furthermore, there were no<br />
significant environmental incidents.<br />
During the year, the Board formed<br />
the view that the Company’s<br />
investment in QCT Resources<br />
Limited was no longer a core<br />
interest. This holding was<br />
subsequently sold in October,<br />
realising a small profit. This<br />
investment had been held for over<br />
a decade and its disposal marks<br />
a major change.<br />
In another development, the<br />
South Australian Government<br />
announced that it was reviewing<br />
the legislation restricting<br />
shareholdings in <strong>Santos</strong> to a<br />
maximum of 15%. At the Annual<br />
General Meeting in May 2000, the<br />
Board stated its view that this<br />
restriction is not in the long-term<br />
interest of <strong>Santos</strong> shareholders.<br />
While the Government’s review<br />
will inevitably involve broader<br />
considerations than those<br />
relevant to <strong>Santos</strong> shareholders,<br />
the Board and Company are<br />
planning on the assumption that,<br />
sooner or later, the restriction will<br />
be removed. As at the time of<br />
writing, the Government had not<br />
yet announced the outcome of<br />
the review.
3<br />
The appointment of Mr John<br />
Ellice-Flint to succeed the<br />
previous Managing Director,<br />
Mr Ross Adler, ensures that<br />
<strong>Santos</strong> continues to have strong<br />
management and leadership<br />
going forward.<br />
Mr Ellice-Flint joined <strong>Santos</strong> in<br />
December, bringing impressive<br />
international credentials in the<br />
oil and gas industry, plus other<br />
qualities that the Board rates<br />
highly. Among them are his<br />
leadership capacity, ability<br />
to motivate people, a strong<br />
focus on performance, and<br />
a commitment to building<br />
shareholder value.<br />
He returns to Australia after a<br />
successful career around the<br />
world with the American oil<br />
company, Unocal, where he<br />
was Senior Vice President Global<br />
Exploration and Technology. His<br />
mandate at <strong>Santos</strong> is for growth<br />
in shareholder returns.<br />
A strategic review of <strong>Santos</strong>’<br />
activities is underway, the main<br />
purpose of which is to put in<br />
place a plan for further growth<br />
under the new Managing Director.<br />
The review includes an<br />
assessment of the Company’s<br />
ongoing capital management,<br />
taking into account funding<br />
requirements for the growth<br />
program, changes to taxation<br />
law affecting shareholders and<br />
the Company’s current surplus<br />
of franking credits.<br />
Directors have declared a final<br />
dividend of 15 cents per share,<br />
increasing the total ordinary<br />
dividend to 30 cents for the year.<br />
This is a three-cent increase over<br />
the total 1999 dividend payment.<br />
The dividend continues to be<br />
fully franked.<br />
In view of the record profit result<br />
Directors have also decided to<br />
pay a fully franked special<br />
dividend of 10 cents per share.<br />
Historically <strong>Santos</strong> has been<br />
relatively late to report its<br />
results and to make its dividend<br />
payments. From the 2001 Interim<br />
Result, <strong>Santos</strong> intends to both<br />
report its results and pay its<br />
dividends earlier than in the past.<br />
The Company expects to<br />
announce its 2001 Interim Result<br />
on 22 August 2001 (previously<br />
5 September in 2000) and to<br />
pay its interim dividend on<br />
28 September 2001 (previously<br />
17 November in 2000).<br />
I will be retiring at the conclusion<br />
of the forthcoming Annual<br />
General Meeting. The present<br />
Deputy Chairman, Mr Stephen<br />
Gerlach, who has served on the<br />
<strong>Santos</strong> Board for over 11 years,<br />
will succeed me. <strong>Santos</strong> is well<br />
positioned to continue growing.<br />
It has good acreage, a strong<br />
balance sheet and a dynamic<br />
new Managing Director.<br />
As you can see as you read<br />
through this report, <strong>Santos</strong>’<br />
employees made a great<br />
contribution during the year<br />
and, on behalf of the Board,<br />
I wish to record our appreciation<br />
to all employees for their efforts.<br />
In particular I would like to<br />
record our appreciation of the<br />
contribution made over many<br />
years by Mr John McArdle,<br />
Executive General Manager<br />
Commercial, who acted as<br />
Managing Director prior to John<br />
Ellice-Flint’s appointment and<br />
who has announced his intention<br />
to retire in mid-2001.<br />
I would also like to pay tribute<br />
to the former Managing Director,<br />
Mr Ross Adler, who, over 16<br />
years, built <strong>Santos</strong> up to become<br />
the major Company it is today.<br />
The Board has great confidence<br />
in the future of the Company<br />
under the leadership of Mr Ellice-<br />
Flint and I thank shareholders<br />
for your support over my period<br />
as Chairman.<br />
J A Uhrig, Chairman<br />
9 March 2001
MANAGING DIRECTOR’S<br />
REVIEW 2000<br />
4<br />
John Ellice-Flint sums up 2000 and talks about his first<br />
impressions of <strong>Santos</strong><br />
A Great Result<br />
Among oil and gas companies the<br />
year 2000 will be remembered as<br />
the year of record high oil prices.<br />
With growing oil production,<br />
<strong>Santos</strong> was in the right place at<br />
the right time to benefit from this<br />
favourable environment.<br />
However, this was not just<br />
a matter of luck. <strong>Santos</strong> has<br />
been actively increasing its oil<br />
production in recent years and<br />
four developments in particular<br />
made it possible to substantially<br />
increase oil production in 2000:<br />
> Successful development work<br />
on the Stag oil field;<br />
> Acquisition of interests in the<br />
Barrow and Thevenard Islands<br />
oil fields;<br />
> Successful development work<br />
on the Elang oil fields; and<br />
> Onshore oil exploration<br />
success.<br />
These developments increased<br />
the Company’s production of<br />
oil and liquids from 14.5 million<br />
barrels of oil equivalent (boe) in<br />
1999 to 19 million boe in 2000.<br />
Gas production also grew, from<br />
202 petajoules (PJ) in 1999 to<br />
215 PJ in 2000. <strong>Santos</strong> continues<br />
to produce more domestic gas<br />
than any other company in<br />
Australia.<br />
Growing production and high oil<br />
prices came together to produce<br />
record earnings of $487 million or<br />
80 cents per share. This is a<br />
great result.<br />
Return on Average Capital<br />
Employed was 16.7%, well<br />
above the Weighted Average<br />
Cost of Capital.<br />
Importantly too, increased<br />
cash flow and the disposal of<br />
the Company’s interest in QCT<br />
Resources Limited reduced<br />
gearing (net debt to equity)<br />
to 38% by the year’s end.<br />
<strong>Santos</strong>’ earnings outlook is<br />
currently better than at any<br />
time in the recent past.<br />
While the result in any one<br />
year is sensitive to oil prices,<br />
an average oil price of around<br />
A$45 per barrel in 2001 would<br />
enable <strong>Santos</strong> to achieve 2001<br />
earnings similar with those<br />
in 2000.<br />
Looking further forward, baseline<br />
production at around current<br />
levels would deliver earnings<br />
substantially higher than those<br />
prior to 2000, even if oil prices<br />
fall to around the long-term<br />
average level.<br />
As a new Managing Director,<br />
one can’t have a much better<br />
start than this and I would like<br />
to acknowledge my predecessor,<br />
Mr Ross Adler, and his contribution<br />
to building this strong platform.<br />
My brief from the Board is to drive<br />
the Company forward in seeking<br />
further growth and I am very<br />
excited about this.
5<br />
In this overview I would like<br />
to share my first impressions<br />
of <strong>Santos</strong>.<br />
Since I was appointed at the end<br />
of 2000 I have met and spoken<br />
to hundreds of people across the<br />
Company, as well as externally,<br />
getting their views on <strong>Santos</strong>’<br />
growth potential.<br />
I have been impressed by the<br />
energy and enthusiasm of the<br />
people in the Company and by<br />
their technical knowledge.<br />
Optionality<br />
I have also been impressed by<br />
the optionality available to the<br />
Company. By optionality I mean<br />
having many options available<br />
to choose from.<br />
> <strong>Santos</strong> has a good acreage<br />
position.<br />
> It has further potential in the<br />
Cooper Basin.<br />
> It has one of the best<br />
gas marketing footprints<br />
in Australia.<br />
> It has a strong balance sheet.<br />
The Three Buckets<br />
Although people can overcomplicate<br />
the oil and gas<br />
business, successful exploration<br />
and production companies<br />
essentially add value in three<br />
ways, through:<br />
> Exploration;<br />
> Acquisitions; and<br />
> Reservoir Management.<br />
In any good exploration and<br />
production (E&P) company,<br />
all three buckets, as I call them,<br />
need to contribute to a growing<br />
reserves, production, and<br />
earnings profile, which should<br />
in turn translate into higher<br />
shareholder value.<br />
In addition, there are other ways<br />
of adding value that exist in all<br />
companies, such as capital<br />
management.<br />
Exploration<br />
A successful exploration program<br />
is a key part of the value equation.<br />
While <strong>Santos</strong> has been<br />
successful onshore in Australia,<br />
the Cooper Basin is unlikely to<br />
yield future 100 million barrel<br />
discoveries.<br />
This is reflected in the Company’s<br />
2000 exploration and appraisal<br />
results, which had a good<br />
success rate at 52%, but which<br />
only yielded 24 million boe of<br />
new reserves.<br />
At the same time <strong>Santos</strong> has<br />
substantial acreage, particularly<br />
in the Carnarvon Basin, which<br />
has potential for larger discoveries<br />
but where I believe drilling has<br />
probably been under-funded.<br />
Outside Australia, there were<br />
some interesting results in 2000.<br />
Runnells-3 discovered a new<br />
play type in the onshore Texas<br />
Gulf coast and Anggur-1<br />
discovered shallow gas offshore<br />
Java. Both of these discoveries<br />
have created options for growth.<br />
I believe that <strong>Santos</strong> should<br />
be able to get better returns<br />
from its exploration investment.<br />
In particular I believe in having<br />
a sustained exploration program<br />
in each of the Company’s main<br />
areas of interest. This makes<br />
it possible to accumulate and<br />
apply the lessons learned<br />
from past drilling to reduce<br />
drilling costs and therefore<br />
get more drilling done with<br />
more well completions from<br />
the money spent.<br />
Acquisitions<br />
Good E&P companies balance<br />
reserve additions through<br />
exploration with growth from<br />
acquisitions, the second value<br />
bucket. These can, if properly<br />
done at the right prices, create<br />
additional option platforms for<br />
value capture.<br />
In my view, <strong>Santos</strong> is one of<br />
the E&P companies that does<br />
acquisitions reasonably well. The<br />
Company’s major transaction in<br />
2000 was buying Shell’s interests<br />
in Barrow and Thevenard Islands<br />
in the Carnarvon Basin.<br />
As a result of the high oil prices<br />
during the year, this acquisition<br />
has performed substantially<br />
better than originally expected.<br />
Acquisitions will continue<br />
to be an ongoing part of<br />
<strong>Santos</strong>’ strategy.<br />
Reservoir Management<br />
The third value bucket is reservoir<br />
management. When I use this<br />
term I mean it in its broadest<br />
sense, covering all activities<br />
associated with maximising<br />
the value of an asset through<br />
its production life.<br />
Reservoir management initiatives<br />
tend to be low risk/low return but<br />
they do not require much capital<br />
and can also have a quick<br />
impact on the bottom line.<br />
I believe that <strong>Santos</strong> has<br />
substantial potential to improve<br />
day-to-day production efficiency,<br />
particularly through use of current<br />
technology. For example, in the<br />
Cooper Basin there is potential<br />
from optimisation of completions,<br />
remote telemetry, more seismic<br />
and more production logging<br />
over time to understand how<br />
our wells are behaving and why.<br />
Increases in recovery factors<br />
could also have substantial<br />
potential, not only to lower<br />
cost, but also to improve the<br />
reserve position.<br />
Costs<br />
Cost control is also an important<br />
aspect of reservoir management<br />
for a low-margin producer such<br />
as <strong>Santos</strong>. My attitude to costs<br />
is that there is always scope to<br />
do better and there should be<br />
no sacred cows. In the oil and<br />
gas industry, I believe there is<br />
unnecessary emphasis on<br />
custom designing and<br />
building and not enough on<br />
standardisation, which has<br />
the potential for significant<br />
cost reduction.<br />
For <strong>Santos</strong>, there is scope<br />
to reduce cost through<br />
standardisation, greater<br />
collaboration with suppliers,<br />
and more efficient procurement,<br />
increased use of remote<br />
monitoring, and better<br />
measurement systems. I also<br />
intend to focus effort on more<br />
timely well completions over<br />
the next year, along with all<br />
of our reservoir management<br />
processes and practices<br />
including reserves estimation.<br />
Priorities<br />
I have three immediate priorities:<br />
> To review <strong>Santos</strong>’ strategy,<br />
based on inputs from across<br />
the Company;<br />
> Cultural change and<br />
performance improvement;<br />
and<br />
> To create more win-win<br />
external relationships.
MANAGING DIRECTOR’S REVIEW CONTINUED<br />
6<br />
Strategy<br />
It is important to have a clearly<br />
articulated strategy that everyone<br />
in the Company can identify with<br />
and that investors can<br />
understand.<br />
<strong>Santos</strong>’ strategy is currently<br />
under review, with the aim of<br />
making appropriate statements<br />
to shareholders about our<br />
direction in the second quarter<br />
of 2001.<br />
Cultural Change and<br />
Performance Improvement<br />
The value of any oil and gas<br />
company is far more than the<br />
value of its acreage. I believe<br />
that <strong>Santos</strong> has scope to gain<br />
more from the knowledge and<br />
creativity of its employees. Oil<br />
and gas is an ideas business<br />
and that makes it a people<br />
business. Getting the best from<br />
your people is critical. We will win<br />
or lose based on the calibre of<br />
our people. Information sharing,<br />
teamwork and constructive<br />
debate are important too.<br />
My second immediate priority<br />
is to start creating a more<br />
productive internal culture,<br />
leading to performance<br />
improvement.<br />
I believe in performance-based<br />
management. This means<br />
being able to benchmark the<br />
Company as a whole against its<br />
peers, as well as being able to<br />
benchmark specific operations<br />
against world’s best practice.<br />
This will require development<br />
of the Company’s information<br />
management systems and<br />
performance measurement<br />
processes to improve value focus<br />
throughout the organisation.<br />
I also believe in performancebased<br />
remuneration. However,<br />
the right business processes<br />
need to be in place before that<br />
is introduced.<br />
Speed of decision-making is also<br />
important, provided that it is factbased.<br />
The aim is not only to<br />
make the right decisions but to<br />
make them quickly. <strong>Santos</strong> has<br />
the assets of a major company; it<br />
needs to have the nimbleness of<br />
a small operator.<br />
I have been impressed by the<br />
energy and enthusiasm of the<br />
people I have met across the<br />
Company and their desire to<br />
see change.<br />
External Relationships<br />
My third priority is to build our<br />
relationships with other industry<br />
players, our customers, suppliers<br />
and investors.<br />
These relationships need to be<br />
as productive as possible.<br />
We also need to build stronger<br />
relationships with our customers<br />
and suppliers, and work with<br />
them to add value to all our<br />
collective organisations.<br />
This may require greater<br />
sophistication in our commercial<br />
arrangements and changes in<br />
practices to foster cooperation<br />
and enable <strong>Santos</strong> to be solution<br />
providers and not just bulk sellers<br />
of products.<br />
Lastly, investors ultimately<br />
determine the fate of any<br />
company, whether they are large<br />
institutions or small shareholders.<br />
Thus, good relationships with<br />
providers of our capital are also<br />
important.<br />
Conclusion<br />
I have been with <strong>Santos</strong> for<br />
less than three months and the<br />
achievements made during 2000<br />
reflect the work of everyone<br />
across the Company.<br />
I would like to thank all<br />
employees for providing such<br />
a solid base from which to start.<br />
My vision for <strong>Santos</strong> is that it<br />
becomes the most admired E&P<br />
company, with the best people<br />
and best performance in an<br />
environment that is challenging<br />
for all.<br />
I look forward to reporting back<br />
regularly on how we are going.<br />
J C Ellice-Flint,<br />
Managing Director<br />
9 March 2001
AN OUTSTANDING YEAR<br />
2000 FINANCIAL HIGHLIGHTS & OVERVIEW<br />
7<br />
2000 – OUR OBJECTIVES<br />
Total production to exceed 51 million boe before acquisitions.<br />
Grow Australian gas sales through finding additional gas<br />
reserves and securing new and extending existing contracts.<br />
Increase exploration effort and review and upgrade the<br />
exploration portfolio.<br />
Add further value to the business through acquisitions.<br />
Profit to exceed $300 million.<br />
2000 – WHAT WE ACHIEVED<br />
In 2000 total production was 53 million boe or 4% above<br />
the 2000 target after excluding the acquisition of Barrow<br />
and Thevenard Islands.<br />
<strong>Santos</strong> was able to grow total domestic gas sales by 8% to<br />
210 PJ. <strong>Santos</strong> signed a gas contract with CS Energy to supply<br />
120 petajoules over 10 to 15 years.<br />
Offshore Australia Business Unit developed an inventory of<br />
20 prospects and leads for drilling in 2001 and 2002.<br />
<strong>Santos</strong> acquired Shell Australia’s Barrow and Thevenard<br />
Islands interests adding 3 million boe to annual production<br />
and 43 million boe to reserves.<br />
<strong>Santos</strong> achieved a record $487 million profit.<br />
> Record sales of $1,497 million, up 59%<br />
> Net profit of $487 million, up 122%<br />
> Total dividend of 40 cents<br />
> 30 cent ordinary dividend, fully franked<br />
> 10 cent special dividend, fully franked<br />
> 22% return on equity<br />
> Record production of 56 million barrels<br />
of oil equivalent<br />
> Gearing fell to 38%<br />
> QCT Resources Limited investment<br />
sold in October 2000<br />
> Acquisition of a number of Carnarvon<br />
Basin oil and gas assets from Shell<br />
Australia<br />
> Successful private placement of<br />
US$290 million of notes to US<br />
institutions<br />
percent<br />
KEY FINANCIAL RESULTS 2000 1999<br />
Sales $ millions 1,497 945<br />
Operating Profit before Income Tax $ millions 726 340<br />
Net Profit after Tax before abnormals 487 219<br />
Cashflow from Operations $ millions 1,023 530<br />
Earnings per Share 80 cents 36 cents<br />
Dividends per Share 40 cents 27 cents<br />
Cash Flow per Share $1.68 $0.87<br />
Total Shareholders’ Funds $ millions 2,311 2,057<br />
Return on Average Equity 22% 11%<br />
Gearing net debt/equity 38% 63%<br />
Net Interest <strong>Cover</strong> 9.1 times 5.2 times<br />
<strong>Santos</strong>’ Five Year Share Price Performance<br />
100<br />
80<br />
60<br />
40<br />
20<br />
0<br />
-20<br />
1996<br />
1997<br />
1998<br />
1999 2000<br />
<strong>Santos</strong> All Ords Energy Index
2000 FINANCIAL HIGHLIGHTS & OVERVIEW<br />
8<br />
Sales Revenue a<br />
<strong>Santos</strong> Record<br />
<strong>Santos</strong> Delivers<br />
Profit Growth<br />
Higher Production<br />
Delivered in 2000<br />
Operating Cashflow<br />
a Record<br />
• Sales revenues increased<br />
to $1,497 million, up 59%.<br />
• 30% of the increase in sales<br />
revenue came from an increase<br />
in sales volumes and 70% from<br />
an increase in average realised<br />
prices.<br />
• The average realised crude oil<br />
price was up 69% to A$46.54<br />
in 2000.<br />
• Sales volumes increased by<br />
15% to 55.7 million barrels of<br />
oil equivalent.<br />
• <strong>Santos</strong> reported a 122% rise<br />
in profitability to $487 million.<br />
• Higher sales volumes and<br />
higher realised prices drove<br />
the profit increase in 2000.<br />
• With an A$45 per barrel average<br />
oil price, <strong>Santos</strong> would expect<br />
to be able to equal the 2000<br />
result in 2001.<br />
• Production grew by 14%<br />
to 56 million barrels of oil<br />
equivalent.<br />
• 2000 is the fifth successive year<br />
<strong>Santos</strong> has increased production.<br />
• Crude oil production grew by<br />
48% driven by the Barrow and<br />
Thevenard Islands acquisitions<br />
and increased Stag production.<br />
• Gas production increased<br />
by 6% to 215 PJ as a result<br />
of increased production in<br />
Queensland, Western Australia<br />
and Victoria.<br />
• Operating cashflow of $1,023<br />
million is a <strong>Santos</strong> record.<br />
• Surplus cash flow was used<br />
to reduce debt.<br />
• Proceeds from the sale of the<br />
QCT Resources Limited stake<br />
($326 million) contributed to<br />
debt reduction.<br />
Sales Revenue<br />
Net Profit After Tax<br />
Production by Product<br />
Operating Cash Flow<br />
1600<br />
1400<br />
1200<br />
1000<br />
$million<br />
800<br />
600<br />
400<br />
200<br />
0<br />
769<br />
1998<br />
945<br />
1497<br />
1999 2000<br />
Price<br />
70%<br />
Volume<br />
30%<br />
$million<br />
500<br />
400<br />
300<br />
200<br />
100<br />
0<br />
176<br />
1998<br />
219<br />
487<br />
1999 2000<br />
mmboe<br />
60<br />
50<br />
40<br />
30<br />
20<br />
10<br />
0<br />
46<br />
1998<br />
49<br />
56<br />
1999 2000<br />
$million<br />
1200<br />
1000<br />
800<br />
600<br />
400<br />
200<br />
0<br />
458<br />
1998<br />
530<br />
1023<br />
1999 2000<br />
Sales Gas & Ethane<br />
Crude Oil & Liquids<br />
Sales Gas<br />
Condensate<br />
Crude Oil<br />
LPG
2000 FINANCIAL HIGHLIGHTS & OVERVIEW<br />
9<br />
Strong Shareholder<br />
Returns<br />
• <strong>Santos</strong> shareholders benefited<br />
from a 45% increase in the<br />
share price during 2000.<br />
• Earnings per share increased<br />
by 121%.<br />
• Total ordinary dividend of<br />
30 cents was declared in<br />
2000, fully franked.<br />
• A 10 cents special dividend<br />
was also declared, fully franked.<br />
Return onEquity<br />
Above 20%<br />
• Return on average equity<br />
increased to 22% from 11%.<br />
• Higher return on equity<br />
reflects higher attributable<br />
profits in 2000.<br />
• Shareholders’ equity<br />
increased to $2,311 million<br />
from $2,057 million.<br />
• Return on average capital<br />
employed was 16.7%<br />
Strong Balance Sheet<br />
• Gearing (net debt to equity)<br />
fell to 38%.<br />
• Higher cash flow and the<br />
proceeds from the sale of the<br />
QCT Resources Limited shares<br />
were used to reduce net debt<br />
to $867 million.<br />
• Low gearing provides <strong>Santos</strong><br />
with the flexibility to grow.<br />
• Successful private<br />
placement of a US$290 million<br />
bond to US institutions. Bond<br />
issue oversubscribed by<br />
US$90 million.<br />
Exploration and<br />
Development Expenditure<br />
• Total exploration and<br />
development expenditure<br />
was $441 million, up 48%.<br />
• Exploration expenditure<br />
increased by 28% to<br />
$100 million.<br />
• Higher exploration expenditure<br />
reflects a focus on increased<br />
drilling program in both<br />
onshore and offshore Australia.<br />
• Development expenditure<br />
increased by 55% to<br />
$341 million.<br />
• Average debt maturity 5.0 years.<br />
• Increased development activity<br />
in the Cooper Basin and<br />
offshore Australia drove the<br />
higher spending.<br />
• <strong>Santos</strong> expects to increase<br />
development expenditure in<br />
2001 to meet the needs of<br />
significant development<br />
projects (Bayu/Undan,<br />
Legendre, Barrow and<br />
Thevenard Islands).<br />
Returns<br />
Return on Average Equity<br />
Net Debt and Gearing<br />
Exploration and Development<br />
cents per share<br />
90<br />
80<br />
70<br />
60<br />
50<br />
40<br />
30<br />
20<br />
10<br />
0<br />
80<br />
36<br />
40<br />
25 29 27<br />
1998 1999 2000<br />
percent<br />
25<br />
20<br />
15<br />
10<br />
5<br />
0<br />
9<br />
1998<br />
11<br />
22<br />
1999 2000<br />
1400<br />
1280 1301<br />
140<br />
1200<br />
120<br />
1000<br />
100<br />
867<br />
800 80<br />
$million<br />
600<br />
400<br />
200<br />
0<br />
66.0<br />
60<br />
63.0<br />
40<br />
37.5<br />
20<br />
0<br />
1998 1999 2000<br />
percent<br />
$million<br />
600<br />
500<br />
400<br />
300<br />
200<br />
100<br />
0<br />
505<br />
1998<br />
441<br />
294<br />
1999 2000<br />
Earnings per share<br />
Net Debt<br />
Gearing<br />
Development<br />
Exploration<br />
Dividends per share
“Securing this<br />
facility was<br />
a significant<br />
and fulfilling<br />
challenge for<br />
my team.”<br />
Dean Bowman<br />
Group Treasurer<br />
Dean Bowman,<br />
Group Treasurer,<br />
pictured here with<br />
Bronte Hollow,<br />
Treasury Administrator<br />
DELIVERING<br />
FINANCE FLEXIBILITY<br />
Graeme Bethune<br />
General Manager, Finance & Investor Relations<br />
The securing of the US$290 million note facility gives<br />
<strong>Santos</strong> greater flexibility in financing going forward.
DELIVERING<br />
HIGHER PRODUCTION<br />
John Armstrong General Manager, Offshore Australia Business Unit<br />
The Barrow Island assets have added significant oil reserves and production<br />
at a time of high oil prices. They bring long-term stable production with<br />
upside through enhanced oil recovery projects and in unproduced oil zones<br />
and undeveloped oil and gas discoveries.We are also pleased with the<br />
Thevenard Island fields and are investigating opportunities to improve<br />
their performance.<br />
“It is exciting<br />
to be<br />
working on<br />
assets for<br />
which we<br />
were part<br />
of the<br />
successful<br />
bid team”<br />
Tom Paspaliaris, Staff Petroleum<br />
Engineer and Ian Pedler, Senior<br />
Staff Reservoir Engineer,<br />
Offshore Australia Business Unit
12<br />
BUSINESS UNIT<br />
OPERATIONS<br />
BUSINESS GENERAL OPERATIONAL<br />
UNIT MANAGER PROFILE<br />
South Australia Jon Young Cooper/Eromanga<br />
Basins (South Australia)<br />
> Exploration acreage<br />
> Production of sales<br />
gas and ethane, oil,<br />
condensates and LPG<br />
Port Bonython Liquids<br />
Processing Plant<br />
> LPG extraction and<br />
liquids processing<br />
Onshore and Offshore<br />
Otway Basins<br />
> Exploration acreage<br />
> Production of sales<br />
gas and condensates<br />
Offshore Bass Basin<br />
> Exploration acreage<br />
Offshore Gippsland<br />
Basin<br />
> Exploration acreage<br />
Queensland and<br />
Northern Territory<br />
Rod McArdle<br />
Cooper/Eromanga<br />
Basins (South-West<br />
Queensland)<br />
> Exploration acreage<br />
> Production of sales gas,<br />
oil and condensates<br />
Surat/Bowen Basins<br />
> Exploration acreage<br />
> Production of sales gas,<br />
oil and condensates<br />
Amadeus Basin<br />
> Exploration acreage<br />
> Production of sales<br />
gas and oil<br />
Offshore Australia John Armstrong Exploration acreage<br />
> Timor Sea<br />
> Carnarvon Basin<br />
> Browse Basin<br />
Production<br />
> Oil (Stag, Chervil, and<br />
Barrow and Thevenard<br />
Islands fields) and sales<br />
gas and condensate<br />
(East Spar field)<br />
> Oil – Elang/Kakatua/<br />
Kakatua North fields<br />
(Timor Gap); Jabiru<br />
and Challis (Timor Sea)<br />
South East Asia Bob Hall Exploration acreage<br />
Indonesia<br />
> Warim<br />
> Bentu<br />
> Korinci-Baru<br />
> Sampang<br />
Papua New Guinea<br />
> SE Gobe field<br />
Production<br />
> SE Gobe field (oil)<br />
United States<br />
President<br />
To be appointed<br />
Exploration acreage<br />
Offshore<br />
> Gulf of Mexico<br />
Onshore<br />
> Texas and Louisiana<br />
Gulf Coast; and Arkoma<br />
Basin in Oklahoma<br />
Production<br />
> Texas Gulf Coast<br />
(gas – Runnells–3<br />
and Mew–1)<br />
> Gulf of Mexico<br />
(gas and oil)
13<br />
GEOGRAPHIC KEY BUSINESS<br />
Sales gas and ethane<br />
> South Australia, New<br />
South Wales, ACT,<br />
and Victoria<br />
Oil and condensate<br />
> Domestic and<br />
international<br />
Reserves<br />
> Gas – 1575 PJ<br />
> Oil – 16 (mmbbl)<br />
> Condensate –<br />
20.8 (mmbbl)<br />
> LPG – 2637<br />
(’000 tonnes)<br />
Production<br />
> Gas – 105 PJ<br />
> Oil – 1.8 (mmbbl)<br />
> Condensate –<br />
1.5 (mmbbl)<br />
> LPG – 178<br />
(’000 tonnes)<br />
Sales revenue –<br />
$511 million<br />
Net assets –<br />
$918 million<br />
LPG<br />
> International<br />
Sales gas and ethane<br />
> South Australia,<br />
Northern Territory<br />
and Queensland<br />
Oil and condensate<br />
> Domestic and<br />
international<br />
Reserves<br />
> Gas – 1585 PJ<br />
> Oil – 14.6 (mmbbl)<br />
> Condensate –<br />
19.8 (mmbbl)<br />
> LPG – 1357<br />
(’000 tonnes)<br />
Production<br />
> Gas – 87.5 PJ<br />
> Oil – 1.9 (mmbbl)<br />
> Condensate –<br />
1.0 (mmbbl)<br />
> LPG – 85.7<br />
(’000 tonnes)<br />
Sales revenue –<br />
$430 million<br />
Net assets –<br />
$363 million<br />
Sales gas and ethane<br />
> Western Australia<br />
Oil and condensate<br />
> Domestic and<br />
international<br />
Reserves<br />
> Gas – 745 PJ<br />
> Oil – 61.4 (mmbbl)<br />
> Condensate –<br />
40.7 (mmbbl)<br />
> LPG – 1510<br />
(’000 tonnes)<br />
Production<br />
> Gas – 19 PJ<br />
> Oil – 9.3 (mmbbl)<br />
> Condensate –<br />
1.1 (mmbbl)<br />
Sales revenue –<br />
$359 million<br />
Net assets –<br />
$359 million<br />
Oil<br />
> International<br />
Reserves<br />
> Gas – 146 PJ<br />
> Oil – 3.1 (mmbbl)<br />
Production<br />
> Gas – no production<br />
in 2000<br />
> Oil – 0.4 (mmbbl)<br />
Sales revenue –<br />
$21 million<br />
Net assets –<br />
$8 million<br />
Sales gas and ethane<br />
> United States<br />
Oil and condensate<br />
> United States<br />
Reserves<br />
> Gas – 34 PJ<br />
> Oil – 1.5 (mmbbl)<br />
Production<br />
> Gas – 3.7 PJ<br />
> Oil & condensate –<br />
0.1 (mmbbl)<br />
Sales revenue –<br />
$26 million<br />
Net assets –<br />
$130 million<br />
(A)<br />
Excludes group net assets of $533 million.
REVIEW OF PERFORMANCE<br />
EXPLORATION<br />
14<br />
KEY FACTS<br />
> Successful appraisal of the<br />
Scotia Field in the Bowen<br />
Basin (eastern Queensland)<br />
resulting in a decision to<br />
commercialise the field.<br />
> Two significant new field<br />
discoveries in onshore US.<br />
> Encouraging results in<br />
South Australia from<br />
Moomba oil exploration.<br />
> A new gas discovery in the<br />
onshore Otway Basin with<br />
promising indications from<br />
3D seismic.<br />
> 3-year rolling average<br />
exploration finding cost<br />
of $4.11<br />
> 52% exploration success rate.<br />
Exploration Allocation<br />
by Business Unit<br />
2000 3%<br />
14%<br />
14%<br />
24%<br />
18%<br />
27%<br />
South Australia<br />
Queensland & Northern Territory<br />
Offshore Australia<br />
South East Asia<br />
United States<br />
Other (low deliverability gas)<br />
<strong>Santos</strong>’ Exploration Strategy<br />
> Build upon accumulated knowledge and experience in the Cooper/Eromanga<br />
Basins to add value via the discovery of additional reserves.<br />
> Pursue diversification of the business outside the Cooper/Eromanga Basins via<br />
participation in offshore Australia and focussed exploration opportunities in Papua<br />
New Guinea, Indonesia and the USA.<br />
> Actively manage the risk profile of exploration expenditure.<br />
> Actively and rigorously manage the exploration acreage portfolio through farm-outs,<br />
farm-ins and relinquishment to optimise the expenditure and exposure of the<br />
exploration program.<br />
> Cost effectively apply modern technologies using skilled people.<br />
Exploration 2000<br />
The year 2000 was a year<br />
of consolidation for <strong>Santos</strong><br />
exploration, with a focus on<br />
seismic acquisition and<br />
interpretation, and reviewing<br />
the exploration target portfolio,<br />
especially in offshore Australia.<br />
During 2000 <strong>Santos</strong> drilled<br />
42 wells. <strong>Santos</strong>’ exploration<br />
program targeted lower risk<br />
prospects reflected by the fact<br />
that exploration was primarily<br />
focussed on the gas program,<br />
representing 74% of total<br />
expenditure. The oil program was<br />
centred on offshore Australia and<br />
consisted of 11 wells in an effort<br />
to define fairways and ultimate<br />
prospectivity, plus substantial<br />
investment in 2D and 3D seismic.<br />
The Company booked 24 million<br />
boe of oil and gas reserves at the<br />
end of the year:<br />
2000 EXPLORATION RESULTS<br />
> The South Australia Business<br />
Unit drilled ten wells achieving<br />
a 90% success rate and<br />
discovered 11.3 million boe.<br />
This included the Moomba<br />
104 and 119 oil discoveries.<br />
> The Queensland and Northern<br />
Territory Business Unit<br />
participated in nineteen wells,<br />
achieved a 53% success rate<br />
and discovered 9.2 million boe.<br />
> The Offshore Australia Business<br />
Unit drilled five wells, all targeting<br />
oil, but without success.<br />
> The South East Asia Business<br />
Unit drilled one well, Anggur-1,<br />
in Indonesia. This well<br />
encountered gas at a shallow<br />
depth and will be followed up<br />
in 2001.<br />
> Seven wells were drilled in the<br />
USA with a 43% success rate.<br />
Total discoveries amounted to<br />
3.4 million boe.<br />
Two of the exploration highlights<br />
of the year were the Moomba<br />
104 oil discovery in the South<br />
Australian Cooper Basin and<br />
Runnells–3 gas and liquids<br />
discovery in the United States.<br />
Moomba 104, which was drilled<br />
in February 2000, penetrated<br />
a nine metre oil column in the<br />
Jurassic Hutton Sandstone and<br />
was cased and suspended as an<br />
oil producer. The well was brought<br />
into production in March 2000.<br />
Runnells–3 was a wildcat onshore<br />
discovery. The well was drilled<br />
to test deep, geopressured Frio<br />
Sands. The well did not reach<br />
target depth but a total of 168<br />
feet of net pay was logged in four<br />
Frio pay intervals. The well was<br />
pressure tested at an unstimulated<br />
daily flow rate of 22 million cubic<br />
feet of natural gas and 494 barrels<br />
of condensate. Further follow-up<br />
drilling will occur in 2001.<br />
Wells Drilled Successful Wells Success<br />
Gas Oil Gas Oil Rate %<br />
South Australia 8 2 7 2 90<br />
Queensland 15 4 9 1 53<br />
Offshore Australia 0 5 0 0 (A)<br />
South East Asia 1 0 0 0 0<br />
US 7 0 3 0 43<br />
Total 31 11 19 3 52<br />
(A) encountered gas, to be appraised
15<br />
dollars per boe<br />
Exploration success is<br />
closely related to an<br />
organisation’s depth of<br />
knowledge of the areas<br />
being worked. Success is<br />
achieved by maintaining a<br />
focus on key geographical<br />
areas. <strong>Santos</strong> is primarily<br />
focussed on opportunities<br />
in Australia (Cooper Basin,<br />
Surat/Denison Trough and<br />
North West Shelf); South<br />
East Asia (Indonesia and<br />
Papua New Guinea<br />
foldbelt); and North<br />
America (onshore and<br />
offshore Gulf Coast).<br />
5<br />
4<br />
3-Year Rolling Average<br />
Finding Costs<br />
3 2.8<br />
2<br />
1<br />
0<br />
1998<br />
3.2<br />
4.1<br />
1999 2000<br />
2000 SEISMIC PROGRAM<br />
2000 Seismic Program<br />
5,674 kilometres of 2D and<br />
2,048 kilometres of 3D seismic<br />
were acquired in 2000 in onshore<br />
and offshore Australia enhancing<br />
<strong>Santos</strong>’ ability to assess future<br />
exploration prospects.<br />
SABU QNTBU OABU SEABU SUSAC<br />
2 Dimensional (km) 238 1120 4215 54 47<br />
3 Dimensional (km 2 ) 296 193 928 0 631<br />
Future Exploration<br />
Program<br />
Oil and gas companies aim to<br />
more than replace production<br />
each year through exploration.<br />
<strong>Santos</strong> has not achieved this in<br />
recent years, resulting in a fall in<br />
reserves. Part of this outcome is<br />
the result of the increased levels<br />
of gas production the Company<br />
has achieved. However, rectifying<br />
this situation is a priority. Top<br />
performing companies typically<br />
have a production replacement<br />
ratio of 150%. Some of the steps<br />
<strong>Santos</strong> plans to take are:<br />
> High grading acreage through<br />
regional studies;<br />
> Reducing drilling costs to<br />
increase the number of wells<br />
drilled for a given budget;<br />
> Improving risk management;<br />
and<br />
> Taking a more programmed<br />
approach to exploration.
REVIEW OF PERFORMANCE<br />
DEVELOPMENT<br />
16<br />
2000 DEVELOPMENT EXPENDITURE ($million)<br />
2000 Development<br />
Program<br />
<strong>Santos</strong> spent $341 million<br />
on development in 2000, with<br />
significant spending increases<br />
in the Cooper Basin and on<br />
major Offshore Australia projects.<br />
In South Australia 49<br />
development wells were drilled<br />
(13 in 1999), five compression<br />
facilities were installed and<br />
55 fracture stimulations were<br />
executed (20 in 1999). A large<br />
part of the 2000 South Australian<br />
program focussed on gas<br />
development to meet continuing<br />
strong gas demand.<br />
1999 2000<br />
South Australia 85 135<br />
Queensland 84 109<br />
Offshore Australia 33 72<br />
South East Asia 2 9<br />
US 3 5<br />
Other 12 11<br />
Total 219 341<br />
In 2000 <strong>Santos</strong> conducted<br />
several studies and field trials<br />
aimed at commercialisation of low<br />
deliverability gas reservoirs in the<br />
Nappamerri Trough. Progress was<br />
made on fracture placement and<br />
effectiveness through the Kirby-2<br />
and Wantana-1 fracture<br />
stimulation projects. Studies<br />
also focussed on developing<br />
techniques to locate and exploit<br />
areas of enhanced reservoir<br />
quality, or sweet spots, within<br />
tight gas regions.<br />
During the year the Moomba<br />
104 oil pool was also developed.<br />
In Queensland 20 development<br />
wells were drilled (10 in 1999),<br />
five compression facilities installed<br />
and 22 gas well projects executed<br />
(6 in 1999). As in South Australia,<br />
most of the Queensland program<br />
was focussed on gas. Total gas<br />
deliverability by the Business Unit<br />
exceeded 500 TJ per day in<br />
winter 2000.<br />
The south-west Queensland gas<br />
drilling program had good results.<br />
One of the highlights was a<br />
three-well program of multilateral<br />
high-angle wells in the Challum<br />
field. Initial production from one<br />
of these wells was the highest<br />
ever recorded from a Queensland<br />
well (36 TJ per day).<br />
The Barrolka appraisal drilling<br />
program recommenced in 2000<br />
with a three-well underbalanced<br />
drilling program. Barrolka 4<br />
provided useful reservoir<br />
information and allowed testing of<br />
the underbalanced drilling system<br />
and procedures. Barrolka 5DW<br />
was cased and completed as a<br />
gas producer.<br />
A total of $72 million was spent<br />
on development in Offshore<br />
Australia during the year. This<br />
included:<br />
> Additional drilling activity at<br />
Stag (which lifted production to<br />
a peak of over 30,000 barrels<br />
of oil per day).<br />
> Drilling of five development<br />
wells at Barrow and Thevenard<br />
Islands.<br />
> Development of the Bayu-<br />
Undan Project (liquids phase)<br />
on which <strong>Santos</strong> spent<br />
$29 million during 2000. The<br />
Company’s share of remaining<br />
expenditure from 2001 to first<br />
production is around<br />
$290 million. This field is<br />
scheduled to commence<br />
production in early 2004.<br />
> Development of the Legendre<br />
oil field, on which <strong>Santos</strong> spent<br />
$12 million in 2000.<br />
Expenditure on Legendre in<br />
2001 is expected to be<br />
$13 million, scheduled to come<br />
onstream mid-2001.<br />
2001 Development<br />
Program<br />
The 2001 development budget<br />
is $500 million, up 47% on 2000.<br />
Spending on onshore Australia<br />
is expected to remain at high<br />
levels. Gas expenditure in<br />
South Australia and southwest<br />
Queensland is expected<br />
to continue at current levels<br />
reflecting the high level of<br />
production. The Queensland<br />
development program also<br />
reflects the cost of developing<br />
the Scotia field in the Denison<br />
Trough at a total cost to <strong>Santos</strong><br />
of $15 million.<br />
The Offshore Australia<br />
Business Unit development<br />
program will focus on oil<br />
development activities and<br />
will involve the drilling of four<br />
Legendre development wells<br />
together with one reinjection well;<br />
two, possibly three wells at Stag<br />
and three Thevenard and 12<br />
Barrow infill wells. Thevenard oil<br />
development includes $17 million<br />
for the replacement and repair<br />
of the Roller pipeline. Legendre<br />
expenditure is forecast to incur<br />
$13 million in addition to the<br />
$12 million spent in 2000 and<br />
production is expected to<br />
commence mid-2001. The<br />
Bayu-Undan gas liquids scheme<br />
is forecast to incur $88 million in<br />
2001. The project will develop<br />
33 mmboe of reserves and will<br />
add 3.4 mmboe to <strong>Santos</strong>’<br />
production in the first 12 months<br />
of production, beginning in 2004.
17<br />
Opening New Frontiers<br />
and extracting Hidden<br />
Value through Innovative<br />
Technology<br />
<strong>Santos</strong> has focussed on<br />
continued application of<br />
technology to extract maximum<br />
benefits for the company through:<br />
Resource Commercialisation ➔<br />
coal-bed methane from<br />
Scotia Field<br />
The major development work<br />
program to bring gas on line from<br />
the Scotia Field by January 2002<br />
will commence in 2001.<br />
Deliverability ➔ Challum<br />
Field high angle multilateral<br />
drilling program<br />
Three high-angle multilateral wells<br />
were drilled in the Challum Field.<br />
This is the first time this type of<br />
well has been drilled in onshore<br />
Australia, with the implementation<br />
of this technology reducing unit<br />
development costs and providing<br />
more gas deliverability than<br />
conventional vertical fracture<br />
stimulated wells. The<br />
implementation of high-angle<br />
and dual-stacked lateral well<br />
technology to the Challum Field<br />
has improved the Field’s<br />
profitability by reducing both the<br />
cost of development and the cost<br />
of deliverability.<br />
Cost Savings ➔ Moomba North<br />
Field development program<br />
A major development program<br />
was undertaken in the Moomba<br />
North Field. The development<br />
activities included a 17-well<br />
drilling program that delivered<br />
an incremental 49 MMscf/d gas,<br />
developed reserves of 68 PJ<br />
(13.7 mmboe) and realised over<br />
25% in cost savings compared<br />
with previous best practice.<br />
This successful campaign<br />
gas development sets new<br />
benchmarks for onshore field<br />
development.<br />
Profitability ➔ Optimal<br />
exploitation of Moomba<br />
thin oil reservoirs<br />
<strong>Santos</strong> has demonstrated with<br />
Moomba 102DW that high-angle<br />
wells are the optimum method for<br />
developing <strong>single</strong> well oil pools<br />
with thin oil columns of less than<br />
15 feet. The high-angle section<br />
is able to maximise oil rate and<br />
increase recovery sweep<br />
efficiency, increasing project<br />
profitability. Previous uneconomic<br />
oil pools are being re-assessed<br />
in 2001 using this technology.<br />
Improving Existing Technology<br />
➔ Fracture Stimulation<br />
Fracture stimulation is a core<br />
business in the Cooper Basin,<br />
with a record 55 fracture<br />
stimulation projects to increase<br />
deliverability executed in 2000.<br />
<strong>Santos</strong> has made significant<br />
advances in its fracture<br />
stimulation practices, cost<br />
reduction initiatives and<br />
technologies.<br />
This is crucial to developing<br />
the gas resource in the<br />
Nappamerri Trough and other<br />
regions of the Cooper Basin, as<br />
well as optimising the exploitation<br />
of significantly depleted reservoirs<br />
previously considered too<br />
difficult to fracture stimulate.<br />
The success of this technology<br />
has considerable scope to<br />
improve the performance of<br />
other low pressure, currently<br />
producing, wells.<br />
Challum Multilateral Well Configuration<br />
9 5/8” Casing @ approx. 3300 ft<br />
Extracting maximum value<br />
from existing tools ➔ Seismic<br />
multi-attribute analysis<br />
Seismic multi-attribute analysis<br />
is a new statistical procedure<br />
that attempts to predict<br />
geological properties away<br />
from well control by combining<br />
the seismic response with known<br />
well data. Geological properties<br />
derived from this technique have<br />
been used by geologists in<br />
developing depositional models<br />
and as a tool in refining drilling<br />
locations to maximise reservoir<br />
intersection. This methodology<br />
has been further advanced in<br />
2000 in combination with recent<br />
well results, and is now gaining<br />
recognition as an important tool<br />
in extracting the maximum<br />
reservoir information from<br />
seismic response.<br />
• Approx. 1500 ft in Middle/Lower Toolachee Sands<br />
• Approx. 1100 ft in Upper Sand<br />
P2 Coal<br />
6” Open Hole<br />
Reservoir “A”<br />
Coal<br />
Reservoir “B”<br />
7” Casing<br />
Coal<br />
Reservoir “C”
REVIEW OF PERFORMANCE<br />
RESERVES<br />
18<br />
mmboe<br />
KEY FACTS<br />
> Total proved and probable<br />
reserves of 921 million boe.<br />
> Average reserve life of 16.5<br />
years.<br />
> 49 million boe added through<br />
acquisitions.<br />
> 24 million boe added through<br />
exploration and appraisals.<br />
> Revisions reduced reserves<br />
by 37 million boe.<br />
1000<br />
800<br />
600<br />
400<br />
200<br />
0<br />
Reserves<br />
966<br />
21<br />
1998<br />
941<br />
19<br />
921<br />
16<br />
1999 2000<br />
Reserves/production ratio<br />
Reserves<br />
25<br />
20<br />
15<br />
10<br />
5<br />
0<br />
average reserve life (years)<br />
<strong>Santos</strong> has proved and<br />
probable reserves of 921<br />
million boe. Gas reserves<br />
are equivalent to an<br />
average of 19 years of<br />
2000 production and oil<br />
and liquids reserves are<br />
equivalent to 11.5 years.<br />
Wildcat exploration additions<br />
comprised 14.4 million boe from<br />
2000 activity. The South Australia<br />
Business Unit contributed<br />
5.4 million boe, Queensland and<br />
Northern Territory 5.6 million boe,<br />
and <strong>Santos</strong> USA 3.4 million boe.<br />
Appraisal activity on existing fields<br />
added 9.9 million boe comprising<br />
5.8 million boe in the South<br />
Australia Business Unit and<br />
4.1 million boe in the Queensland<br />
and Northern Territory Business<br />
Unit. The 49 million boe added<br />
from acquisitions reflects the<br />
acquisition of Shell’s assets in<br />
Barrow and Thevenard Islands<br />
(43 million boe) and an extra 7%<br />
share in the Kipper Field offshore<br />
in east Gippsland. The positive<br />
results of a redetermination of<br />
reserves in SE Gobe (PNG) are<br />
also included, offsetting small<br />
divestments in the United States.<br />
Reserves in existing fields<br />
were revised downwards<br />
by 37.2 million boe primarily<br />
in the Cooper Basin and<br />
Northern Territory.<br />
Resources potential<br />
Resources potential excluded<br />
from the year end reserves<br />
figures is discovered oil and gas<br />
accumulations which currently<br />
fall outside the definition of<br />
proved and probable reserves.<br />
This resource is known to exist<br />
and will become reserves if<br />
technical, infrastructure and<br />
market issues are resolved.<br />
The Company’s most significant<br />
resources in its portfolio include<br />
the Hides and Petrel/Tern gas<br />
fields, oil and gas at Barrow<br />
Island, other gas in the Carnarvon<br />
Basin and low deliverability gas in<br />
the Cooper Basin.<br />
PROVED & PROBABLE HYDROCARBON RESERVES<br />
Sales Gas Crude Oil Condensate LPG Total<br />
(incl Ethane) (PJ) Million barrels Million barrels (‘000 tonnes) (mmboe)<br />
Estimated reserves at 31/12/99 4338 70 86 5326 941<br />
2000 Production (215) (13) (4) (263) (56)<br />
Additions from 2000 Exploration 62 2 1 71 14<br />
Appraisal existing fields 51 – 1 63 10<br />
Revisions existing fields (202) (2) (3) 256 (37)<br />
Acquisitions/Divestment 50 40 0 52 49<br />
Estimated reserves at 31/12/00 4084 97 81 5505 921
REVIEW OF PERFORMANCE<br />
AUSTRALIAN GAS<br />
19<br />
KEY FACTS<br />
> <strong>Santos</strong> sold a record 210 PJ<br />
of sales gas and ethane to<br />
Australian customers.<br />
> <strong>Santos</strong> signed a contract with<br />
CS Energy for 120 PJ of gas<br />
over a 10 to 15 year period.<br />
> East Spar sales increased by<br />
68% to 17 PJ.<br />
> Victorian Otway Basin<br />
delivered five PJ of gas in<br />
its first full-year of production.<br />
Australian Gas & Ethane Sales<br />
by Business Unit<br />
8%<br />
51%<br />
<strong>Santos</strong>’ ability to compete<br />
in Eastern Australian gas<br />
was highlighted during<br />
2000 by the new contract<br />
with CS Energy in<br />
Queensland.<br />
In 2000 <strong>Santos</strong> delivered a<br />
record 210 PJ of gas to the<br />
Australian market. All business<br />
units increased gas sales<br />
reflecting growing demand<br />
for domestic gas during 2000.<br />
Offshore Australia gas sales<br />
grew to 17 PJ. Steadily growing<br />
demand for Cooper Basin gas<br />
resulted in eastern Australia gas<br />
sales growing to 193 PJ. 2000<br />
was the first full year of delivery<br />
of gas to WMC Fertilisers. <strong>Santos</strong><br />
announced an agreement to<br />
supply up to 120 PJ of gas<br />
from the Scotia Field over 10 to<br />
15 years to CS Energy Ltd,<br />
a Queensland Governmentowned<br />
electricity generator.<br />
<strong>Santos</strong> also commenced supply<br />
under an additional East Spar<br />
gas contract to the South West<br />
Cogeneration Project.<br />
<strong>Santos</strong> Gas Operations<br />
Onshore Australia gas operations<br />
account for 89% of gas sales.<br />
The core operations are located<br />
in the South Australian Cooper<br />
Basin and south-west Queensland.<br />
Gas from the Cooper Basin is<br />
distributed to customers in South<br />
Australia, the Australian Capital<br />
Territory, Victoria and New South<br />
Wales via the Moomba facility<br />
and in Queensland via the<br />
Ballera facility. Ethane is also<br />
sold to Qenos Ltd in New South<br />
Wales. <strong>Santos</strong> has other gas<br />
producing areas located in the<br />
Northern Territory, Western<br />
Australia and Victoria.<br />
Deregulation in<br />
the Australian<br />
Gas Market<br />
Creating newopportunities<br />
for gas deliveries<br />
During the year approximately<br />
8 PJ of Cooper Basin gas was<br />
sold into Victoria. The Eastern<br />
Gas Pipeline (EGP) from<br />
Longford in Victoria to Sydney in<br />
New South Wales was completed<br />
in September 2000. The impact<br />
of commencement of supply by<br />
the EGP on <strong>Santos</strong>’ gas sales in<br />
NSW was as expected.<br />
Competition in the Australian gas<br />
market is expected to rise over<br />
the coming years. <strong>Santos</strong> expects<br />
that the Cooper Basin will remain<br />
a competitive and strong supplier<br />
of gas to south-eastern Australia.<br />
41%<br />
petajoules<br />
South Australia<br />
Queensland & Northern Territory<br />
Offshore Australia<br />
Australian Gas Sales<br />
250<br />
210<br />
195<br />
200<br />
176<br />
150<br />
100<br />
50<br />
0<br />
1998 1999 2000<br />
SANTOS INTEREST IN UNCONTRACTED GAS RESERVES (A) PJ AS AT DEC 2000<br />
Total Gas Reserves <strong>Santos</strong> Share Uncontracted <strong>Santos</strong> Share of<br />
in <strong>Santos</strong> of Gas Gas in <strong>Santos</strong> Uncontracted<br />
Acreage Reserves Acreage Gas<br />
South Australia 2466 1469 1238 730<br />
Minerva 309 31 309 31<br />
Kipper 371 74 371 74<br />
SW Queensland 1894 1125 1133 668<br />
Surat/Bowen 256 160 147 83<br />
Amadeus 496 300 354 215<br />
East Spar 430 193 119 53<br />
Reindeer 256 92 256 92<br />
Bayu/Undan 3609 427 3609 427<br />
Barrow Island/Thevenard Island 110 33 110 33<br />
Sub-total Australian areas 10197 3904 7646 2406<br />
Other areas 272 180 238 146<br />
Total 10469 4084 7884 2552<br />
(A)<br />
Includes ethane
REVIEW OF PERFORMANCE<br />
PRODUCTION<br />
20<br />
Production benefits from<br />
the Development Program<br />
> The Elang/Kakatua oil field reached a milestone<br />
20 million barrels of cumulative production<br />
during 2001.<br />
> The Stag oil field reached a milestone 18 million<br />
barrels of cumulative production during 2000<br />
benefiting from the development program.<br />
KEY FACTS<br />
> Production reached a record<br />
56 million boe.<br />
> Stag oil production averaged<br />
23,000 bopd for the year.<br />
> Elang/Kakatua production<br />
averaged 18,000 bopd for<br />
the year.<br />
> East Spar gas production<br />
rose to 19 PJ for the year.<br />
> Carnarvon Basin acquisition<br />
boosted 2000 oil production<br />
by 3 million boe.<br />
> <strong>Santos</strong> produced a record<br />
215 PJ of gas and ethane.<br />
In 2000 <strong>Santos</strong> produced a<br />
record 56 million boe, up 14%.<br />
The increase in production is<br />
attributable to the benefits of<br />
the ongoing exploration and<br />
development program and<br />
<strong>Santos</strong>’ corporate development<br />
activities. Total production from<br />
the Offshore Australia Business<br />
Unit doubled to 14 million boe<br />
(7 million boe in 1999) while<br />
production from the Queensland/<br />
Northern Territory Business Unit<br />
increased 6% to 19 million boe.<br />
A highlight for the year was oil<br />
and liquids production reaching<br />
a record 19 million boe, boosted<br />
by higher oil production from the<br />
Stag and Elang/Kakatua oil fields<br />
and the Barrow and Thevenard<br />
Islands acquisition. Other<br />
highlights were the significant<br />
contribution from the Stag oil<br />
field where oil production<br />
averaged over 23,000 bopd and<br />
peaked over 30,000 during 2000.<br />
The improved performance and<br />
extension of well life of the Stag<br />
Field can be directly attributed<br />
to the development program<br />
that involved successful water<br />
injection in 1999 and additional<br />
remedial drilling during 2000.<br />
A further example of success<br />
through development is the<br />
Elang/Kakatua Field where<br />
remedial development work that<br />
involved the drilling of a sidetrack<br />
hole, workover and use of 3D<br />
seismic led to improved<br />
production. Elang/Kakatua<br />
performance improved<br />
significantly and averaged<br />
Korinci-Baru<br />
Bentu<br />
0 1000<br />
kilometres<br />
Indonesia<br />
Carnarvon Basin<br />
Indian Ocean<br />
Exploration<br />
Production<br />
Sampang<br />
18,000 bopd during 2000.<br />
The Elang/Kakatua Field<br />
reached a significant milestone<br />
during January 2001 when<br />
cumulative production exceeded<br />
20 million boe.<br />
<strong>Santos</strong> expects 2001 production<br />
to be 2% to 3% above the record<br />
level achieved in 2000. Offshore<br />
Australia is expected to continue<br />
to contribute to <strong>Santos</strong>’<br />
production profile in a significant<br />
way with new projects such as<br />
the Legendre oil field. Significant<br />
investment in development during<br />
2000 will help <strong>Santos</strong> grow its<br />
production profile.<br />
mmboe<br />
Pacific Ocean<br />
Warim<br />
Irian Jaya<br />
Timor Gap<br />
Timor Sea<br />
Darwin<br />
Browse Basin<br />
Bonaparte<br />
Gulf McArthur<br />
River<br />
Perth<br />
Amadeus<br />
Basin<br />
Kalgoorlie<br />
Adelaide<br />
Australia Melbourne<br />
Southern Ocean<br />
Oil pipeline<br />
Gas pipeline<br />
Cooper/<br />
Eromanga<br />
Basins<br />
Otway Basin<br />
60<br />
50<br />
40<br />
30<br />
20<br />
10<br />
0<br />
Production<br />
46<br />
1998<br />
Papua<br />
New Guinea<br />
SE Gobe<br />
Mt Isa<br />
Surat Basin &<br />
Denison Trough<br />
Gladstone<br />
Ethane pipeline<br />
Sydney<br />
Canberra<br />
Gippsland Basin<br />
Bass Basin<br />
Hobart<br />
49<br />
1999 2000<br />
Sales gas & ethane<br />
Crude oil & liquids<br />
Brisbane<br />
56
PRODUCTION<br />
STATISTICS<br />
Field Units<br />
Sales Gas & Ethane Crude Oil Condensate LPG<br />
PJ ’000 bbls ’000 bbls ’000 tonnes<br />
2000 1999 2000 1999 2000 1999 2000 1999<br />
21<br />
South Australia<br />
Cooper/Eromanga 100.0 105.7 1800.4 1860.4 1440.1 1573.9 177.5 198.9<br />
Otway 4.8 1.6 – – 53.2 19.0 – –<br />
Total 104.8 107.3 1800.4 1860.4 1493.3 1592.9 177.5 198.9<br />
Queensland & Northern Territory<br />
SW Queensland 65.7 56.3 1442.4 1705.6 947.8 941.3 85.6 79.5<br />
Surat/Denison 11.2 11.9 107.9 133.8 21.8 35.4 0.1 1.8<br />
Amadeus 10.6 11.3 343.1 399.2 – – – –<br />
Total 87.5 79.5 1893.4 2238.6 969.6 976.7 85.7 81.3<br />
Offshore Australia<br />
Timor Sea – – 333.2 403.6 – – – –<br />
Timor Gap – – 1397.7 1701.5 – – – –<br />
Carnarvon 18.9 10.3 4648.3 2378.7 1079.9 609.3 – –<br />
Thevenard/Barrow 0.1 – 2898.4 – – – – –<br />
Total 19.0 10.3 9277.6 4483.8 1079.9 609.3 – –<br />
South East Asia<br />
Seram – – – – – – – –<br />
PNG – – 425.2 448.5 – – – –<br />
Total – – 425.2 448.5 – – – –<br />
US 3.7 4.9 75.2 92.8 19.3 37.6 – –<br />
Total 215.0 202.0 13471.8 9124.1 3562.1 3216.5 263.2 280.2<br />
Million Barrels of Oil Equivalent<br />
Sales Gas & Ethane Crude Oil Condensate LPG Total<br />
2000 1999 2000 1999 2000 1999 2000 1999 2000 1999<br />
South Australia<br />
Cooper/Eromanga 17.20 18.17 1.80 1.86 1.35 1.47 1.50 1.68 21.85 23.18<br />
Otway 0.83 0.28 – – 0.05 0.02 – – 0.88 0.30<br />
Total 18.03 18.45 1.80 1.86 1.40 1.49 1.50 1.68 22.73 23.48<br />
Queensland & Northern Territory<br />
SW Queensland 11.30 9.68 1.44 1.71 0.89 0.88 0.72 0.67 14.35 12.94<br />
Surat/Denison 1.93 2.05 0.11 0.13 0.02 0.03 – 0.02 2.06 2.23<br />
Amadeus 1.82 1.94 0.34 0.40 – – – – 2.16 2.34<br />
Total 15.05 13.67 1.89 2.24 0.91 0.91 0.72 0.69 18.57 17.51<br />
Offshore Australia<br />
Timor Sea – – 0.33 0.40 – – – – 0.33 0.40<br />
Timor Gap – – 1.40 1.70 – – – – 1.40 1.70<br />
Carnarvon 3.25 1.77 4.65 2.38 1.01 0.57 – – 8.90 4.72<br />
Thevenard/Barrow 0.02 – 2.90 – – – – – 2.90 –<br />
Total 3.27 1.77 9.28 4.48 1.01 0.57 – – 13.53 6.82<br />
South East Asia<br />
PNG – – 0.43 0.45 – – – – 0.43 0.45<br />
Total – – 0.43 0.45 – – – – 0.43 0.45<br />
US 0.64 0.84 0.08 0.09 0.02 0.04 – – 0.74 0.97<br />
Total 36.99 34.73 13.48 9.12 3.34 3.01 2.22 2.37 56.00 49.23
REVIEW OF PERFORMANCE<br />
ENVIRONMENT & SAFETY<br />
22<br />
TRCF (rate)<br />
Safety Performance<br />
20 19<br />
18<br />
16<br />
14<br />
12<br />
10<br />
10<br />
8<br />
8<br />
6<br />
4<br />
2<br />
0<br />
1998 1999 2000<br />
Environment<br />
<strong>Santos</strong> operates in many varied<br />
environmental settings throughout<br />
Australia. The Company has a<br />
long history of conducting its<br />
activities in a way that avoids<br />
and minimises potential impacts<br />
on the environment.<br />
<strong>Santos</strong>’ first environmental<br />
professional was employed<br />
in 1980. Since that time, the<br />
Company has established a core<br />
team of dedicated environmental<br />
advisors as well as incorporating<br />
environment into the line<br />
management function. As<br />
with safety, the environment is<br />
everyone’s responsibility – be they<br />
employee or contractor, operator<br />
or manager.<br />
The Company’s environmental<br />
policy was updated in 1997<br />
and it is used as the basis of a<br />
comprehensive environmental<br />
management system tailor-made<br />
for <strong>Santos</strong>. The Corporate<br />
component of the <strong>Santos</strong><br />
Australian Environmental<br />
Management System<br />
incorporates corporate<br />
requirements which are reflected<br />
in the more detailed Business Unit<br />
sub-systems. This ensures that<br />
the differing, specific regulatory<br />
requirements of the various States<br />
within which <strong>Santos</strong> operates can<br />
be reflected in sufficient detail to<br />
enable easy comprehension and<br />
compliance with State and<br />
Territory requirements.<br />
<strong>Santos</strong> has achieved high<br />
standards of environmental<br />
performance – illustrated by<br />
the many awards it has received.<br />
Relationships with regulatory<br />
bodies are robust and positive<br />
and focussed on an evolving<br />
process of co-regulation.<br />
Emergency contingency plans<br />
have been established for all key<br />
operating areas. These are tested<br />
and updated on a regular basis.<br />
All environmental incidents are<br />
reported and rectified. Issues<br />
identified as causal factors are<br />
incorporated into ongoing risk<br />
management and modified<br />
procedures aimed at preventing<br />
reoccurrence in all similar<br />
circumstances. During 2000<br />
<strong>Santos</strong> was not fined or<br />
prosecuted, nor did it receive any<br />
notices of non-compliance.<br />
This process of continual<br />
improvement underlies the <strong>Santos</strong><br />
Environmental Management<br />
System, which in itself is subject<br />
to constant evolution, amendment<br />
and change – reflecting both<br />
external and in-company changes<br />
over time. The ultimate aim is to<br />
achieve a level of excellence by<br />
constantly bridging the gap<br />
between admirable rhetoric and<br />
the realities of the harsh, remote<br />
natural environmental in which<br />
the majority of <strong>Santos</strong>’ operations<br />
are located.<br />
Safety<br />
<strong>Santos</strong> investigates and reports<br />
all accidents, near misses and<br />
hazards. The measure of safety<br />
performance used is the Total<br />
Recordable Case Frequency rate<br />
(TRCF) which is defined as the<br />
number of Recordable Cases<br />
(Medical Treatment and Lost<br />
Time Injuries) per million hours<br />
worked by <strong>Santos</strong> employees<br />
and contractors.<br />
In 2000, <strong>Santos</strong> recorded a<br />
continued improvement in its<br />
safety performance achieving<br />
a further reduction of 20%,<br />
following an almost 50%<br />
reduction in 1999, in its<br />
TRCF rate.<br />
The Company strives for the<br />
highest standard of occupational<br />
health and safety (OH&S) and<br />
is fully committed to a work<br />
environment free of injuries. While<br />
this has not yet been achieved,<br />
the progress for the past two<br />
years indicates continual<br />
improvement and progress<br />
toward this.<br />
Under <strong>Santos</strong>’ OH&S policy,<br />
all employees and contractors<br />
have specific responsibilities for<br />
observing and maintaining a<br />
safe working environment. Of<br />
particular emphasis for safety<br />
programs has been the intent<br />
that contractor safety<br />
performance should match that<br />
of <strong>Santos</strong>’ employees. Many<br />
contractors now achieve safety<br />
performance matching that of<br />
<strong>Santos</strong> employees.
23<br />
REVIEW OF PERFORMANCE<br />
COMMUNITY<br />
In 2000 <strong>Santos</strong> continued its<br />
program of providing support<br />
to cultural, educational and notfor-profit<br />
organisations within<br />
the communities in which the<br />
Company operates.<br />
The Art Gallery of South<br />
Australia, the Queensland Art<br />
Gallery, the Adelaide, Brisbane,<br />
and Darwin Festivals, the <strong>Santos</strong><br />
School of Petroleum Engineering<br />
and Management, and the Anti-<br />
Cancer Foundation, are among<br />
the many institutions and events<br />
that benefit from this program.<br />
For the past two years <strong>Santos</strong><br />
has been the Principal Sponsor<br />
of the Adelaide Symphony<br />
Orchestra and continues this<br />
in 2001. The orchestra plays<br />
a vital role in the cultural life of<br />
South Australia, performing an<br />
extensive concert program as<br />
well as supporting the<br />
performances of the State<br />
Opera of South Australia<br />
and the Australian Ballet.<br />
One of the highlights of the<br />
orchestra’s season is the<br />
annual <strong>Santos</strong> Symphony under<br />
the Stars, a free public concert<br />
held in Elder Park. This is a<br />
summertime institution in<br />
Adelaide and is attended by<br />
more than 30,000 people.<br />
In 2000 <strong>Santos</strong> supported the<br />
Save the Bilby organisation by<br />
donating a 4WD vehicle to be<br />
used in a feral animal eradication<br />
program. This program will<br />
secure a habitat for the Greater<br />
Bilby in the Currawinya National<br />
Park in south-west Queensland,<br />
ensuring the survival of this<br />
almost extinct Australian icon<br />
for future generations to see<br />
and enjoy.<br />
For many years, <strong>Santos</strong> has<br />
contributed to a number of<br />
events and organisations in the<br />
Whyalla region of South Australia.<br />
This year the Company will assist<br />
the establishment of new<br />
premises for the Air Sea Rescue<br />
Squadron.<br />
<strong>Santos</strong> has commenced a<br />
program of community support in<br />
the Western District of Victoria<br />
including support to the Timboon<br />
and District Healthcare Service<br />
for the purchase of an essential<br />
piece of equipment and to the<br />
Port Campbell Surf Life Saving<br />
Club’s building appeal.
DELIVERING<br />
NEW OPPORTUNITIES<br />
Jon Young General Manager, South Australia Business Unit<br />
The Otway project team proved that there are economic prospects in Victoria<br />
which can be readily developed and marketed in Eastern Australia’s largest<br />
market place.<br />
“The Otway project<br />
was an extreme<br />
challenge for the<br />
small dedicated<br />
team working in a<br />
geographical area<br />
new to <strong>Santos</strong>.”<br />
Graeme Parsons<br />
Senior Staff Geologist,<br />
South Australia Business Unit
“Frontier exploration<br />
in PNG offers<br />
satisfying challenges<br />
both technically<br />
and on the ground”<br />
Jan Hulse<br />
Senior Geologist, South East Asia Business Unit<br />
DELIVERING<br />
FUTURE GROWTH<br />
Bob Hall General Manager, South East Asia Business Unit<br />
Papua New Guinea is a challenging area with great potential that can deliver<br />
significant value to <strong>Santos</strong>.
John Allan Uhrig<br />
AC, BSc, DUniv, Hon. DEcon,<br />
FAIM<br />
John Charles<br />
Ellice-Flint<br />
BSc (Hons)<br />
Stephen Gerlach<br />
LLB<br />
Peter Charles<br />
Barnett<br />
FCPA<br />
John Walter McArdle<br />
FCPA<br />
Age 72. Director since<br />
3 December 1991 and<br />
Chairman since<br />
15 February 1994. Former<br />
Chairman of Westpac<br />
Banking Corporation, of<br />
Rio Tinto Ltd and former<br />
Deputy Chairman of Rio<br />
Tinto plc. Until 1985 was<br />
Managing Director of<br />
Simpson Holdings Ltd.<br />
Age 50. Managing Director<br />
since 19 December 2000,<br />
member of the<br />
Environmental Committee<br />
of the Board and also<br />
Chairman of other<br />
<strong>Santos</strong> Ltd subsidiary<br />
companies. Twenty-six<br />
years experience in the<br />
international oil and gas<br />
industry with Unocal,<br />
including as Senior<br />
Vice President: Global<br />
Exploration and<br />
Technology and Vice<br />
President: Corporate<br />
Planning and Economics.<br />
Age 55. Director since<br />
5 September 1989 and<br />
Deputy Chairman since<br />
20 June 2000. Chairman<br />
of the Environmental<br />
Committee of the Board<br />
and also Chairman of<br />
<strong>Santos</strong> Finance Ltd.<br />
Chairman of Amdel Ltd,<br />
Equatorial Mining Ltd,<br />
Elders Australia Ltd and<br />
Beston Pacific Vineyard<br />
Management Ltd. Director<br />
of Southcorp Holdings Ltd,<br />
Futuris Corporation Ltd,<br />
Challenger Beston Limited<br />
and Elders Rural Services<br />
Ltd. Former Managing<br />
Partner of the Adelaide<br />
legal firm, Finlaysons.<br />
Age 60. Director since<br />
31 October 1995 and<br />
member of the<br />
Environmental Committee<br />
of the Board. Director of<br />
Mayne Nickless Ltd and<br />
AMCIL Ltd. Former<br />
Managing Director and<br />
Chief Executive Officer of<br />
Pasminco Ltd and Chief<br />
Executive Officer of EZ<br />
Industries Ltd.<br />
Age 54. Executive Director<br />
since 5 September 1995<br />
and Executive General<br />
Manager - Commercial of<br />
<strong>Santos</strong> Ltd. Director of<br />
<strong>Santos</strong> Ltd subsidiary<br />
companies. Former<br />
Managing Director of<br />
Delhi Petroleum Pty Ltd<br />
and former Chairman of<br />
Australian National<br />
Railways Commission.<br />
BOARD OF<br />
DIRECTORS
Ian Ernest Webber<br />
AO, BE, ATS, FCIT, FAIM<br />
Michael Anthony<br />
O’Leary<br />
DipMinE, BSc, FAusIMM, FAIM<br />
Professor Judith<br />
Sloan<br />
BA (Hons), MA, MSc<br />
Frank John Conroy<br />
BCom, MBA, FAIM, FAICD,<br />
FAIBF<br />
Graeme William<br />
McGregor<br />
AO, BEc, FCPA, FCA, FAIM,<br />
FAICD<br />
Age 62. Director since<br />
3 September 1999,<br />
Chairman of the Audit<br />
Committee of the Board<br />
and director of <strong>Santos</strong><br />
Finance Ltd. Director of<br />
Foster’s Brewing Group<br />
Ltd, Nufarm Ltd, Were<br />
Securities Ltd and<br />
Community Foundation<br />
Network Ltd. Member of<br />
the Financial Reporting<br />
Council. Former Executive<br />
Director Finance of The<br />
Broken Hill Proprietary<br />
Company Limited.<br />
Age 65. Director since<br />
16 February 1993 and<br />
member of the Audit<br />
Committee of the Board.<br />
Director of Pacific Dunlop<br />
Ltd and WMC Ltd. Former<br />
Managing Director and<br />
Deputy Chairman of<br />
Chrysler Australia Ltd<br />
and Managing Director<br />
of Mitsubishi Motors<br />
Australia Ltd. Former<br />
Chairman of Mayne<br />
Nickless Ltd Group.<br />
Age 65. Director since<br />
15 October 1996 and<br />
member of the<br />
Environmental<br />
Committee of the Board.<br />
Deputy Chairman of Bank<br />
of Western Australia Ltd.<br />
Former Chairman of<br />
Hamersley Iron, Argyle<br />
Diamonds, Dampier Salt<br />
and former Director of<br />
Rio Tinto Ltd and Rio<br />
Tinto plc.<br />
Age 46. Director since<br />
5 September 1994 and<br />
member of the Audit<br />
Committee of the Board.<br />
Chairman of SGIC<br />
Holdings Ltd and Director<br />
of Mayne Nickless Ltd and<br />
a Board member of the<br />
Australian Broadcasting<br />
Corporation. Former<br />
Professor of Labour<br />
Studies at the Flinders<br />
University of South<br />
Australia and Director<br />
of the National Institute<br />
of Labour Studies.<br />
Age 58. Director since<br />
19 October 1999 and<br />
director of <strong>Santos</strong> Finance<br />
Ltd. Chairman of Howard<br />
Smith Ltd, St George<br />
Bank Ltd and ORIX<br />
Australia Corporation<br />
Ltd. Director of Futuris<br />
Corporation Ltd and<br />
Australian Pharmaceutical<br />
Industries Limited. Former<br />
Managing Director of<br />
Westpac Banking<br />
Corporation.<br />
CORPORATE MANAGEMENT<br />
Managing Director<br />
John Ellice-Flint<br />
Executive General<br />
Manager – Commercial<br />
John McArdle<br />
General Manager –<br />
Accounting<br />
Don Priestley<br />
General Manager –<br />
Engineering<br />
Denis Dare<br />
General Manager –<br />
Finance & Investor<br />
Relations<br />
Graeme Bethune<br />
Group General Counsel<br />
& Company Secretary<br />
Michael Roberts<br />
General Manager –<br />
Petroleum Development<br />
& Planning<br />
Ashok Khurana
CORPORATE<br />
GOVERNANCE<br />
28<br />
Corporate Governance<br />
Statement<br />
The purpose of this statement<br />
is to provide details of the main<br />
corporate governance practices<br />
the Company had in place during<br />
the past financial year.<br />
The Board of <strong>Santos</strong> Limited<br />
is committed to good corporate<br />
governance and to this end has<br />
had in place, for a number of<br />
years, formal guidelines recording<br />
the Board’s policy on: Board<br />
composition and appointment of<br />
chairman; Board membership and<br />
attendance; the appointment and<br />
retirement of Directors;<br />
independent professional advice;<br />
compensation arrangements;<br />
external auditors; risk<br />
management; and ethical<br />
standards. References in this<br />
statement to the “Board<br />
guidelines” are to the formal<br />
guidelines in force during the<br />
past financial year. The Board<br />
guidelines are reviewed by the<br />
Board on an annual basis and<br />
as required.<br />
Board of Directors<br />
and its Committees<br />
The Board is responsible for<br />
the overall corporate governance<br />
of the Company including its<br />
strategic direction and financial<br />
objectives, establishing goals for<br />
management and monitoring the<br />
attainment of these goals.<br />
To assist in the effective execution<br />
of its responsibilities, the Board<br />
has established a number of<br />
Board Committees, including a<br />
Nomination and Remuneration<br />
Committee, an Audit Committee<br />
and an Environmental Committee.<br />
The Nomination and Remuneration<br />
Committee comprises all nonexecutive<br />
Directors and each<br />
of the Audit and Environmental<br />
Committees comprises a majority<br />
of non-executive Directors and is<br />
chaired by a non-executive<br />
Director. The Board guidelines<br />
prescribe that the Board is to<br />
meet at least 10 times a year.<br />
All current non-executive<br />
Directors, including the<br />
Chairman, are considered to<br />
be ‘independent’ Directors, as<br />
defined in the 1999 guidelines<br />
of the Australian Investment and<br />
Financial Services Association.<br />
Composition of the Board<br />
The names and details of the<br />
experience, qualifications, age,<br />
special responsibilities and<br />
shareholdings of each Director<br />
of the Company are set out on<br />
pages 26, 27 and 38 of this<br />
Annual Report.<br />
The composition of the Board<br />
is determined in accordance with<br />
the Company’s Constitution and<br />
the Board guidelines including:<br />
the Board is to comprise a<br />
minimum of five and a maximum<br />
of ten Directors (exclusive of the<br />
Managing Director); the Board<br />
should comprise a substantial<br />
majority of non-executive<br />
Directors (currently the Board<br />
comprises eight non-executive<br />
and two executive Directors);<br />
there should be a separation<br />
of the roles of Chairman and<br />
Chief Executive Officer of the<br />
Company; and the Chairman<br />
of the Board should be a nonexecutive<br />
Director.<br />
Under the Board guidelines,<br />
it is the responsibility of the<br />
Nomination and Remuneration<br />
Committee to devise the criteria<br />
for, and review membership of,<br />
and nominations to, the Board.<br />
The primary criteria adopted in<br />
selection of suitable Board<br />
candidates is their capacity to<br />
contribute to the ongoing<br />
development of the Company<br />
having regard to the location<br />
and nature of the Company’s<br />
significant business interests<br />
and to the candidates’ age and<br />
experience by reference to the<br />
age and diversity of experience<br />
of existing Board members.<br />
When a Board vacancy exists<br />
or where it is considered that<br />
the Board would benefit from<br />
the services of a new Director<br />
with particular skills, the<br />
Nomination and Remuneration<br />
Committee has responsibility<br />
for proposing candidates for<br />
consideration by the Board and,<br />
where appropriate, engages the<br />
services of external consultants.<br />
Prior to appointment, each<br />
Director is provided with a<br />
letter of appointment which,<br />
inter alia, encloses a copy<br />
of the Board guidelines. The<br />
expectations of the Board in<br />
respect to a proposed appointee<br />
to the Board and the workings of<br />
the Board and its committees are<br />
conveyed in interviews with the<br />
Chairman and access provided<br />
to appropriate executives in<br />
relation to details of the business<br />
of the Company.<br />
Under the Company’s<br />
Constitution approximately onethird<br />
of Directors retire by rotation<br />
each year and Directors appointed<br />
during the year are required to<br />
submit themselves for election by<br />
shareholders at the Company’s<br />
next Annual General Meeting.<br />
The Board guidelines prescribe<br />
that, under normal circumstances,<br />
Directors should retire at the first<br />
Annual General Meeting after<br />
reaching the age of 72 years<br />
and not seek re-appointment.<br />
Independent Professional<br />
Advice<br />
The Board guidelines set out the<br />
circumstances and procedures<br />
pursuant to which a Director,<br />
in furtherance of his or her<br />
duties, may seek independent<br />
professional advice at the<br />
Company’s expense. Those<br />
procedures require prior<br />
consultation with, and approval<br />
by, the Chairman and assurances<br />
as to the qualifications and<br />
reasonableness of the fees of the<br />
relevant expert and, under normal<br />
circumstances, the provision of<br />
the expert’s advice to the Board.<br />
Remuneration<br />
Under the Board guidelines, the<br />
Nomination and Remuneration<br />
Committee is responsible for<br />
reviewing the remuneration<br />
policies and practices of the<br />
Company including: the<br />
compensation arrangements for<br />
executive Directors and senior<br />
management; the Company’s<br />
superannuation arrangements;<br />
employee share and option plans;<br />
and, within the aggregate amount<br />
approved by shareholders, the<br />
fees for non-executive members<br />
of the Board. Further information<br />
on these matters is included at<br />
pages 39 and 40 of this Annual<br />
Report and details of the<br />
Company’s employee share<br />
and option plans are provided in<br />
Note 18 of the Financial Report.<br />
No non-executive Director may<br />
participate in any of the Company’s<br />
share or option plans. Information<br />
in respect to indemnity and<br />
insurance arrangements for<br />
Directors and senior executives<br />
appears at page 41 of this<br />
Annual Report.<br />
The current members of the<br />
Nomination and Remuneration<br />
Committee, all of whom are<br />
non-executive Directors, are:<br />
Mr J A Uhrig (Chairman),<br />
Mr P C Barnett, Mr F J Conroy,<br />
Mr S Gerlach, Mr G W McGregor,<br />
Mr M A O’Leary, Professor J Sloan<br />
and Mr I E Webber.
29<br />
Audit Committee<br />
The Board guidelines require the<br />
Board to continue in existence an<br />
Audit Committee of the Board.<br />
The role of the Audit Committee<br />
is documented in a Charter<br />
approved by the Board.<br />
The Committee is required to<br />
meet at least three times per<br />
year and members may raise<br />
any matters considered desirable.<br />
The role of the Audit<br />
Committee includes: examining<br />
the accounting policies of the<br />
Company to determine whether<br />
they are appropriate and in<br />
accordance with all applicable<br />
reporting requirements; ensuring<br />
that truth and fairness is reflected<br />
in the preparation and publication<br />
of the Company’s financial reports;<br />
meeting regularly with the auditors<br />
to reinforce the independence of<br />
the auditors, to determine the<br />
appropriateness of internal and<br />
external audit procedures, to<br />
review the performance of the<br />
auditors and to provide the<br />
auditors with confidential access<br />
to the Board; and referring<br />
matters of concern to the Board,<br />
as appropriate, and considering<br />
risk management matters.<br />
Minutes and recommendations<br />
of the Audit Committee are<br />
distributed at the next<br />
Board Meeting.<br />
The current members of the Audit<br />
Committee are: Mr G W McGregor<br />
(Chairman), Professor J Sloan and<br />
Mr I E Webber.<br />
Risk Management<br />
The Board has in place a<br />
number of arrangements<br />
and internal controls intended<br />
to identify and manage areas<br />
of significant business risk.<br />
These include the maintenance<br />
of: Board Committees; detailed<br />
and regular budgetary, financial<br />
and management reporting;<br />
established organisational<br />
structures, procedures,<br />
manuals and policies; audits<br />
(including internal and external<br />
financial, environmental and<br />
safety audits); comprehensive<br />
insurance programmes; and<br />
the retention of specialised<br />
staff and external advisors.<br />
• Management of environmental<br />
risk – environmental risk is<br />
managed through:<br />
comprehensive environmental<br />
management systems;<br />
environmental committees at<br />
Board and management levels;<br />
the retention of specialist<br />
environmental staff and<br />
advisers; regular internal and<br />
external environmental audits;<br />
and imposing environmental<br />
care as a line management<br />
responsibility. The current<br />
members of the Committee are:<br />
Mr S Gerlach (Chairman), Mr P<br />
C Barnett, Mr M A O’Leary and<br />
Mr J C Ellice-Flint.<br />
• Management of exploration risk<br />
– exploration risk is managed<br />
through internal control systems<br />
which include: formalised risk<br />
assessment procedures at the<br />
Business Unit level; Corporate<br />
review in both prospect and<br />
hindsight; Board approval of<br />
exploration budgets; and<br />
regular reporting on progress to<br />
the Board. External reviews are<br />
also undertaken as necessary.<br />
• Investment appraisal – the<br />
Company has clearly<br />
defined procedures for capital<br />
expenditure. These include:<br />
annual budgets; detailed<br />
appraisal and review<br />
procedures; levels of authority;<br />
and due diligence requirements<br />
where assets are being acquired.<br />
• Financial reporting – a<br />
comprehensive budgeting<br />
system exists with a five year<br />
financial plan and an annual<br />
budget approved by the Board.<br />
Monthly actual results are<br />
reported against budget and,<br />
where applicable, revised<br />
forecasts for the year are<br />
prepared and reported to the<br />
Board. Speculative transactions<br />
are prohibited. Further details<br />
relating to financial instruments<br />
and commodity price risk<br />
management are included in<br />
Note 31 of the Financial Report.<br />
• Functional speciality and<br />
business unit reporting – all<br />
significant areas of Company<br />
operations are subject to<br />
regular reporting to the Board.<br />
The Board receives regular<br />
reports on the performance<br />
of each business unit and<br />
on exploration, development,<br />
finance, liquids marketing,<br />
safety, government,<br />
investor relations and<br />
environmental matters.<br />
Senior management attend<br />
Board and Committee meetings,<br />
at which they report to Directors<br />
within their respective areas of<br />
responsibility. This assists the<br />
Board in maintaining its<br />
understanding of the Company’s<br />
business and assessing the<br />
senior management team.<br />
Where appropriate, advisers to<br />
the Company attend meetings of<br />
the Board and of its Committees.<br />
Under the Company’s Delegation<br />
of Authority, the Board is<br />
responsible, inter alia, for the<br />
approval of the annual corporate<br />
budget and for significant:<br />
acquisitions and disposals of<br />
assets; expenditure decisions<br />
outside of the corporate budget;<br />
hedging of product sales; sales<br />
contracts; and financing<br />
arrangements.<br />
Ethical Standards<br />
In pursuance of the promotion<br />
of high standards of corporate<br />
governance, the Board has,<br />
without adopting a formal code<br />
of ethics, established and<br />
maintained various internal<br />
standards which extend beyond<br />
requirements prescribed by law<br />
and include guidelines relating<br />
to the dealing in securities by<br />
Directors and managers.
SANTOS GROUP INTERESTS<br />
AS AT 1 MARCH 2001<br />
Licence Area % Interest Licence Area % Interest<br />
30<br />
South Australia<br />
Cooper Basin (Fixed Factor Area)<br />
(PPLs 6-20, 22-25, 27-61, 63-75, 78-117, 119, 120,<br />
124, 126-130, 132-140, 143-146, 148-151, 153-155,<br />
157, 159-163 & 164-166) 59.8<br />
Patchawarra East Joint Operating Area<br />
(PPLs 26, 76, 77, 118, 121-123, 125,<br />
131, 142, 147, 152, 156, 158 & 167) 69.4<br />
SA Unit and Downstream 59.8<br />
Queensland<br />
South-West Queensland<br />
ATP 259P<br />
Naccowlah (PLs 23-26, 35, 36, 62, 76-79,<br />
82, 87, 105, 107, 109, 133 & 149) 55.5<br />
Total 66 (PLs 34, 37, 63, 68, 75, 84, 88, 110, 129,<br />
130, 134, 140, 142-144 & 150) 70.0<br />
Wareena (PLs 113, 114, 141, 145, 148,153, 157 & 158) 61.2<br />
Innamincka (PLs 58, 80, 136, 137 & 159) 70.0<br />
Alkina 72.0<br />
Aquitaine A (PLs 86, 131 & 146) 52.5<br />
Aquitaine B (PLs 59-61, 81, 83, 85, 97, 106, 108, 111,<br />
112, 132, 135, 139 & 147) 55.0<br />
Aquitaine C (PLs 138 & 154) 47.8<br />
50/40/10 (PL 55) 60.0<br />
SWQ Unit 60.1<br />
ATP 267P (Nockatunga) (PLs 33, 50 & 51) 59.1<br />
ATP 269P (Bodalla) 5.8<br />
PLs 31, 32 and 47 (Bodalla) 5.3<br />
ATP 299P (Tintaburra) (PLs 29, 38, 39, 52, 57, 95 & 170) 89.0<br />
ATP 552P 22.0<br />
ATP 685P (Cockatoo Creek) 100.0<br />
Boxleigh 100.0<br />
PL 1 (Moonie) 100.0<br />
PL 1 (2) (Cabawin) 100.0<br />
PL 1 (2) (Cabawin Farm-out) 50.0<br />
PL 2 (Kooroon) 52.5<br />
PL 2C (Alton) 100.0<br />
PL 2C (Alton Farm-out) 63.5<br />
PL 5 (Barcoo) 85.0<br />
PL 5 (Drillsearch) 21.3<br />
PL 5 (Mascotte) 42.5<br />
PL 11 (Snake Creek East) 25.0<br />
PL 12 (Trinidad) 92.5<br />
PL 17 70.0<br />
PL 17 (Bennett Exclusion) 100.0<br />
PL 17 (Leichardt Exclusion) 70.0<br />
PLs 21, 22, 27 and 64 (Balonne) 12.5<br />
Surat Basin<br />
ATP 212P (Major) (PLs 30, 56 & 74) 15.0<br />
ATP 336P (Kalima) 85.0<br />
ATP 336P (Roma) (PLs 3-13, 93 & PPL2) 85.0<br />
ATP 336P (Waldegrave) (PLs 10-12, 28, 69 & 89) 46.3<br />
ATP 378P (Burunga) (PL 176) 100.0<br />
ATP 470P (Redcap) (PL 71) 10.0<br />
ATP 471P (Bainbilla) (PL 119) 16.7<br />
ATP 471P (Myall) 69.5<br />
ATP 552P (Grail North) 35.5<br />
Denison Trough<br />
ATP 337P (PLs 41-45, 54, 67 and 173) 50.0<br />
ATP 553P 50.0<br />
Facilities<br />
Wungoona Processing Facilities 50.0<br />
Moonie to Brisbane Pipeline 100.0<br />
Jackson Moonie Pipeline 82.8<br />
Ballera to Mt Isa Pipeline 18.0<br />
Victoria<br />
Otway Basin<br />
PEP 153 100.0<br />
PEP 154 90.0<br />
PEP 160 60.0<br />
VIC/RL7 (La Bella) 10.0<br />
VIC/RL8 (Minerva) 10.0<br />
Gippsland Basin<br />
VIC/RL1 (Golden Beach) 66.7<br />
VIC/RL2 (Kipper) 20.0<br />
VIC/RL3 (Sole) 25.0<br />
Tasmania<br />
Bass Basin<br />
T/RL1 (Yolla) 5.0<br />
Northern Territory<br />
Amadeus Basin<br />
OL 3 (Palm Valley) 48.0<br />
OLs 4 and 5 (Mereenie) 65.0<br />
RL2 (Dingo) 65.7<br />
Mereenie-Brewer Estate Pipeline 65.0
Licence Area % Interest Licence Area % Interest<br />
Offshore Northern Australia<br />
Carnarvon Basin<br />
EP 61 28.6<br />
EP 62 28.6<br />
EP 65 35.7<br />
EP 66 35.7<br />
EP 325 25.0<br />
EP 357 35.7<br />
L1H 28.6<br />
L1O 28.6<br />
TL/2 15.0<br />
TL/3 28.6<br />
T/L4 35.7<br />
T/L7 35.7<br />
TP/2 28.6<br />
TP/3 (1 & 2) 35.7<br />
TP/3 (3) 75.0<br />
TP/7 (1-3) 43.7<br />
TP/7 (4) 18.7<br />
TP/13 33.3<br />
TP/14 28.6<br />
WA-1-P 22.6<br />
WA-7-L 28.6<br />
WA-8-L (Talisman) 27.4<br />
WA-13-L (East Spar) 45.0<br />
WA-15-L 54.2<br />
WA-15-L (Lower Area) 36.0<br />
WA-20-L (Legendre) 22.6<br />
WA-24-P (1) 35.7<br />
WA-24-P (2 & 3) 75.0<br />
WA-149-P 18.7<br />
WA-191-P 33.4<br />
WA-208-P 20.0<br />
Papua New Guinea<br />
PDL 1 31.0<br />
PDL 3 15.9<br />
PL 3 3.6<br />
PPL 157 35.3<br />
PPL 189 42.6<br />
PPL 190 31.3<br />
PPL 191 71.8<br />
Indonesia<br />
Bentu 61.1<br />
Korinci-Baru 61.1<br />
United States of America<br />
Average<br />
working interest<br />
Gulf of Mexico<br />
– EC 155 80.0<br />
– EI 59 20.0<br />
– EI 143 20.0<br />
– EI 335 20.0<br />
– VR 247 75.0<br />
– WC 272 80.0<br />
– WC 276 75.0<br />
– WC 582 80.0<br />
– WC 632 50.0<br />
WA-209-P 36.0<br />
WA-214-P 20.0<br />
WA-261-P 29.6<br />
WA-264-P 66.7<br />
WA-298-P 20.0<br />
Browse Basin<br />
WA-206-P 100.0<br />
WA-239-P 10.0<br />
WA-242-P 33.3<br />
WA-281-P 27.5<br />
WA-282-P 42.5<br />
WA-283-P 27.5<br />
Bonaparte Basin<br />
NT/RL1 (Petrel) 95.0<br />
WA-6-R (West Petrel) 95.0<br />
WA-18-P (Tern) 100.0<br />
Timor Sea<br />
AC/L1 (Jabiru) 10.3<br />
AC/L2 (Challis) 10.3<br />
AC/L3 (Cassini) 10.3<br />
AC/L4 (Skua) 37.4<br />
AC/P15 33.3<br />
Timor Gap<br />
ZOCA 91-01 25.0<br />
ZOCA 91-12 21.4<br />
Bayu-Undan Gas Field 11.8<br />
PPL 202 45.0<br />
PPL 206 48.0<br />
PPL 213 35.0<br />
PRL 4 35.3<br />
PRL 5 35.3<br />
SE Gobe Unit 9.4<br />
Sampang 45.0<br />
Warim 20.0<br />
Average<br />
working interest<br />
Arkoma Basin 32.0<br />
South Texas<br />
– Aransas Bay 25.0<br />
– Ashland Deep (Runnells-3) 30.0<br />
– Birdie Porter Green 50.0<br />
– Fuhrken 25.0<br />
– Queen City (Mew-1) 47.0<br />
– Remmers 55.0<br />
– Suemar 25.0<br />
– Driscoll 25.0<br />
– West Rosita 25.0<br />
31
32<br />
GLOSSARY<br />
CRUDE OIL<br />
1 barrel = 1 boe<br />
SALES GAS<br />
1 petajoule = 171.937 boe x10 3<br />
CONDENSATE/NAPHTHA<br />
1 barrel = 0.935 boe<br />
LPG<br />
1 tonne = 8.458 boe<br />
appraisal well<br />
An exploration well drilled for the<br />
purpose of identifying extensions<br />
to known fields or discoveries.<br />
barrel/bbl<br />
The standard unit of<br />
measurement for all production<br />
and sales. One barrel equals<br />
159 litres or 35 imperial gallons.<br />
boe<br />
Barrels of oil equivalent.<br />
The factors used by <strong>Santos</strong><br />
to convert volumes of different<br />
hydrocarbon production to<br />
barrels of oil equivalent are<br />
printed above.<br />
bopd<br />
Barrels of oil per day.<br />
the Company<br />
<strong>Santos</strong> Ltd and its subsidiaries.<br />
development well<br />
A well drilled to enable<br />
production from a known oil or<br />
gas reservoir.<br />
exploration well<br />
A wildcat or appraisal well drilled<br />
to find new reserves of oil or gas.<br />
fracture stimulation<br />
A technique used to improve<br />
hydrocarbon recovery from<br />
reserves with poor permeability<br />
or porosity. Fracture stimulation<br />
involves the fracturing of the<br />
reservoir rock to encourage<br />
the flow of hydrocarbons.<br />
hydrocarbons<br />
Solid, liquid or gas compounds<br />
of the elements hydrogen<br />
and carbon.<br />
LPG<br />
Liquefied petroleum gas.<br />
mbbls<br />
Thousand barrels.<br />
mmbbls<br />
Million barrels.<br />
mmboe<br />
Million barrels of oil equivalent.<br />
OABU<br />
Offshore Australia Business Unit.<br />
petroleum liquids<br />
Crude oil, condensate, or its<br />
derivative naphtha, and the<br />
liquefied petroleum gases<br />
propane and butane.<br />
PJ<br />
Petajoules. Joules are the<br />
metric measurement unit for<br />
energy. A petajoule is equal to<br />
1 kilojoule x 10 12 . The equivalent<br />
imperial measure to joules is<br />
British Thermal Units (BTU).<br />
One kilojoule = .9478 BTU.<br />
PSC<br />
Production sharing contract.<br />
QNTBU<br />
Queensland and Northern<br />
Territory Business Unit.<br />
reserves<br />
Proved and probable reserves as<br />
defined by the Australian Stock<br />
Exchange Ltd (ASX). Proved<br />
reserves are those reserves that,<br />
to a high degree of certainty, are<br />
clearly recoverable, at commercial<br />
rates, under currently anticipated<br />
production methods, operating<br />
conditions, prices and costs.<br />
Probable reserves are those<br />
reserves that may be reasonably<br />
assumed to exist because of<br />
geophysical or geological<br />
indications and drilling done<br />
in regions which contain proved<br />
reserves. Reserves reported are<br />
based on, and accurately reflect,<br />
information compiled by full-time<br />
employees of the Company who<br />
have the requisite qualifications<br />
and experience prescribed by the<br />
ASX Listing Rules.<br />
SABU<br />
South Australia Business Unit.<br />
<strong>Santos</strong><br />
<strong>Santos</strong> Ltd and its subsidiaries.<br />
SEABU<br />
South East Asia Business Unit.<br />
seismic survey<br />
A survey used to gain an<br />
understanding of rock formations<br />
beneath the earth’s surface.<br />
SUSAC<br />
<strong>Santos</strong> USA Corp.<br />
TJ<br />
Terajoules. Joules are the metric<br />
measurement unit for energy. A<br />
terajoule is equal to 1 joule x 10 12 .<br />
TRCF<br />
Total recordable case frequency<br />
rate.<br />
wildcat well<br />
An exploration well drilled to<br />
identify new accumulations of<br />
oil or gas.
DELIVERING<br />
HIGHER EFFICIENCY<br />
Jon Young General Manager, South Australia Business Unit<br />
The 25% cost reduction achieved in the Moomba North Drilling Program<br />
ensures Cooper Basin gas is competitive and creates opportunities<br />
to develop additional gas reserves.<br />
33<br />
“The Moomba North Campaign has given us the<br />
opportunity to optimise our efforts both technically<br />
and operationally. The firm vision of the project<br />
has enabled the team, from office personnel to<br />
rig crews, to focus on building effective teamwork<br />
and achieving greater results”<br />
Sylvie Tran Drilling Engineer, South Australia Business Unit
SANTOS’ AREAS OF OPERATION<br />
34<br />
<strong>Santos</strong>’ Acreage – Bentu/Korinci Baru (Sumatra)<br />
Pekanbaru<br />
Sumatra<br />
Korinci-Baru PSC<br />
Mangan<br />
Baru<br />
Perak-Korinci Trend<br />
Terusan<br />
Bentu Terusan<br />
Seng<br />
Proposed Asamera<br />
Duri pipeline<br />
Bumi<br />
Perak<br />
Korinci/Perak<br />
Pulp & Paper<br />
Mill<br />
<strong>Santos</strong>’ Acreage – Sampang PSC (Java)<br />
Java Sea<br />
Madura Island<br />
Sampang PSC<br />
Surabaya<br />
Anggur<br />
Oyong<br />
Dukuh<br />
Segat<br />
Wunut<br />
Enau<br />
Flamboyan<br />
Madura Strait<br />
Besi<br />
Bentu PSC<br />
0 25<br />
0<br />
50<br />
Java<br />
kilometres<br />
Kilometres<br />
<strong>Santos</strong>’ Exploration and Production Interests – South East Asia<br />
Sumatra<br />
Pacific Ocean<br />
Korinci-Baru<br />
Bentu<br />
Irian Jaya<br />
Indonesia<br />
Warim<br />
Papua New Guinea<br />
SE Gobe<br />
Java<br />
Sampang<br />
0 1000<br />
kilometres<br />
Australia<br />
<strong>Santos</strong>’ Acreage – Papua New Guinea<br />
<strong>Santos</strong>’ Acreage – United States of America<br />
Irian Jaya<br />
Papua New Guinea<br />
Texas<br />
Warim PSC<br />
Kau 2<br />
PPL 202<br />
PPL 213<br />
Tumuli<br />
P’nang<br />
Stanley Juhu<br />
Hides<br />
Elevala<br />
PDL 1<br />
Kutubu<br />
PPL 190<br />
PPL 157<br />
PDL 3<br />
Bosavi<br />
Wasuma<br />
SE Gobe W Anesi<br />
SE Kanau Barikewa<br />
PPL 189<br />
Nordheim/Fuhrken<br />
Mew<br />
Runnells<br />
Houston<br />
Gulf of Mexico<br />
WC272<br />
WC276<br />
PPL 206<br />
0 100<br />
Kumul<br />
Offshore<br />
Facility<br />
Mexico<br />
Mountainside<br />
0 200<br />
kilometres<br />
kilometres
<strong>Santos</strong>’ Acreage – Carnarvon Basin<br />
<strong>Santos</strong>’ Acreage – Bonaparte & Browse Basins<br />
0 100<br />
WA-1-P(1)<br />
WA-191-P(1)<br />
kilometres<br />
WA-8-L<br />
WA-191-P(2)<br />
WA-208-P<br />
WA-20-L<br />
WA-1-P(2)<br />
WA-1-P(3) Reindeer<br />
WA-298-P WA-209-P<br />
WA-214-P<br />
Stag<br />
WA-15-L<br />
WA-261-P<br />
WA-149-P<br />
WA-214-P<br />
TP/13<br />
WA-13-L East Spar<br />
EP 62 (1,2,3)<br />
Barrow Island<br />
TP/14 L 1 H<br />
TP/2 L 10<br />
EP 61 (1,2,3) TP/7 (1)<br />
TP/7 (4) TL/2<br />
WA-24-P(1)<br />
TP/7 (2)<br />
WA-264-P<br />
TP/3(1) TP/7 (3)<br />
Thevenard Island<br />
EP 357 TL/4<br />
TP/3 (2) EP 65<br />
TL/7<br />
EP 325<br />
WA-24-P(2)<br />
Western Australia<br />
WA-24-P(3)<br />
TP/3(3)<br />
Indian Ocean<br />
WA-283-P<br />
WA-206-P<br />
Territory of<br />
Ashmore &<br />
Cartier Islands<br />
WA-242-P<br />
AC/RL2<br />
AC/L1<br />
Jabiru<br />
Challis<br />
AC/L4<br />
Skua<br />
WA-281-P<br />
WA-239-P<br />
WA-282-P<br />
Timor<br />
AC/P15<br />
91-01<br />
Jahal<br />
AC/L2<br />
AC/L3<br />
Kakatua<br />
91-12<br />
Elang<br />
Bayu-Undan<br />
WA-6-R<br />
WA-18-P Tern<br />
Western Australia<br />
Zone of<br />
Co-Operation<br />
Northern<br />
Territory<br />
Petrel<br />
NT/RL1<br />
0 200<br />
kilometres<br />
35<br />
Carnarvon Basin<br />
Timor Sea<br />
Browse Basin<br />
Timor Gap<br />
Bonaparte<br />
Gulf<br />
Amadeus Basin<br />
Darwin<br />
McArthur<br />
River<br />
Alice Springs<br />
Mt Isa<br />
Surat Basin &<br />
Denison Trough<br />
Gladstone<br />
Legend<br />
Exploration<br />
Production<br />
<strong>Santos</strong> acreage<br />
Oil field<br />
Indian Ocean<br />
Cooper/<br />
Eromanga<br />
Basins<br />
Brisbane<br />
Gas field<br />
Prospect<br />
Perth<br />
Kalgoorlie<br />
Adelaide<br />
Melbourne<br />
Sydney<br />
Canberra<br />
Oil pipeline<br />
Gas pipeline<br />
0 1000<br />
kilometres<br />
Southern Ocean<br />
Otway Basin<br />
Gippsland Basin<br />
Bass Basin<br />
Hobart<br />
Ethane pipeline<br />
<strong>Santos</strong>’ Acreage – Cooper Basin<br />
<strong>Santos</strong>’ Acreage – Otway Basin<br />
Queensland<br />
Victoria<br />
PEP 154 (B)<br />
Cobden<br />
South Australia<br />
Warrnambool<br />
PEP 154 (A)<br />
PEP 153<br />
Ballera<br />
Jackson<br />
North Paaratte Gas Facility<br />
PL 4<br />
Timboon<br />
PL 5<br />
Heytesbury Gas Facility<br />
Port Campbell<br />
Moomba<br />
Southern Ocean<br />
VIC/RL8<br />
0 50<br />
kilometres<br />
0 2 5<br />
kilometres
10 YEAR<br />
SUMMARY1991–2000<br />
As at 31 December 1991 1992 1993 1994 1995 1996 1997 1998 1999 2000<br />
36<br />
<strong>Santos</strong> average realised oil price (A$/bbl) 28.00 28.65 27.64 23.64 24.96 27.43 27.42 20.95 27.57 46.54<br />
Profit and Loss ($million)<br />
Sales revenue 655.9 689.8 680.2 640.0 671.6 729.2 778.5 769.4 944.5 1,497.1<br />
Total operating revenue 702.0 741.5 931.6 716.6 740.1 804.0 859.5 1,000.8 995.6 1,555.2<br />
Foreign currency gains/(losses) (11.4) (36.8) (7.3) 66.3 (16.0) 25.0 3.6 2.0 0.3 2.7<br />
Operating profit before abnormal items 223.5 245.1 289.2 295.9 241.0 331.9 322.3 267.3 339.6 725.9<br />
Income tax on operating profit 106.8 104.9 104.8 116.2 101.1 136.0 116.1 91.0 120.4 239.1<br />
Operating profit after tax<br />
before abnormal items 116.7 140.2 184.4 179.7 139.9 195.9 206.2 176.3 219.2 486.8<br />
Abnormal items after tax (224.9) (27.5) 34.9 10.7 (29.3) – – – 89.9 –<br />
Operating profit/(loss) after tax and<br />
abnormal items (108.2) 112.7 219.3 190.4 110.6 195.9 206.2 176.3 309.1 486.8<br />
Outside equity interest<br />
in operating profit/(loss) 2.7 – – – – – – – – –<br />
Profit/(loss) attributable to shareholders (110.9) 112.7 219.3 190.4 110.6 195.9 206.2 176.3 309.1 486.8<br />
Balance Sheet ($million)<br />
Total assets 2,797.6 2,821.8 2,831.2 2,897.2 2,915.5 3,443.4 4,036.2 4,236.1 4,338.7 4,659.8<br />
Net debt 755.0 797.4 711.2 619.9 642.0 938.6 1,114.2 1,280.0 1,301.1 866.6<br />
Total shareholders’ equity 1,215.1 1,231.7 1,380.6 1,532.2 1,519.3 1,586.3 1,919.0 1,939.2 2,056.7 2,310.9<br />
Exploration Expenditure<br />
Wells drilled (number) 80 41 66 63 66 91 112 81 34 42<br />
Expenditure ($million) 79.8 76.7 79.6 91.9 87.9 121.1 190.1 180.7 78.1 100.1<br />
Reserves (mmboe) 623 670 675 663 703 860 1,009 966 941 921<br />
Production (mmboe) 34.2 34.6 36.3 37.2 36.8 39.2 41.1 45.6 49.2 56.0<br />
Other Capital Expenditure ($million)<br />
Field developments 51.9 33.2 40.0 52.2 53.9 105.8 179.7 158.1 116.8 187.1<br />
Buildings, plant and equipment 69.1 75.6 80.6 30.5 40.1 150.3 205.4 165.7 102.5 153.5<br />
Share Information<br />
Share issues<br />
Dividend<br />
Reinvestment<br />
Plan/<br />
Executive<br />
Share Plan<br />
Dividend<br />
Reinvestment<br />
Plan<br />
Dividend<br />
Reinvestment<br />
Plan<br />
Dividend<br />
Reinvestment<br />
Plan/<br />
Executive<br />
Share Plan<br />
– – 1 for 8<br />
rights issue/<br />
Employee<br />
Share Plan<br />
Number of issued shares at year end (million) 473.0 498.6 517.9 539.6 539.6 539.6 607.3 607.8 608.2 610.4<br />
Weighted average number of shares (million) 477.5 495.7 518.8 539.2 553.3 553.4 583.7 605.6 606.1 608.3<br />
Dividends per share<br />
– ordinary (¢) 19.0 21.0 22.0 22.0 23.0 24.0 25.0 25.0 27.0 30.0<br />
– special (¢) – – 5.0 – – – – – – 10.0<br />
Dividends<br />
– ordinary ($million) 88.5 102.7 112.3 117.2 123.6 129.0 151.3 151.4 163.7 182.7<br />
– special ($million) – – 25.8 – – – – – – 61.2<br />
Ratios and Statistics<br />
Earnings per share<br />
– before abnormal items (¢) 23.9 28.3 35.5 33.3 25.3 35.4 35.3 29.1 36.2 80.0<br />
– after abnormal items (¢) (23.2) 22.7 42.3 35.3 20.0 35.4 35.3 29.1 51.0 80.0<br />
Return on total operating revenue (%) 16.6 18.9 24.3 25.1 18.9 24.4 24.0 17.6 22.0 31.3<br />
Return on average shareholders’ equity (%) 9.2 11.7 14.1 12.3 9.2 12.6 11.8 9.1 11.0 22.3<br />
Net debt/equity (%) 62.1 64.7 51.5 40.5 42.3 59.2 58.1 66.0 63.3 37.5<br />
Net interest cover (times) 4.1 5.9 7.0 8.3 5.8 6.2 5.4 4.4 5.2 9.1<br />
General<br />
Number of employees 1,570 1,468 1,526 1,492 1,471 1,461 1,615 1,650 1,645 1,631<br />
Number of shareholders 29,706 35,492 42,068 50,595 55,684 55,482 65,459 81,286 81,416 76,457<br />
Market capitalisation ($million) 1,399.2 1,288.5 1,988.1 1,868.2 2,111.2 2,741.1 3,826.1 2,653.9 2,516.1 3,669.8<br />
Prior year amounts have, where applicable, been adjusted to place them on a comparable basis with current year amounts.<br />
Employee<br />
Share Plan<br />
Employee<br />
Share Plan/<br />
Executive<br />
Share Plan<br />
Employee<br />
Share Plan/<br />
Executive<br />
Share Plan/<br />
Restricted<br />
Shares/<br />
Exercise<br />
of Options