Investigation of Cross-Phase Modulation in WDM Systems with AM ...
Investigation of Cross-Phase Modulation in WDM Systems with AM ...
Investigation of Cross-Phase Modulation in WDM Systems with AM ...
You also want an ePaper? Increase the reach of your titles
YUMPU automatically turns print PDFs into web optimized ePapers that Google loves.
(a)<br />
Normalised Standard Deviation (%)<br />
25<br />
20<br />
15<br />
10<br />
5<br />
0<br />
1.7 0.9 0.6 0.5 0.4 0.32 Dl (nm)<br />
NRZ Duob<strong>in</strong>ary PSBT Dicode<br />
(b)<br />
Normalised Standard Deviation (%)<br />
4<br />
3<br />
2<br />
1<br />
0<br />
1.7 0.9 0.6 0.5 0.4 0.32 Dl (nm)<br />
NRZ Duob<strong>in</strong>ary PSBT Dicode<br />
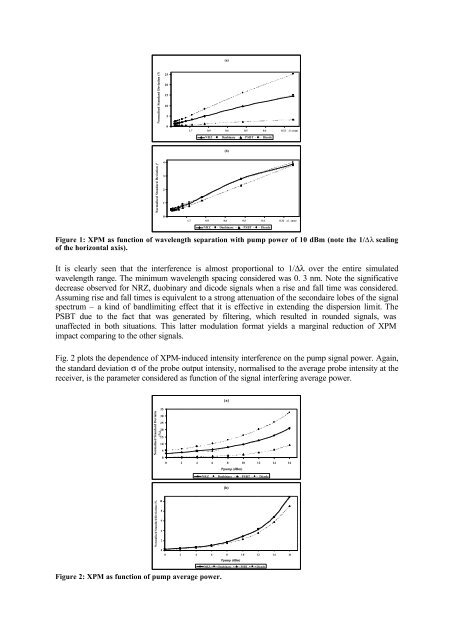
Figure 1: XPM as function <strong>of</strong> wavelength separation <strong>with</strong> pump power <strong>of</strong> 10 dBm (note the 1/Dl scal<strong>in</strong>g<br />
<strong>of</strong> the horizontal axis).<br />
It is clearly seen that the <strong>in</strong>terference is almost proportional to 1/∆λ over the entire simulated<br />
wavelength range. The m<strong>in</strong>imum wavelength spac<strong>in</strong>g considered was 0. 3 nm. Note the significative<br />
decrease observed for NRZ, duob<strong>in</strong>ary and dicode signals when a rise and fall time was considered.<br />
Assum<strong>in</strong>g rise and fall times is equivalent to a strong attenuation <strong>of</strong> the secondaire lobes <strong>of</strong> the signal<br />
spectrum – a k<strong>in</strong>d <strong>of</strong> bandlimit<strong>in</strong>g effect that it is effective <strong>in</strong> extend<strong>in</strong>g the dispersion limit. The<br />
PSBT due to the fact that was generated by filter<strong>in</strong>g, which resulted <strong>in</strong> rounded signals, was<br />
unaffected <strong>in</strong> both situations. This latter modulation format yields a marg<strong>in</strong>al reduction <strong>of</strong> XPM<br />
impact compar<strong>in</strong>g to the other signals.<br />
Fig. 2 plots the dependence <strong>of</strong> XPM-<strong>in</strong>duced <strong>in</strong>tensity <strong>in</strong>terference on the pump signal power. Aga<strong>in</strong>,<br />
the standard deviation σ <strong>of</strong> the probe output <strong>in</strong>tensity, normalised to the average probe <strong>in</strong>tensity at the<br />
receiver, is the parameter considered as function <strong>of</strong> the signal <strong>in</strong>terfer<strong>in</strong>g average power.<br />
Normalised Standard Deviation<br />
(%)<br />
35<br />
30<br />
25<br />
20<br />
15<br />
10<br />
5<br />
0<br />
(a)<br />
0 2 4 6 8 10 12 14 16<br />
Ppump (dBm)<br />
NRZ Duob<strong>in</strong>ary PSBT Dicode<br />
(b)<br />
Normalised Standard Deviation (%)<br />
10<br />
8<br />
6<br />
4<br />
2<br />
0<br />
0 2 4 6 8 10 12 14 16<br />
Ppump (dBm)<br />
Figure 2: XPM as function <strong>of</strong> pump average power.<br />
NRZ Duob<strong>in</strong>ary PSBT Dicode


