Integrating ecosystem-service tradeoffs into land-use decisions
Integrating ecosystem-service tradeoffs into land-use decisions
Integrating ecosystem-service tradeoffs into land-use decisions

You also want an ePaper? Increase the reach of your titles
YUMPU automatically turns print PDFs into web optimized ePapers that Google loves.
<strong>Integrating</strong> <strong>ecosystem</strong>-<strong>service</strong> <strong>tradeoffs</strong> <strong>into</strong><br />
<strong>land</strong>-<strong>use</strong> <strong>decisions</strong><br />
Joshua H. Goldstein a,1 , Giorgio Caldarone b , Thomas Kaeo Duarte b , Driss Ennaanay c,d , Neil Hannahs b ,<br />
Guillermo Mendoza e , Stephen Polasky f,g , Stacie Wolny c,d , and Gretchen C. Daily c,d,1<br />
a Department of Human Dimensions of Natural Resources, Colorado State University, Fort Collins, CO 80523; b Land Assets Division, Kamehameha Schools,<br />
Honolulu, HI 96813; c Department of Biology and d Woods Institute for the Environment, Stanford University, Stanford, CA 94305; e Institute for Water<br />
Resources, US Army Corps of Engineers, Alexandria, VA 22315; and Departments of f Applied Economics and g Ecology, Evolution, and Behavior, University of<br />
Minnesota, St. Paul, MN 55108<br />
Contributed by Gretchen C. Daily, February 17, 2012 (sent for review September 15, 2011)<br />
Recent high-profile efforts have called for integrating <strong>ecosystem</strong><strong>service</strong><br />
values <strong>into</strong> important societal <strong>decisions</strong>, but there are few<br />
demonstrations of this approach in practice. We quantified <strong>ecosystem</strong>-<strong>service</strong><br />
values to help the largest private <strong>land</strong>owner in Hawaii,<br />
Kamehameha Schools, design a <strong>land</strong>-<strong>use</strong> development plan that<br />
balances multiple private and public values on its North Shore <strong>land</strong><br />
holdings (Is<strong>land</strong> of O’ahu) of ∼10,600 ha. We <strong>use</strong>d the InVEST software<br />
tool to evaluate the environmental and financial implications<br />
of seven planning scenarios encompassing contrasting <strong>land</strong>-<strong>use</strong><br />
combinations including biofuel feedstocks, food crops, forestry,<br />
livestock, and residential development. All scenarios had positive<br />
financial return relative to the status quo of negative return. However,<br />
<strong>tradeoffs</strong> existed between carbon storage and water quality<br />
as well as between environmental improvement and financial<br />
return. Based on this analysis and community input, Kamehameha<br />
Schools is implementing a plan to support diversified agriculture<br />
and forestry. This plan generates a positive financial return ($10.9<br />
million) and improved carbon storage (0.5% increase relative to<br />
status quo) with negative relative effects on water quality (15.4%<br />
increase in potential nitrogen export relative to status quo). The<br />
effects on water quality could be mitigated partially (reduced to<br />
a 4.9% increase in potential nitrogen export) by establishing vegetation<br />
buffers on agricultural fields. This plan contributes to policy<br />
goals for climate change mitigation, food security, and diversifying<br />
rural economic opportunities. More broadly, our approach illustrates<br />
how information can help guide local <strong>land</strong>-<strong>use</strong> <strong>decisions</strong> that<br />
involve <strong>tradeoffs</strong> between private and public interests.<br />
conservation | mapping | private <strong>land</strong>s<br />
Recent high-profile studies (1–4) have emphasized the importance<br />
of <strong>ecosystem</strong>s in providing valuable <strong>service</strong>s to humanity,<br />
and recent events have provided strong evidence of the value<br />
of flood-risk mitigation (5, 6), coastal protection (7, 8), and pollination<br />
(9). Global changes in <strong>land</strong> <strong>use</strong> and climate also have<br />
highlighted the role of <strong>ecosystem</strong>s in food, water, and energy security<br />
and in climate change mitigation and adaption (10–13). New<br />
policy and finance mechanisms are being deployed worldwide to<br />
protect the natural capital embodied in Earth’s <strong>land</strong>s, waters,<br />
and biodiversity (14). China, for instance, has pursued multiple<br />
national policies on payments for <strong>ecosystem</strong> <strong>service</strong>s aiming to<br />
harmonize human development goals with watershed protection,<br />
carbon sequestration, biodiversity conservation, and other environmental<br />
objectives, with planned investment on the order of<br />
$100 billion (15).<br />
However, current efforts to protect natural capital that provides<br />
valuable <strong>ecosystem</strong> <strong>service</strong>s are in their infancy. The urgent challenge<br />
is to move from ideas to action to change societal decision<br />
making (16, 17). A necessary step forward to mainstream <strong>ecosystem</strong><br />
<strong>service</strong>s is the ability to factor multiple <strong>ecosystem</strong> <strong>service</strong>s <strong>into</strong><br />
local and regional <strong>land</strong>-<strong>use</strong> planning (18, 19). We conducted an<br />
<strong>ecosystem</strong>-<strong>service</strong>s analysis of <strong>land</strong>-<strong>use</strong> planning in Hawaii that<br />
informed actual <strong>decisions</strong> by the state’s largest private <strong>land</strong>owner,<br />
the educational trust Kamehameha Schools (owning ∼147,710 ha<br />
or ∼8% of the total <strong>land</strong> base). Hawaii is a microcosm of the forces<br />
at play globally that are intensifying pressure on <strong>land</strong> for competing<br />
<strong>use</strong>s. In response, recent policy initiatives in Hawaii have<br />
foc<strong>use</strong>d attention on <strong>ecosystem</strong> <strong>service</strong>s, mitigation of and adaptation<br />
to climate change, and food and energy security (e.g., Ho<strong>use</strong><br />
Concurrent Resolution 200 Ho<strong>use</strong> Draft 1, Regular Session of<br />
2006; Ho<strong>use</strong> Bill 226, Regular Session of 2007; Hawaii Clean<br />
Energy Initiative).<br />
Our analysis quantified <strong>ecosystem</strong> <strong>service</strong> and economic implications<br />
of alternative futures for Kamehameha Schools’ <strong>land</strong><br />
holdings on the North Shore of O`ahu (Fig. 1). From 2006 to 2008,<br />
Kamehameha Schools undertook an extensive <strong>land</strong>-<strong>use</strong> planning<br />
process with the local community. During that process, we <strong>use</strong>d<br />
a spatially explicit modeling tool, Integrated Valuation of Ecosystem<br />
Services and Tradeoffs (InVEST) (20, 21) to address a pair<br />
of linked planning questions: (i) What is the best <strong>use</strong> of the largely<br />
abandoned agricultural <strong>land</strong>s to meet the needs of the local<br />
community and those of the broader public (related particularly to<br />
policy initiatives for climate, food, and energy security) while also<br />
generating positive financial return for Kamehameha Schools?<br />
(ii) Do alternative <strong>land</strong> <strong>use</strong>s result in win-win outcomes or<br />
<strong>tradeoffs</strong> for <strong>ecosystem</strong> <strong>service</strong>s and financial return relative to<br />
a business-as-usual scenario? These questions are relevant far<br />
beyond Hawaii to the many regions globally that are undergoing<br />
extensive <strong>land</strong>-<strong>use</strong> change precipitated by shifting economic and<br />
political forces (22).<br />
Kamehameha Schools’ <strong>land</strong>s in the North Shore region<br />
(∼10,600 ha) have an historical legacy of <strong>use</strong> for agriculture,<br />
aquaculture, and human habitation. Until recently, about 2,200 ha<br />
of arable <strong>land</strong> had been in continuous sugarcane production for<br />
more than 100 y. This situation ended in 1996 when the Waialua<br />
Sugar Company surrendered its lease and ceased production. Since<br />
then, agricultural production has been restored on only one-third<br />
of the former plantation <strong>land</strong>s. The remainder is no longer in <strong>use</strong><br />
and is largely being overtaken by invasive plants (e.g., Megathyrsus<br />
maximus, Falcataria moluccana, andLeucaena leucocephala).<br />
Beginning in 2000, Kamehameha Schools adopted a new strategic<br />
planning framework that seeks to balance economic, environmental,<br />
educational, cultural, and community returns rather<br />
than focusing strictly on economic return (23). As a strategic test<br />
of its new planning approach, Kamehameha Schools faced a critical<br />
decision about what to do with its <strong>land</strong>s in the North Shore<br />
Author contributions: J.H.G., G.C., T.K.D., D.E., N.H., G.M., S.P., S.W., and G.C.D. designed<br />
research; J.H.G., G.C., T.K.D., D.E., N.H., G.M., S.W., and G.C.D. performed research; J.H.G.,<br />
G.C., T.K.D., D.E., N.H., G.M., S.W., and G.C.D. analyzed data; and J.H.G., G.C., T.K.D., D.E.,<br />
N.H., G.M., S.P., S.W., and G.C.D. wrote the paper.<br />
The authors declare no conflict of interest.<br />
1 To whom correspondence may be addressed. E-mail: joshua.goldstein@colostate.edu or<br />
gdaily@stanford.edu.<br />
This article contains supporting information online at www.pnas.org/lookup/suppl/doi:10.<br />
1073/pnas.1201040109/-/DCSupplemental.<br />
SUSTAINABILITY<br />
SCIENCE<br />
www.pnas.org/cgi/doi/10.1073/pnas.1201040109 PNAS Early Edition | 1of6
Is<strong>land</strong> of O’ahu<br />
Base<br />
Landscape<br />
Decision<br />
Alternatives<br />
No Irrigation<br />
Improvements<br />
Improve<br />
Irrigation<br />
System<br />
Sell Land<br />
No Field Buffers<br />
Food Crops & Forestry<br />
Future Scenarios<br />
Status Quo Pasture<br />
With Field Buffers<br />
Residential<br />
Development<br />
Biofuels (Sugarcane)<br />
No Field Buffers With Field Buffers<br />
LULC Type<br />
Undefined<br />
Native Shrub<strong>land</strong> / Sparse Ohia<br />
Uhule Shrub<strong>land</strong><br />
Closed Ohia Forest<br />
Open Koa-Ohia Forest<br />
Open Ohia Forest<br />
Water<br />
Wet<strong>land</strong> Vegetation<br />
Agriculture<br />
Alien Shrubs and Grasses<br />
Alien Trees and Shrubs<br />
High Intensity Developed<br />
Low Intensity Developed<br />
Alien Grass<strong>land</strong><br />
Alien Shrub<strong>land</strong><br />
Christmas Berry Shrub<strong>land</strong><br />
Koa Haole Shrub<strong>land</strong><br />
Alien Forest<br />
Closed Kukui Forest<br />
Kiawa Forest and Shrub<strong>land</strong><br />
Kiawe-Koa Haole Forest and Shrub<strong>land</strong><br />
Uncharacterized Forest<br />
Uncharacterized Shrub<strong>land</strong><br />
Very Sparse Vegetation to Unvegetated<br />
Pasture<br />
Vegetable Crops<br />
Native Forestry<br />
Sugarcane (Irrigated)<br />
Sugarcane (Unirrigated)<br />
Field Buffers<br />
Residential Development<br />
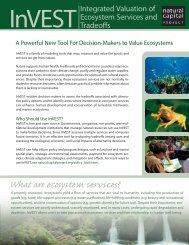
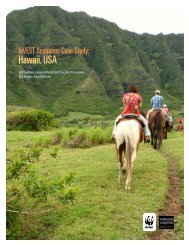
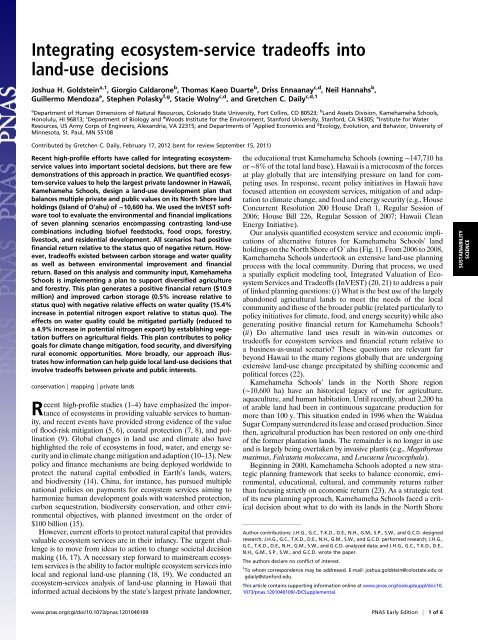
Fig. 1. Study region on the North Shore of O`ahu, Hawaii. The area depicted includes all of Kamehameha Schools’ <strong>land</strong> holdings as well as small interior<br />
parcels that make for a continuous region. The base map shows LULC from the Hawaii Gap Analysis Program published in 2006. Seven <strong>land</strong>-<strong>use</strong> planning<br />
scenarios are shown in the context of the three decision alternatives considered in the analysis. LULC types above the dashed line were from the Hawaii Gap<br />
Analysis Program classification, and LULC types below the dashed line were created for planning scenarios.<br />
region. Specifically, Kamehameha Schools needed to decide<br />
whether to invest an estimated $7.0 million to improve the region’s<br />
aging irrigation system to sustain and enhance agricultural production<br />
or to pursue other options instead. In this context,<br />
Kamehameha Schools had three overarching decision alternatives<br />
for which we developed a total of seven <strong>land</strong>-<strong>use</strong> planning scenarios<br />
(Fig. 1, Figs. S1 and S2, and Table S1). Choices that involved<br />
no improvements to the irrigation system were scenario 1,<br />
Status Quo (maintaining current <strong>land</strong> <strong>use</strong>s <strong>into</strong> the future) and<br />
scenario 2, Pasture (converting all fields to cattle-grazing pasture).<br />
Choices that involved improvements to the irrigation system were<br />
scenarios 3, Food Crops and Forestry (using the lower irrigated<br />
fields for diversified food crops with forestry plantings on the<br />
upper fields); 4, Biofuels (returning the agricultural <strong>land</strong>s to sugarcane<br />
to produce an energy feedstock); 5, Food Crops and Forestry<br />
with Field Buffers; and 6, Biofuels with Field Buffers; in<br />
scenarios 5 and 6, vegetation buffers would be added on fields<br />
adjacent to streams in scenarios 3 and 4 to reduce nutrient and<br />
sediment runoff. The third choice was to sell <strong>land</strong>; in scenario 7,<br />
Residential Development, the agricultural <strong>land</strong>s would be sold for<br />
a housing development. Although neither Kamehameha Schools<br />
nor the community was disposed to pursue this last option, it<br />
represents a development pattern that has occurred repeatedly on<br />
former agricultural <strong>land</strong>s across the state.<br />
We evaluated each scenario based upon three metrics with<br />
contrasting primary beneficiary groups spanning multiple scales:<br />
(i) carbon storage (a global benefit related to climate change<br />
mitigation), calculated as the carbon fraction in above- and belowground<br />
biomass (Table S2); (ii) water-quality improvement (affecting<br />
communities living in the study region), foc<strong>use</strong>d on the<br />
relative export of total dissolved nitrogen as our proxy for pollution,<br />
given the proximity of the agricultural <strong>land</strong>s to the ocean and<br />
nitrogen generally being considered a limiting nutrient in marine<br />
systems (Table S3) (24, 25); and (iii) financial return (to support<br />
mission-related activities for the private <strong>land</strong>owner, Kamehameha<br />
Schools), calculated using projected real property taxes, agricultural<br />
<strong>land</strong> rental rates, and real estate prices for bulk sale of irrigated<br />
and nonirrigated agricultural <strong>land</strong>s. Net present value<br />
calculations <strong>use</strong>d a 6% real discount rate (a financial value <strong>use</strong>d to<br />
convert future values <strong>into</strong> present values), with sensitivity analysis<br />
from 3 to 12% (Table S4). We present results showing net <strong>ecosystem</strong><br />
<strong>service</strong> and financial changes over a 50-y time horizon.<br />
Results and Discussion<br />
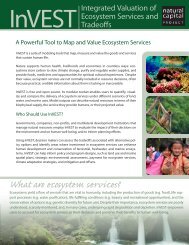
We quantified our three metrics for the current <strong>land</strong>scape to<br />
provide a reference point from which to measure future scenario<br />
changes (Fig. 2). The greatest carbon stocks currently are found in<br />
the upper-elevation forested region with substantially lower stocks<br />
in the agricultural and developed regions. Agricultural fields are<br />
the predominant source of nitrogen, with developed areas below<br />
the fields also of concern. Financially, less than one-third of the<br />
agricultural area currently is being rented and generating income<br />
for Kamehameha Schools, but property taxes are levied on all<br />
fields. As such, a financial loss estimated at $530,000 per year<br />
currently is being incurred by Kamehameha Schools. Indeed, reversing<br />
this loss was a motivating factor to explore new <strong>land</strong><strong>use</strong><br />
strategies.<br />
We projected all <strong>land</strong>-<strong>use</strong> planning scenarios considered in the<br />
analysis to generate positive net present values and to exceed<br />
greatly the negative return of −$8.9 million projected for the Status<br />
Quo scenario (Figs. 3 and 4 and Fig. S3). The Residential Development<br />
scenario generated the highest net present value of $62.4<br />
million. The Food Crops and Forestry scenario generated a net<br />
present value of $10.9 million, and the Biofuels scenario generated<br />
a net present value of $10.3 million, both after accounting for the<br />
cost of improving the irrigation system. Net present value rankings<br />
are robust across changes in the discount rate (Fig. S3).<br />
2of6 | www.pnas.org/cgi/doi/10.1073/pnas.1201040109 Goldstein et al.
A B C<br />
Water quality improvement<br />
Relative score of annual reduction in<br />
nitrogen discharge per hectare<br />
0.2 - 13.98<br />
13.99 - 27.76<br />
27.77 - 41.54<br />
41.55 - 55.32<br />
55.33 - 69.1<br />
69.11 - 82.88<br />
82.89 - 96.66<br />
96.67 - 110.4<br />
110.5 - 124.2<br />
124.3 - 138<br />
Carbon Storage<br />
mtC/ha<br />
0 - 24.9<br />
25 - 49.9<br />
50 - 74.9<br />
75 - 99.9<br />
100 - 124.9<br />
125 - 134<br />
Financial return from<br />
agricultural fields<br />
$/ha<br />
-529 - -450<br />
-449.9 - -300<br />
-299.9 - -150<br />
-149.9 - -0.1<br />
not applicable<br />
0.0 - 149.9<br />
150 - 299.9<br />
300 - 449.9<br />
450 - 537<br />
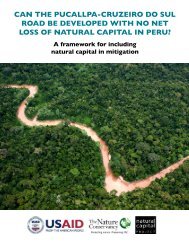
Fig. 2. Maps of study region showing provision for the base <strong>land</strong>scape of<br />
(A) water-quality improvement (nitrogen export reduction), (B) carbon<br />
storage (in above- and belowground pools), and (C) annual financial return<br />
from the agricultural fields.<br />
Stakeholders identified tensions between pursuing a strict financial<br />
profit-maximizing strategy and nonfinancial cultural values.<br />
Although profits from the <strong>land</strong> sale would flow <strong>into</strong> Kamehameha<br />
Schools’ endowment to support its educational mission, selling and<br />
developing these <strong>land</strong>s (e.g., Residential Development) could raise<br />
concerns about potentially irreversible losses of on-site educational<br />
and cultural assets, affecting current and future trust beneficiaries.<br />
Although we were not able to capture such intergenerational<br />
<strong>tradeoffs</strong> explicitly in our analysis, they are an additional consideration<br />
informing <strong>land</strong>-<strong>use</strong> <strong>decisions</strong> by Kamehameha Schools.<br />
For water quality and carbon storage, no scenarios presented<br />
lose-lose or win-win outcomes relative to the Status Quo scenario<br />
(Figs. 3 and 4C). Water quality declined with Food Crops and<br />
Forestry (15.4% increase in nitrogen export), Food Crops and<br />
Forestry with Field Buffers (4.9%), and Residential Development<br />
(11.8%). For these scenarios, however, carbon storage increased<br />
by 0.5% [3,458 tons Carbon (tC)], 1.6% (12,670 tC), and 0.4%<br />
(2,881 tC), respectively. The pattern was reversed for the<br />
remaining three scenarios. Water quality improved with Pasture<br />
(23.4% reduction in nitrogen export), Biofuels (29.2%), and<br />
Biofuels with Field Buffers (32.4%). For these scenarios, however,<br />
carbon storage declined by 9.9% (82,581 tC), 9.9% (82,581 tC),<br />
and 8.0% (66,556 tC), respectively. These reductions in carbon<br />
storage are driven by the need to clear invasive woody plants to<br />
establish pasture or sugarcane cropping on currently abandoned<br />
fields. For the two biofuels scenarios, on-site carbon reductions<br />
could be repaid off site by using sugarcane ethanol to offset more<br />
carbon-intensive energy sources. Following the biofuel carbon<br />
debt methodology of Fargione et al. (26), the estimated payback<br />
period to return to baseline conditions is ∼10 y for the Biofuels<br />
scenario and 8 y for the Biofuels with Field Buffers scenario.<br />
Creating vegetation buffers to reduce runoff is a well-established<br />
agricultural best-management practice (27). In this analysis,<br />
vegetation buffers could provide a double benefit in terms of<br />
modest increases in carbon storage [relative enhancements of<br />
1.1% (9,212 tC) and 1.9% (16,025 tC) for the Food Crops and<br />
Forestry with Field Buffers and Biofuels with Field Buffers scenarios,<br />
respectively, compared with the same scenarios without<br />
field buffers] and improved water quality (relative enhancements<br />
SUSTAINABILITY<br />
SCIENCE<br />
Decision<br />
alternatives:<br />
Scenario:<br />
Change from “status quo” scenario<br />
Water quality improvement<br />
(ntirogen export reduction)<br />
Relative score<br />
Carbon storage<br />
mtC/ha<br />
Financial return from<br />
agricultural fields<br />
$/ha<br />
No Improvement<br />
Pasture<br />
Food Crops<br />
& Forestry<br />
$0.1 M $10.9 M<br />
Improve Irrigation System<br />
Food Crops &<br />
Forestry with<br />
Field Buffers<br />
Biofuels<br />
Biofuels with<br />
Field Buffers<br />
Sell Land<br />
Residential<br />
Development<br />
+23.4% -15.4% -4.9% +29.2% +32.4%<br />
-11.8%<br />
-9.9% +0.5% +1.6% -9.9% -8.0%<br />
0.4%<br />
$9.0 M $10.3 M $8.2 M<br />
$62.4 M<br />
Magnitude<br />
of change<br />
-125 - -100<br />
-99.9 - -75<br />
-74.9 - -50<br />
-49.9 - -25<br />
-24.9 - -0.1<br />
0<br />
0.1 - 25<br />
25.1 - 50<br />
50.1 - 75<br />
75.1 - 90<br />
-113 - -90<br />
-89.9 - -60<br />
-59.9 - -30<br />
-29.9 - -0.1<br />
0<br />
0.1 - 29.9<br />
30 - 59.9<br />
60 - 89.9<br />
90 - 119.9<br />
120 - 134<br />
-15138 - -12000<br />
-11999.9 - -8000<br />
-7999.9 - -4000<br />
-3999.9 - -0.1<br />
0<br />
0.1 - 4000<br />
4000.1 - 8000<br />
8000.1 - 12000<br />
12000.1 - 16000<br />
16000.1 - 20000<br />
20000.1 - 45220<br />
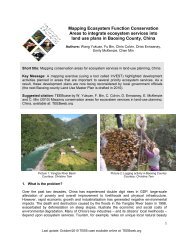
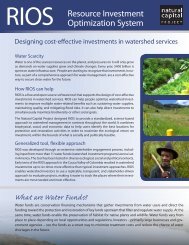
Fig. 3. Maps showing field-level changes between the <strong>land</strong>-<strong>use</strong> planning scenarios and the base <strong>land</strong>scape for water-quality improvement (nitrogen export<br />
reduction), carbon storage, and financial return from the agricultural fields. Blue indicates areas with enhanced <strong>ecosystem</strong> <strong>service</strong>s and financial return; red<br />
indicates areas with reductions; gray indicates no change. The number associated with each map shows the net scenario change. The cost of improving the<br />
irrigation system is not factored <strong>into</strong> relevant scenarios at the field-level for display on the financial return maps, although it is factored <strong>into</strong> the overall net<br />
return numbers reported in the text.<br />
Goldstein et al. PNAS Early Edition | 3of6
A<br />
Percent change in water quality<br />
improvement score relative to<br />
“status quo” scenario<br />
B<br />
Percent change in<br />
carbon storage relative<br />
to “status quo” scenario<br />
C<br />
Percent change in<br />
carbon storage relative<br />
to “status quo” scenario<br />
40<br />
30<br />
20<br />
10<br />
0<br />
2<br />
0<br />
-2<br />
-4<br />
-6<br />
-8<br />
Pasture Biofuels<br />
-10<br />
-10 0 10 20 30 40 50 60 70<br />
Net present value ($M)<br />
2<br />
0<br />
-2<br />
-4<br />
-6<br />
-8<br />
Status<br />
Quo<br />
Pasture<br />
Biofuels (Buffers)<br />
Biofuels<br />
Food Crops &<br />
Forestry (Buffers)<br />
Residential<br />
-10<br />
Development<br />
Food Crops<br />
& Forestry<br />
-20<br />
-10 0 10 20 30 40 50 60 70<br />
Net present value ($M)<br />
Status<br />
Quo<br />
Food Crops<br />
& Forestry<br />
Residential<br />
Development<br />
Food Crops & Forestry (Buffers)<br />
Food Crops & Forestry<br />
Biofuels (Buffers)<br />
Food Crops & Forestry (Buffers)<br />
Status Quo<br />
Residential<br />
Development<br />
Biofuels (Buffers)<br />
-10<br />
Pasture Biofuels<br />
-20 -10 0 10 20 30 40<br />
Percent change in water quality improvement score<br />
relative to “status quo” scenario<br />
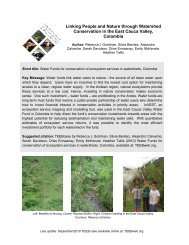
Fig. 4. Tradeoffs comparison of the enhancement or reduction in <strong>ecosystem</strong>-<strong>service</strong><br />
and financial metrics relative to the Status Quo scenario for the<br />
entire planning region. (A) Water-quality improvement and financial return.<br />
(B) Carbon storage and financial return. (C) Carbon storage and waterquality<br />
improvement.<br />
of 10.5% and 3.2% for Food Crops and Forestry with Field Buffers<br />
and Biofuels with Field Buffers, respectively). These <strong>ecosystem</strong><strong>service</strong><br />
improvements, however, come with a tradeoff of <strong>land</strong><br />
taken out of agricultural production, resulting in reduced financial<br />
return (reductions of $1.9 million for both Food Crops and Forestry<br />
with Field Buffers and Biofuels with Field Buffers), although<br />
overall net present values remain positive. Currently neither carbon<br />
storage nor water quality has a direct price in the study region,<br />
meaning that <strong>decisions</strong> about whether to establish vegetation<br />
buffers hinge on the value assigned by decision-makers to the<br />
carbon-storage and water-quality improvements relative to the<br />
financial penalty. The Hawaii State Legislature has passed legislation<br />
mandating a reduction in greenho<strong>use</strong> gas emissions to 1990<br />
levels by 2020, and efforts to achieve these reductions could involve<br />
creating a market or other mechanism that establishes<br />
a state-wide carbon price. Furthermore, novel markets to incentivize<br />
water quality and quantity improvements are being trialed<br />
globally (although not yet in Hawaii) and provide models<br />
for how first approximation prices can be established for waterrelated<br />
<strong>ecosystem</strong> <strong>service</strong>s (28).<br />
Our analysis linked to the <strong>land</strong>-<strong>use</strong> planning process did not<br />
consider a full native vegetation-restoration scenario, given the<br />
ecological and financial challenges of doing so and the perception<br />
that such a scenario would not best achieve the balance of goals<br />
targeted by Kamehameha Schools and the community. Still, a fullrestoration<br />
scenario provides a <strong>use</strong>ful upper baseline from a conservation<br />
perspective and provides decision-makers an additional<br />
reference point informing the planning process. We found that<br />
a full-restoration scenario would deliver the greatest carbon<br />
storage enhancement, with a 30.4% (254,035 tC) improvement<br />
over the Status Quo scenario and a 28.4% (241,365 tC) improvement<br />
over the next-highest scenario, Food Crops and Forestry<br />
with Field Buffers. For water quality, we found that the fullrestoration<br />
scenario also would deliver the greatest enhancement,<br />
with a 46.0% improvement over the Status Quo scenario and<br />
a 13.6% improvement over the next-highest scenario, Biofuels<br />
with Field Buffers. These results illustrate that additional <strong>ecosystem</strong>-<strong>service</strong><br />
improvements could be realized if restoration were<br />
pursued as the overarching planning goal.<br />
Our <strong>ecosystem</strong>-<strong>service</strong>s modeling foc<strong>use</strong>d on carbon storage<br />
and water quality, but our planning scenarios also would be<br />
expected to affect differentially other <strong>ecosystem</strong> <strong>service</strong>s that we<br />
did not quantify. For example, crop pollination <strong>service</strong>s would be<br />
enhanced by scenarios that incorporate crops benefiting from<br />
pollination (e.g., some vegetable and fruit crops) and that add <strong>land</strong><br />
<strong>use</strong>s/covers providing pollinator habitat (e.g., agricultural field<br />
buffers or adjacent forest cover). Alternatively, this crop-pollination<br />
<strong>service</strong> would decrease for the Residential Development<br />
scenario, in which there are no crops to pollinate. Using additional<br />
models to quantify pollination and other <strong>ecosystem</strong> <strong>service</strong>s would<br />
further strengthen information supporting planning processes.<br />
<strong>Integrating</strong> <strong>ecosystem</strong> <strong>service</strong>s <strong>into</strong> local <strong>land</strong>-<strong>use</strong> planning, as<br />
our analysis does, provides a quantitative way for stakeholders to<br />
consider the environmental and economic implications of alternative<br />
<strong>land</strong>-<strong>use</strong> scenarios. Informed by the positive and negative<br />
outcomes of each scenario, Kamehameha Schools is working with<br />
the community to implement a <strong>land</strong>-<strong>use</strong> plan that prioritizes diversified<br />
agriculture and forestry while also considering additional<br />
compatible <strong>land</strong> <strong>use</strong>s on a smaller scale. The approach is designed<br />
to enhance on-site benefits, contribute to state-wide policy initiatives,<br />
and also inform the mitigation of negative impacts where<br />
necessary. Kamehameha Schools’ plan was the recipient of the<br />
American Planning Association’s 2011 National Planning Excellence<br />
Award for Innovation in Sustaining Places. This award recognized<br />
Kamehameha Schools for its community-engagement<br />
process and its final plan, which advances the organization’s strategic<br />
goal of incorporating economic, environmental, educational,<br />
cultural, and community values in all its <strong>land</strong>-<strong>use</strong> planning across<br />
the state.<br />
Our results highlight that <strong>ecosystem</strong>-<strong>service</strong> and economic<br />
<strong>tradeoffs</strong> are a key challenge that decision-makers will need to<br />
confront. A notable gap remains between recognition of the economic<br />
value of <strong>ecosystem</strong> <strong>service</strong>s to society (e.g., carbon storage,<br />
water-quality improvements, and others) and the financial value to<br />
<strong>land</strong>owners, beca<strong>use</strong> the value of <strong>ecosystem</strong> <strong>service</strong>s remains<br />
largely external to existing markets (17, 29–31). Addressing this<br />
situation through economic, legal, and cultural approaches remains<br />
a key challenge for mainstreaming <strong>ecosystem</strong> <strong>service</strong>s in <strong>land</strong>-<strong>use</strong><br />
planning. Making <strong>ecosystem</strong>-<strong>service</strong> <strong>tradeoffs</strong> explicit in decision<br />
making provides a window of opportunity to inform the adoption<br />
of strategies in which local and regional-scale <strong>land</strong>-<strong>use</strong> planning<br />
<strong>decisions</strong> contribute meaningfully to addressing sustainability<br />
challenges.<br />
Innovative projects advancing conservation to support human<br />
well-being are being documented increasingly, but turning scientific<br />
knowledge <strong>into</strong> action remains a fundamental challenge at<br />
local to global scales (16, 17). Examples of strategies found to<br />
enhance the knowledge-to-action transition include addressing<br />
4of6 | www.pnas.org/cgi/doi/10.1073/pnas.1201040109 Goldstein et al.
decision-relevant questions and using boundary institutions to<br />
facilitate bidirectional information flow between researchers and<br />
decision makers (32); enabling policy makers and communities to<br />
work collaboratively with researchers through a continual engagement<br />
model (33); and developing effective resource-management<br />
institutions to facilitate participatory processes and<br />
manage associated costs and complexities (34). Finding workable<br />
models and scaling them up will require continued advances in<br />
theory and practice and the recognition that these aspects inform<br />
and improve each other in motivating real-world change (35).<br />
Materials and Methods<br />
Study Context. Kamehameha Schools’ <strong>land</strong> holdings of ∼10,600 ha on the<br />
North Shore of O`ahu, Hawaii include ∼890 ha of rural residential and<br />
commercial <strong>land</strong>s along the coast, ∼3,640 ha of agricultural <strong>land</strong>s in the<br />
middle section (of which ∼2,200 ha, or 60%, are usable; the remainder is<br />
gulches), and ∼6,070 ha of rugged forest <strong>land</strong>s in the upper elevations. Our<br />
modeling analysis occurred in the background of Kamehameha Schools’<br />
planning process with North Shore communities to evaluate the potential of<br />
<strong>ecosystem</strong>-<strong>service</strong> mapping to provide information to support the planning<br />
process and to be integrated routinely going forward <strong>into</strong> Kamehameha<br />
Schools’ strategic planning activities with communities across the State<br />
of Hawaii.<br />
Planning Scenarios. We created seven spatially explicit <strong>land</strong>-<strong>use</strong>–planning<br />
scenarios in a Geographic Information System that were directly relevant to<br />
the planning process and which represented contrasting directions that<br />
could be taken with the agricultural <strong>land</strong>s (Fig. 1 and Table S1). To expand<br />
upon the decision context described briefly earlier in this paper, we foc<strong>use</strong>d<br />
the scenarios on a key planning decision: Should Kamehameha Schools<br />
spend approximately $7.0 million to improve the region’s aging irrigation<br />
infrastructure? This improvement would involve a substantial up front cost,<br />
but it would make possible the return of agricultural production to fallow<br />
fields currently lacking reliable irrigation water. This outcome would have<br />
the associated financial benefits of effectively lowering property taxes (beca<strong>use</strong><br />
the <strong>land</strong> would be in production) and delivering higher field rental<br />
rates beca<strong>use</strong> of the ability to grow higher-value crops, including food crops<br />
(e.g., vegetables) and sugarcane as a biofuel feedstock. Alternatively, if the<br />
irrigation system improvement was not made, agriculture would be limited<br />
to the approximately one-third of fields currently in production (assuming<br />
no future failure of the remaining irrigation system, which was a concern);<br />
this situation would have the associated financial impacts of <strong>land</strong> <strong>use</strong>s with<br />
lower field-rental rates and continued high property taxes on fallow <strong>land</strong>s.<br />
To construct the planning scenarios, we considered seven <strong>land</strong> <strong>use</strong>s for the<br />
agricultural fields. Two <strong>land</strong> <strong>use</strong>s—producing vegetable crops (for local<br />
markets) and sugarcane (as a biofuel feedstock)—were dependent upon<br />
improving the irrigation system; the remaining <strong>use</strong>s—leaving fields fallow<br />
[meaning that current <strong>land</strong> <strong>use</strong>/<strong>land</strong> cover (LULC) remained], producing<br />
nonhuman food crops (e.g., seed corn, as was currently being grown), pasture,<br />
native forestry plantings, and a residential development—were not<br />
irrigation-dependent. To code the scenarios, the agricultural fields were<br />
divided <strong>into</strong> three groups with each group being assigned one of these <strong>land</strong><br />
<strong>use</strong>s: (i) low-elevation fields currently receiving irrigation water; (ii) midelevation<br />
fields that could receive irrigation water if the improvement<br />
was made; and (iii) upper-elevation fields that would remain dependent<br />
upon precipitation (Fig. S1). The resulting scenarios are described in the<br />
Introduction.<br />
Beneficiary Groups. Applying an <strong>ecosystem</strong>-<strong>service</strong>s framework to <strong>land</strong>-<strong>use</strong><br />
planning requires identifying the actors who supply <strong>ecosystem</strong> <strong>service</strong>s (e.g.,<br />
<strong>land</strong>owners and <strong>land</strong> managers through their choices of <strong>land</strong>-<strong>use</strong> and<br />
management practices) and those actors who benefit from <strong>ecosystem</strong>-<strong>service</strong><br />
provision (36, 37). In our study region, we identified three beneficiary groups<br />
operating at different scales, all of whom have a direct stake in the current<br />
and future provision of <strong>ecosystem</strong> <strong>service</strong>s and associated financial benefits<br />
from the <strong>land</strong>scape: (i) local communities, i.e., the residents of the towns<br />
and rural residential areas along the North Shore coast; (ii) the private<br />
<strong>land</strong>owner, Kamehameha Schools; and (iii) the broader public, which benefits<br />
from the provision of public goods (e.g., carbon sequestration and<br />
storage contributing to climate stabilization). Although these groups are<br />
distinct, we note that there is partial overlap; for example, Kamehameha<br />
Schools is both the <strong>land</strong>owner and part of the local community, and public<br />
goods accruing to the broader public also benefit Kamehameha Schools and<br />
the local community.<br />
Modeling of Ecosystem Services and Financial Return. We evaluated each<br />
planning scenario based upon three metrics: (i) carbon storage related to<br />
global climate change mitigation; (ii) water-quality improvements affecting<br />
communities living in the study region; and (iii) financial return to support<br />
mission-related activities for Kamehameha Schools as an educational trust.<br />
Below, we provide details on each of these calculations. Although the <strong>land</strong><strong>use</strong><br />
planning scenarios included only changes to the agricultural <strong>land</strong>s, we<br />
modeled <strong>ecosystem</strong>-<strong>service</strong> flows across the entire planning region to ensure<br />
connectivity of the analysis for hydrologic flows. Input values for each of<br />
these models are provided in Tables S2–S4. Ecosystem <strong>service</strong>s and financial<br />
return were computed as a function of <strong>land</strong> characteristics and LULC type.<br />
The baseline LULC map was obtained from a spatial layer for O`ahu based<br />
upon imagery from the Hawaii Gap Analysis Program published in 2006. This<br />
layer has a 30-m pixel size, and all models were run at this resolution. Projected<br />
changes in <strong>ecosystem</strong>-<strong>service</strong> flows and financial return were computed<br />
by subtracting the model output for the Status Quo scenario from<br />
alternative planning scenarios.<br />
Carbon storage. We <strong>use</strong>d the InVEST Tier 1 carbon sequestration and storage<br />
model to calculate the carbon fraction in above- and belowground biomass<br />
according to LULC type. We assumed that carbon was 50% of total biomass<br />
and <strong>use</strong>d root-to-shoot ratios to estimate belowground biomass based upon<br />
specified values for aboveground biomass. We estimated biomass values to<br />
reflect full storage capacity for each LULC type based upon Hawaii studies,<br />
when available, and otherwise from the Intergovernmental Panel on Climate<br />
Change’s Guidelines for National Greenho<strong>use</strong> Gas Inventories Tier 1 protocol<br />
(Table S2) (38). In many situations, as with our study, data obtained directly<br />
from the study region are limited, meaning that in practice local <strong>land</strong>-<strong>use</strong><br />
planning efforts must <strong>use</strong> more general information sources (e.g., Intergovernmental<br />
Panel on Climate Change guidelines) as inputs. We assumed<br />
that woody biomass cleared from fallow fields would decay fully over<br />
our model time horizon of 50 y.<br />
Water-quality improvement. We <strong>use</strong>d the discharge of dissolved nitrogen as our<br />
proxy for pollution (recognizing that there are other important pollutants),<br />
beca<strong>use</strong> the agricultural <strong>land</strong>s are in close proximity to the ocean, and nitrogen<br />
generally is considered a limiting nutrient in marine systems (24). We<br />
<strong>use</strong>d the InVEST Tier 1 water-quality model (run during November 2008; this<br />
model has been modified since then), which projects relative improvements<br />
(or impairments) to water quality based upon slope, soil characteristics, and<br />
pollution export coefficients linked to LULC types (Table S3). For the two<br />
scenarios that incorporated vegetative field buffers, we assigned a filtering<br />
efficiency of 75%. Numerical results should be interpreted in a relative<br />
rather than absolute manner. As such, we present results as percent change<br />
from the Status Quo scenario. Positive changes project relative improvements<br />
in water quality for dissolved nitrogen; negative changes project<br />
relative impairments.<br />
Financial return. We projected the net present value of each <strong>land</strong>-<strong>use</strong> type<br />
using a discounted cash flow model over a 50-y time horizon with a 6% real<br />
discount rate and sensitivity analysis to 3–12% (Fig. S3). Kamehameha<br />
Schools provided information on expected agricultural <strong>land</strong>-rental rates and<br />
real property taxes, which were subtracted from rental rates to compute<br />
annual net return (Table S4). Kamehameha Schools also provided estimates<br />
of real estate prices for bulk sale of irrigated and nonirrigated agricultural<br />
<strong>land</strong>s for the Residential Development scenario. We assumed that this scenario<br />
involved financial returns for the current <strong>land</strong>scape in model year<br />
0 with the full <strong>land</strong> sale occurring in year 1; this assumption is reasonable,<br />
given the <strong>land</strong> area considered in this analysis. Improvements to the irrigation<br />
system were assumed to cost $7.0 million, with costs spread evenly over<br />
the first 4 y. These costs were incorporated <strong>into</strong> all scenarios involving irrigation<br />
system improvements.<br />
ACKNOWLEDGMENTS. We thank the Land Assets Division at Kamehameha<br />
Schools for supporting this project and providing input <strong>into</strong> research design<br />
and analysis, for facilitating site visits, and for access to spatial data layers.<br />
We also thank the Winslow Foundation, P. and H. Bing, and V. and R. Sant<br />
for support.<br />
SUSTAINABILITY<br />
SCIENCE<br />
1. Millennium Ecosystem Assessment (2005) Ecosystems and Human Well-Being: Synthesis<br />
(Is<strong>land</strong>, Washington, DC).<br />
2. National Research Council (2005) Valuing Ecosystem Services: Toward Better Environmental<br />
Decision-Making (National Academies, Washington, DC).<br />
Goldstein et al. PNAS Early Edition | 5of6
3. US Environmental Protection Agency (2009) Valuing the Protection of Ecological<br />
Systems and Services: A Report of the EPA Science Advisory Board. EPA Publication<br />
EPA-SAB-09-012.<br />
4. The Economics of Ecosystem and Biodiversity (2010) The economics of <strong>ecosystem</strong>s and<br />
biodiversity: Mainstreaming the economics of nature: A synthesis of the approach,<br />
conclusions and recommendations of TEEB. Available at http://www.teebweb.org/<br />
LinkClick.aspx?fileticket=bYhDohL_TuM%3d&tabid=1278&mid=2357. Accessed August<br />
29, 2011.<br />
5. Zhang P, et al. (2000) China’s forest policy for the 21 st century. Science 288:2135–2136.<br />
6. Bradshaw CJA, et al. (2007) Global evidence that deforestation amplifies flood risk<br />
and severity in the developing world. Glob Change Biol 13:2379–2395.<br />
7. Danielsen F, et al. (2005) The Asian tsunami: A protective role for coastal vegetation.<br />
Science 310:643.<br />
8. Day JW, Jr., et al. (2007) Restoration of the Mississippi Delta: Lessons from Hurricanes<br />
Katrina and Rita. Science 315:1679–1684.<br />
9. National Research Council (2007) Status of Pollinators in North America (National<br />
Academies, Washington, DC).<br />
10. Foley JA, et al. (2005) Global consequences of <strong>land</strong> <strong>use</strong>. Science 309:570–574.<br />
11. Tilman D, et al. (2009) Energy. Beneficial biofuels—the food, energy, and environment<br />
trilemma. Science 325:270–271.<br />
12. Rockström J, et al. (2009) A safe operating space for humanity. Nature 461:472–475.<br />
13. Reid WV, et al. (2010) Environment and development. Earth system science for global<br />
sustainability: Grand challenges. Science 330:916–917.<br />
14. Daily GC, Matson PA (2008) Ecosystem <strong>service</strong>s: From theory to implementation. Proc<br />
Natl Acad Sci USA 105:9455–9456.<br />
15. Liu J, Li S, Ouyang Z, Tam C, Chen X (2008) Ecological and socioeconomic effects of<br />
China’s policies for <strong>ecosystem</strong> <strong>service</strong>s. Proc Natl Acad Sci USA 105:9489–9494.<br />
16. Carpenter SR, et al. (2009) Science for managing <strong>ecosystem</strong> <strong>service</strong>s: Beyond the<br />
Millennium Ecosystem Assessment. Proc Natl Acad Sci USA 106:1305–1312.<br />
17. Daily GC, et al. (2009) Ecosystem <strong>service</strong>s in decision making: Time to deliver. Front<br />
Ecol Environ 7:21–28.<br />
18. Nelson E, et al. (2009) Modeling multiple <strong>ecosystem</strong> <strong>service</strong>s, biodiversity conservation,<br />
commodity production, and <strong>tradeoffs</strong> at <strong>land</strong>scape scales. Front Ecol Environ 1:<br />
4–11.<br />
19. Tallis H, Polasky S (2009) Mapping and valuing <strong>ecosystem</strong> <strong>service</strong>s as an approach for<br />
conservation and natural-resource management. Ann N Y Acad Sci 1162:265–283.<br />
20. Kareiva P, Tallis H, Ricketts TH, Daily GC, Polasky S, eds (2011) Natural Capital: Theory<br />
and Practice of Mapping Ecosystem Services (Oxford Univ Press, New York).<br />
21. Tallis HT, et al. (2010) InVEST 1.004 beta <strong>use</strong>r’s guide (The Natural Capital Project,<br />
Stanford, CA).<br />
22. Nepstad DC, Stickler CM, Almeida OT (2006) Globalization of the Amazon soy and<br />
beef industries: Opportunities for conservation. Conserv Biol 20:1595–1603.<br />
23. Kamehameha Schools (2000) Kamehameha Schools Strategic Plan: 2000–2015.<br />
Available at www.ksbe.edu/osp/Publications/EntireDocument.pdf. Accessed August<br />
29, 2011.<br />
24. Smith SV (1984) Phosphorus versus nitrogen limitation in the marine environment.<br />
Limnol Oceanogr 29:1149–1160.<br />
25. Connell SD, et al. (2008) Recovering a lost baseline: Missing kelp forests from a metropolitan<br />
coast. Mar Ecol Prog Ser 360:63–72.<br />
26. Fargione J, Hill J, Tilman D, Polasky S, Hawthorne P (2008) Land clearing and the<br />
biofuel carbon debt. Science 319:1235–1238.<br />
27. Correll D (1997) Buffer Zones: Their Processes and Potential in Water Protection, eds<br />
Haycock N, Burt T, Goulding K, Pinay G (Quest Environmental, Hertfordshire, UK), pp<br />
7–20.<br />
28. Nel D, Marais C, Blignaut J (2009) Water neutrality: A first quantitative framework for<br />
investing in water in South Africa. Conserv Letters 2:12–19.<br />
29. Polasky S, Nelson E, Pennington D, Johnson KA (2011) The impact of <strong>land</strong>-<strong>use</strong> change<br />
on <strong>ecosystem</strong> <strong>service</strong>s, biodiversity and returns to <strong>land</strong>owners: A case study in the<br />
State of Minnesota. Environ Resour Econ 48:219–242.<br />
30. Naidoo R, Malcolm T, Tomasek A (2009) Economic benefits of standing forests in<br />
high<strong>land</strong> areas of Borneo: Quantification and policy impacts. Conserv Letters 2:35–44.<br />
31. Kremen C, et al. (2000) Economic incentives for rain forest conservation across scales.<br />
Science 288:1828–1832.<br />
32. Buizer J, Jacobs K, Cash D (2009) Making short-term climate forecasts <strong>use</strong>ful: Linking<br />
science and action. Proc Natl Acad Sci USA, 10.1073/pnas.0900518107.<br />
33. Reid RS, et al. (2009) Evolution of models to support community and policy action<br />
with science: Balancing pastoral livelihoods and wildlife conservation in savannas of<br />
East Africa. Proc Natl Acad Sci USA, 10.1073/pnas.0900313106.<br />
34. Jacobs K, et al. (2009) Linking knowledge with action in the pursuit of sustainable<br />
water-resources management. Proc Natl Acad Sci USA, 10.1073/pnas.0813125107.<br />
35. Goldman-Benner RL, et al. (2012) Water funds and payments for <strong>ecosystem</strong> <strong>service</strong>s:<br />
Practice learns from theory and theory learns from practice. Oryx 46:55–63.<br />
36. Ruhl JB, Kraft SE, Lant CL (2007) The Law and Policy of Ecosystem Services (Is<strong>land</strong>,<br />
Washington, DC).<br />
37. Turner RK, Daily GC (2008) The <strong>ecosystem</strong> <strong>service</strong>s framework and natural capital<br />
conservation. Environ Resour Econ 39:25–35.<br />
38. Intergovernmental Panel on Climate Change (IPCC) (2006) 2006 IPCC Guidelines for<br />
National Greenho<strong>use</strong> Gas Inventories (Institute for Global Environmental Strategies,<br />
Japan).<br />
6of6 | www.pnas.org/cgi/doi/10.1073/pnas.1201040109 Goldstein et al.