Use of Rational and Modified Rational Method for ... - CTR Library
Use of Rational and Modified Rational Method for ... - CTR Library
Use of Rational and Modified Rational Method for ... - CTR Library

You also want an ePaper? Increase the reach of your titles
YUMPU automatically turns print PDFs into web optimized ePapers that Google loves.
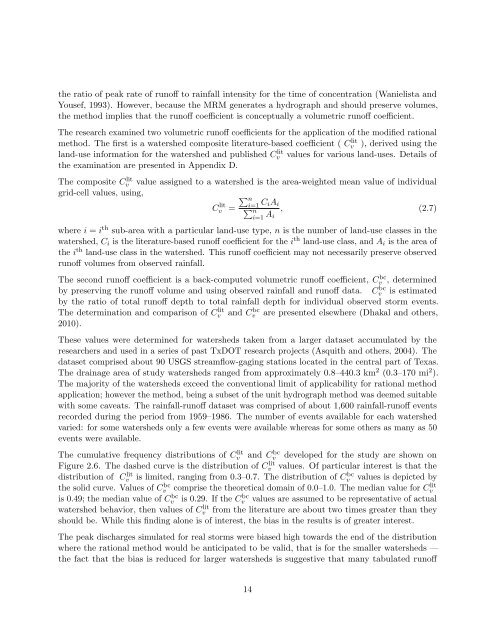
the ratio <strong>of</strong> peak rate <strong>of</strong> run<strong>of</strong>f to rainfall intensity <strong>for</strong> the time <strong>of</strong> concentration (Wanielista <strong>and</strong><br />
Yousef, 1993). However, because the MRM generates a hydrograph <strong>and</strong> should preserve volumes,<br />
the method implies that the run<strong>of</strong>f coefficient is conceptually a volumetric run<strong>of</strong>f coefficient.<br />
The research examined two volumetric run<strong>of</strong>f coefficients <strong>for</strong> the application <strong>of</strong> the modified rational<br />
method. The first is a watershed composite literature-based coefficient ( Cv<br />
lit ), derived using the<br />
l<strong>and</strong>-use in<strong>for</strong>mation <strong>for</strong> the watershed <strong>and</strong> published Cv<br />
lit values <strong>for</strong> various l<strong>and</strong>-uses. Details <strong>of</strong><br />
the examination are presented in Appendix D.<br />
The composite Cv<br />
lit<br />
grid-cell values, using,<br />
value assigned to a watershed is the area-weighted mean value <strong>of</strong> individual<br />
∑ n<br />
Cv lit i=1<br />
= ∑ C iA i<br />
n<br />
i=1 A , (2.7)<br />
i<br />
where i = i th sub-area with a particular l<strong>and</strong>-use type, n is the number <strong>of</strong> l<strong>and</strong>-use classes in the<br />
watershed, C i is the literature-based run<strong>of</strong>f coefficient <strong>for</strong> the i th l<strong>and</strong>-use class, <strong>and</strong> A i is the area <strong>of</strong><br />
the i th l<strong>and</strong>-use class in the watershed. This run<strong>of</strong>f coefficient may not necessarily preserve observed<br />
run<strong>of</strong>f volumes from observed rainfall.<br />
The second run<strong>of</strong>f coefficient is a back-computed volumetric run<strong>of</strong>f coefficient, Cv bc , determined<br />
by preserving the run<strong>of</strong>f volume <strong>and</strong> using observed rainfall <strong>and</strong> run<strong>of</strong>f data. Cv<br />
bc is estimated<br />
by the ratio <strong>of</strong> total run<strong>of</strong>f depth to total rainfall depth <strong>for</strong> individual observed storm events.<br />
The determination <strong>and</strong> comparison <strong>of</strong> Cv<br />
lit <strong>and</strong> Cv<br />
bc are presented elsewhere (Dhakal <strong>and</strong> others,<br />
2010).<br />
These values were determined <strong>for</strong> watersheds taken from a larger dataset accumulated by the<br />
researchers <strong>and</strong> used in a series <strong>of</strong> past TxDOT research projects (Asquith <strong>and</strong> others, 2004). The<br />
dataset comprised about 90 USGS streamflow-gaging stations located in the central part <strong>of</strong> Texas.<br />
The drainage area <strong>of</strong> study watersheds ranged from approximately 0.8–440.3 km 2 (0.3–170 mi 2 ).<br />
The majority <strong>of</strong> the watersheds exceed the conventional limit <strong>of</strong> applicability <strong>for</strong> rational method<br />
application; however the method, being a subset <strong>of</strong> the unit hydrograph method was deemed suitable<br />
with some caveats. The rainfall-run<strong>of</strong>f dataset was comprised <strong>of</strong> about 1,600 rainfall-run<strong>of</strong>f events<br />
recorded during the period from 1959–1986. The number <strong>of</strong> events available <strong>for</strong> each watershed<br />
varied: <strong>for</strong> some watersheds only a few events were available whereas <strong>for</strong> some others as many as 50<br />
events were available.<br />
The cumulative frequency distributions <strong>of</strong> C lit<br />
v<br />
Figure 2.6. The dashed curve is the distribution <strong>of</strong> C lit<br />
v<br />
distribution <strong>of</strong> C lit<br />
v<br />
the solid curve. Values <strong>of</strong> C bc<br />
v<br />
is 0.49; the median value <strong>of</strong> C bc<br />
v<br />
<strong>and</strong> Cv<br />
bc developed <strong>for</strong> the study are shown on<br />
values. Of particular interest is that the<br />
is limited, ranging from 0.3–0.7. The distribution <strong>of</strong> Cv<br />
bc values is depicted by<br />
comprise the theoretical domain <strong>of</strong> 0.0–1.0. The median value <strong>for</strong> Cv<br />
lit<br />
is 0.29. If the Cv<br />
bc values are assumed to be representative <strong>of</strong> actual<br />
watershed behavior, then values <strong>of</strong> Cv<br />
lit from the literature are about two times greater than they<br />
should be. While this finding alone is <strong>of</strong> interest, the bias in the results is <strong>of</strong> greater interest.<br />
The peak discharges simulated <strong>for</strong> real storms were biased high towards the end <strong>of</strong> the distribution<br />
where the rational method would be anticipated to be valid, that is <strong>for</strong> the smaller watersheds —<br />
the fact that the bias is reduced <strong>for</strong> larger watersheds is suggestive that many tabulated run<strong>of</strong>f<br />
14