1 PMT Base Capacitors and Resistors at Nitrogen ... - LArTPC DocDB
1 PMT Base Capacitors and Resistors at Nitrogen ... - LArTPC DocDB
1 PMT Base Capacitors and Resistors at Nitrogen ... - LArTPC DocDB

Create successful ePaper yourself
Turn your PDF publications into a flip-book with our unique Google optimized e-Paper software.
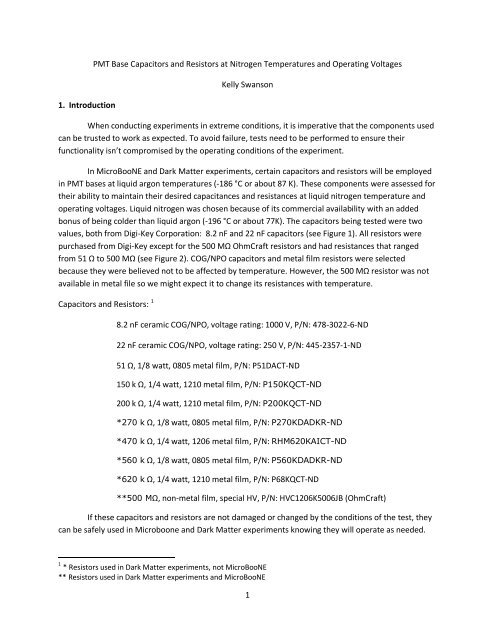
1. Introduction<br />
<strong>PMT</strong> <strong>Base</strong> <strong>Capacitors</strong> <strong>and</strong> <strong>Resistors</strong> <strong>at</strong> <strong>Nitrogen</strong> Temper<strong>at</strong>ures <strong>and</strong> Oper<strong>at</strong>ing Voltages<br />
Kelly Swanson<br />
When conducting experiments in extreme conditions, it is imper<strong>at</strong>ive th<strong>at</strong> the components used<br />
can be trusted to work as expected. To avoid failure, tests need to be performed to ensure their<br />
functionality isn’t compromised by the oper<strong>at</strong>ing conditions of the experiment.<br />
In MicroBooNE <strong>and</strong> Dark M<strong>at</strong>ter experiments, certain capacitors <strong>and</strong> resistors will be employed<br />
in <strong>PMT</strong> bases <strong>at</strong> liquid argon temper<strong>at</strong>ures (-186 °C or about 87 K). These components were assessed for<br />
their ability to maintain their desired capacitances <strong>and</strong> resistances <strong>at</strong> liquid nitrogen temper<strong>at</strong>ure <strong>and</strong><br />
oper<strong>at</strong>ing voltages. Liquid nitrogen was chosen because of its commercial availability with an added<br />
bonus of being colder than liquid argon (-196 °C or about 77K). The capacitors being tested were two<br />
values, both from Digi-Key Corpor<strong>at</strong>ion: 8.2 nF <strong>and</strong> 22 nF capacitors (see Figure 1). All resistors were<br />
purchased from Digi-Key except for the 500 MΩ OhmCraft resistors <strong>and</strong> had resistances th<strong>at</strong> ranged<br />
from 51 Ω to 500 MΩ (see Figure 2). COG/NPO capacitors <strong>and</strong> metal film resistors were selected<br />
because they were believed not to be affected by temper<strong>at</strong>ure. However, the 500 MΩ resistor was not<br />
available in metal file so we might expect it to change its resistances with temper<strong>at</strong>ure.<br />
<strong>Capacitors</strong> <strong>and</strong> <strong>Resistors</strong>: 1<br />
8.2 nF ceramic COG/NPO, voltage r<strong>at</strong>ing: 1000 V, P/N: 478-3022-6-ND<br />
22 nF ceramic COG/NPO, voltage r<strong>at</strong>ing: 250 V, P/N: 445-2357-1-ND<br />
51 Ω, 1/8 w<strong>at</strong>t, 0805 metal film, P/N: P51DACT-ND<br />
150 k Ω, 1/4 w<strong>at</strong>t, 1210 metal film, P/N: P150KQCT-ND<br />
200 k Ω, 1/4 w<strong>at</strong>t, 1210 metal film, P/N: P200KQCT-ND<br />
*270 k Ω, 1/8 w<strong>at</strong>t, 0805 metal film, P/N: P270KDADKR-ND<br />
*470 k Ω, 1/4 w<strong>at</strong>t, 1206 metal film, P/N: RHM620KAICT-ND<br />
*560 k Ω, 1/8 w<strong>at</strong>t, 0805 metal film, P/N: P560KDADKR-ND<br />
*620 k Ω, 1/4 w<strong>at</strong>t, 1210 metal film, P/N: P68KQCT-ND<br />
**500 MΩ, non-metal film, special HV, P/N: HVC1206K5006JB (OhmCraft)<br />
If these capacitors <strong>and</strong> resistors are not damaged or changed by the conditions of the test, they<br />
can be safely used in Microboone <strong>and</strong> Dark M<strong>at</strong>ter experiments knowing they will oper<strong>at</strong>e as needed.<br />
1 * <strong>Resistors</strong> used in Dark M<strong>at</strong>ter experiments, not MicroBooNE<br />
** <strong>Resistors</strong> used in Dark M<strong>at</strong>ter experiments <strong>and</strong> MicroBooNE<br />
1
Figure 1: 8.2 nF capacitor<br />
Figure 2a: 200 kΩ resistor<br />
2 mm<br />
1.25<br />
mm<br />
Figure 2b: 51 Ω resistor<br />
2. Methods <strong>and</strong> M<strong>at</strong>erials<br />
i. Testing Capacitance<br />
To test the capacitances, we used a Sencore Capacitor-Inductor Analyzer Model LC76 (see figure<br />
3). This test was done <strong>at</strong> room <strong>and</strong> liquid nitrogen temper<strong>at</strong>ures, the room temper<strong>at</strong>ure d<strong>at</strong>a acting as a<br />
baseline to monitor whether the cold temper<strong>at</strong>ure affected the electronics. Before testing the<br />
capacitors, wire leads were soldered to the ends which allowed the capacitors to remain completely<br />
immersed in the liquid while still connected to the Analyzer.<br />
Once the probes were <strong>at</strong>tached <strong>and</strong> the capacitors were in the nitrogen, cooled such th<strong>at</strong> the<br />
liquid around the capacitors no longer boiled, the capacitances were measured (see Figure 4). The<br />
2
capacitors were then removed from the nitrogen <strong>and</strong> warmed back up room temper<strong>at</strong>ure, after which<br />
they were placed in the nitrogen again <strong>and</strong> their capacitances were measured. The purpose of cycling<br />
between room <strong>and</strong> liquid nitrogen temper<strong>at</strong>ures was to determine if the temper<strong>at</strong>ure shocks impacted<br />
the capacitor’s performance.<br />
This process was done five times per capacitor.<br />
Figure 3: Sencore Capacitor-Inductor Analyzer<br />
Figure 4: <strong>Nitrogen</strong> pot in which the capacitors were placed<br />
3
ii. Testing Voltage across <strong>Capacitors</strong><br />
In order to ensure the capacitors did not leak current <strong>at</strong> oper<strong>at</strong>ing voltages, a high voltage<br />
supply was used to test them. If a capacitor could not toler<strong>at</strong>e the voltage, it would draw a current<br />
which the supply would register.<br />
The supply was connected to each capacitor, <strong>and</strong> the voltage was slowly increased until across<br />
the capacitor there was twice as much voltage as the st<strong>and</strong>-off voltage given by the manufacturer. At<br />
th<strong>at</strong> point, the current was measured using the supply. This was performed <strong>at</strong> room <strong>and</strong> liquid nitrogen<br />
temper<strong>at</strong>ures with wire leads soldered to the ends of the capacitors.<br />
iii. Testing Resistance<br />
Wire leads were soldered to the ends of the resistors, allowing them to remain in the nitrogen<br />
while the measurements were taken. For the resistors, a Hewlett Packard 3457A multimeter was used<br />
to measure resistance (see Figure 5). Each resistor was connected to the multimeter, <strong>and</strong> its resistance<br />
measured, <strong>at</strong> room temper<strong>at</strong>ure <strong>and</strong> again in liquid nitrogen.<br />
iv. Testing Voltage across <strong>Resistors</strong><br />
Figure 5: Hewlett Packard multimeter<br />
The resistors were connected to the high voltage supply, <strong>and</strong> the voltage across the resistors<br />
was measured <strong>at</strong> four different currents. These values were chosen specifically because of the <strong>PMT</strong> base<br />
designs (see Figure 6). Given th<strong>at</strong> the maximum voltage across the MicroBooNE base is 2000 V <strong>and</strong> the<br />
total resistance is 4052 kΩ, 0.5 mA is the maximum current passing through any resistor. As such, we<br />
tested to the maximum current the supply could provide, about 0.8 mA, <strong>and</strong> took readings. R<strong>at</strong>her than<br />
reading the voltages using the high voltage supply, a Fluke multimeter was used to measure the voltage<br />
directly across the resistors. The high voltage supply had an internal 200 kΩ resistor in series with our<br />
resistors, <strong>and</strong> the Fluke multimeter allowed us to ignore this resistor in our d<strong>at</strong>a analysis. The current<br />
readings were given by the high voltage supply.<br />
This procedure was performed <strong>at</strong> room temper<strong>at</strong>ure <strong>and</strong> in liquid nitrogen for all the resistors<br />
except the 51 Ω <strong>and</strong> the 500 MΩ. The 51 Ω resistor was not tested because, using this method, it was<br />
4
not suppose to draw significant voltages. The 500 MΩ resistor would see very little current, but since it<br />
has to withst<strong>and</strong> 1000 V, we tested it to 1500 V. However, the Fluke multimeter reads only to 1000 V so<br />
we measured the voltage using the high voltage supply <strong>and</strong> took the 200 kΩ resistor into account.<br />
High Voltage<br />
Requirements<br />
Typical Current ~0.5 mA<br />
Figure 6a: MicroBooNE <strong>PMT</strong> base schem<strong>at</strong>ic<br />
5
51<br />
Figure 6b: R11065 base schem<strong>at</strong>ic<br />
3. Results<br />
i. Capacitance Test<br />
In liquid nitrogen, each of the capacitances remained constant <strong>and</strong> corresponded to their room<br />
temper<strong>at</strong>ure counterparts (see Table 1).<br />
Capacitor #<br />
Capacitance<br />
Room<br />
Temper<strong>at</strong>ure (nF)<br />
<strong>Nitrogen</strong>:<br />
Cycle 1 (nF)<br />
<strong>Nitrogen</strong>:<br />
Cycle 2 (nF)<br />
<strong>Nitrogen</strong>:<br />
Cycle 3 (nF)<br />
<strong>Nitrogen</strong>:<br />
Cycle 4 (nF)<br />
<strong>Nitrogen</strong>:<br />
Cycle 5 (nF)<br />
1 8.37 8.31 8.38 8.36 8.33 8.35<br />
2 8.17 8.12 8.17 8.16 8.14 8.16<br />
3 22.6 22.8 22.8 22.8 22.8 22.8<br />
4 23.1 23.2 23.2 23.2 23.2 23.2<br />
Table 1: Capacitances <strong>at</strong> Room Temper<strong>at</strong>ure <strong>and</strong> in Liquid <strong>Nitrogen</strong>.<br />
6
ii. Voltage Test: <strong>Capacitors</strong><br />
None of the capacitors leaked current <strong>at</strong> either room or liquid nitrogen temper<strong>at</strong>ures. At their<br />
appropri<strong>at</strong>e voltages, the current through the capacitors was undetectable to the sensitivity of the high<br />
voltage supply, 1 nA. See Table 2 for results.<br />
Capacitor # Voltage (V) Current <strong>at</strong> Room<br />
Temper<strong>at</strong>ure (mA)<br />
Current in Liquid <strong>Nitrogen</strong><br />
(mA)<br />
1 2000 Undet. Undet.<br />
2 2000 Undet. Undet.<br />
3 500 Undet. Undet.<br />
4 500 Undet. Undet.<br />
Table 2: Voltages through <strong>Capacitors</strong> <strong>at</strong> Room <strong>and</strong> Liquid <strong>Nitrogen</strong> Temper<strong>at</strong>ures. Undet.=
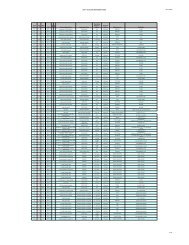
R (2)<br />
was used to determine whether the resistances stayed the same over different voltages. Each voltage<br />
<strong>and</strong> its corresponding current was substituted into Equ<strong>at</strong>ion (2), <strong>and</strong> the results <strong>at</strong> both room <strong>and</strong><br />
nitrogen temper<strong>at</strong>ures show no significant changes in resistances except for the 500 MΩ (see Table 4).<br />
This resistor had a 9.5% increase in its resistance while in liquid nitrogen compared to when it was in<br />
room temper<strong>at</strong>ure. The highlighted rows are when the resistors were submerged in the nitrogen.<br />
Resistor<br />
Measured Voltage (V)<br />
Calcul<strong>at</strong>ed Resistance (kΩ)<br />
# 0 mA 0.3 mA 0.6 mA 0.8 mA 0 0.3 mA 0.6 mA 0.8 mA<br />
1 -- -- -- -- -- -- -- --<br />
2 -- -- -- -- -- -- -- --<br />
0 44.6 89.4 119.1 -- 148.7 149.0 148.9<br />
3<br />
0 44.6 89.4 119.1 -- 148.7 149.0 148.9<br />
4<br />
5<br />
6<br />
7<br />
8<br />
0 44.7 89.4 119.1 -- 149.0 149.2 149.0<br />
0 44.7 89.5 119.2 -- 149.0 149.2 148.9<br />
0 59.5 118.8 158.6 -- 198.3 198.0 198.3<br />
0 59.3 119.0 158.5 -- 197.7 198.3 198.1<br />
0 59.3 119.1 158.7 -- 197.7 198.5 198.4<br />
0 59.4 119.0 158.5 -- 198.0 198.3 198.1<br />
0 80.4 160.4 214.1 -- 268.0 267.3 267.6<br />
0 80.3 161.0 213.9 -- 267.7 268.3 267.4<br />
0 79.8 160.0 213.7 -- 266.0 266.7 267.1<br />
0 80.7 160.8 214.5 -- 269.0 268.0 268.1<br />
Resistor<br />
#<br />
9<br />
10<br />
11<br />
12<br />
13<br />
14<br />
Measured Voltage (V)<br />
Calcul<strong>at</strong>ed Resistance (kΩ)<br />
0 mA 0.3 mA 0.6 mA 0.775 mA 0 mA 0.3 mA 0.6 mA 0.775 mA<br />
0 139.9 278.7 359.9 -- 466.3 464.5 464.4<br />
0 143.3 283.3 363.8 -- 477.7 472.2 469.4<br />
0 139.5 279.0 360.6 -- 465.0 465.0 465.3<br />
0 143.6 284.5 365.6 -- 465.0 465.0 47.2<br />
0 166.0 332.1 428 -- 553.3 553.5 570.3<br />
0 166.0 331.9 442 -- 553.3 553.2 570.3<br />
0 166.5 331.5 428 -- 555.0 552.5 552.3<br />
0 166.2 332.4 429 -- 554.0 554.0 553.5<br />
0 183.5 367.8 478 -- 611.7 613.0 616.8<br />
0 185.5 366.2 471 -- 618.3 610.3 607.7<br />
0 183.7 367.8 477 -- 612.3 607.3 615.5<br />
0 184.8 364.4 470 -- 612.3 613.0 615.5<br />
Table 4a: Measured Voltages <strong>and</strong> Calcul<strong>at</strong>ed Resistances <strong>at</strong> their Corresponding Currents for <strong>Resistors</strong>.<br />
Highlighted rows are for the results when the resistors were in liquid nitrogen.<br />
8
Resistor<br />
#<br />
15<br />
Measured Current (mA)<br />
Calcul<strong>at</strong>ed Resistance (kΩ)<br />
0 V 500 V 1000 V 1500 V 0 500 V 1000 V 1500 V<br />
0 9.8e-4 1.91e-3 2.84e-3 -- 508.2 MΩ 521.2 MΩ 526.2 MΩ<br />
0 9.8e-4 2.1e-3 3.13e-3 -- 508.2 MΩ 474.2 MΩ 477.2 MΩ<br />
Table 4b. Measured Currents <strong>and</strong> Calcul<strong>at</strong>ed Resistances <strong>at</strong> their Corresponding Voltages. Highlighted<br />
rows are for the results when the resistor was in liquid nitrogen.<br />
4. Conclusion<br />
These resistors <strong>and</strong> capacitors performed as they should in liquid nitrogen: their capacitances<br />
<strong>and</strong> resistances remain constant, the capacitors do not leak current, <strong>and</strong> the resistors maintain their<br />
resistances across different voltages. While the 500 MΩ resistor had an increase in its resistance <strong>at</strong><br />
liquid nitrogen temper<strong>at</strong>ure, this component can still be used as planned in the MicroBooNE base<br />
design. Since they are being used to stabilize voltage, <strong>and</strong> not as part of the dynode structure, a change<br />
in its resistance is acceptable. As such, all these components can be used the MicroBooNE <strong>and</strong> dark<br />
m<strong>at</strong>ter experiments.<br />
9