

the-multicultural-edge-rising-super-consumers-march-2015
the-multicultural-edge-rising-super-consumers-march-2015
the-multicultural-edge-rising-super-consumers-march-2015

Create successful ePaper yourself
Turn your PDF publications into a flip-book with our unique Google optimized e-Paper software.
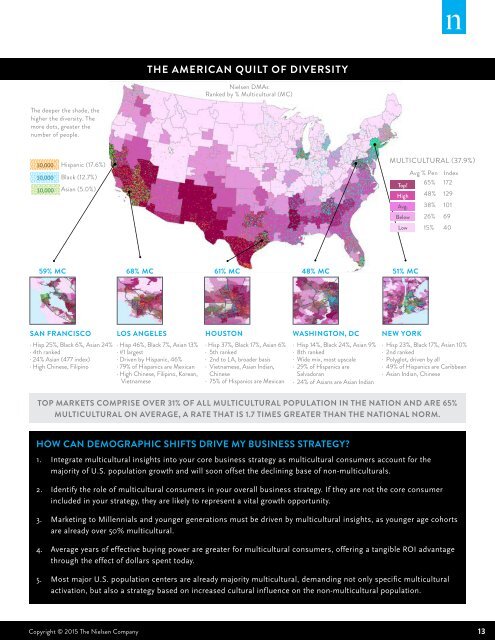
The American Quilt of Diversity<br />
Nielsen DMAs<br />
Ranked by % Multicultural (MC)<br />
The deeper <strong>the</strong> shade, <strong>the</strong><br />
higher <strong>the</strong> diversity. The<br />
more dots, greater <strong>the</strong><br />
number of people.<br />
10,000 <br />
10,000 <br />
10,000 <br />
Hispanic (17.6%)<br />
Black (12.7%)<br />
Asian (5.0%)<br />
Multicultural (37.9%)<br />
Avg % Pen Index<br />
Top!<br />
65% 172<br />
High 48% 129<br />
Avg. 38% 101<br />
Below 26% 69<br />
Low 15% 40<br />
59% MC 68% MC 61% MC<br />
48% MC 51% MC<br />
San Francisco<br />
Los Angeles<br />
Houston<br />
Washington, DC<br />
New York<br />
· Hisp 25%, Black 6%, Asian 24%<br />
· 4th ranked<br />
· 24% Asian (477 index)<br />
· High Chinese, Filipino<br />
· Hisp 46%, Black 7%, Asian 13%<br />
· #1 largest<br />
· Driven by Hispanic, 46%<br />
· 79% of Hispanics are Mexican<br />
· High Chinese, Filipino, Korean,<br />
Vietnamese<br />
· Hisp 37%, Black 17%, Asian 6%<br />
· 5th ranked<br />
· 2nd to LA, broader basis<br />
· Vietnamese, Asian Indian,<br />
Chinese<br />
· 75% of Hispanics are Mexican<br />
· Hisp 14%, Black 24%, Asian 9%<br />
· 8th ranked<br />
· Wide mix, most upscale<br />
· 29% of Hispanics are<br />
Salvadoran<br />
· 24% of Asians are Asian Indian<br />
· Hisp 23%, Black 17%, Asian 10%<br />
· 2nd ranked<br />
· Polyglot, driven by all<br />
· 49% of Hispanics are Caribbean<br />
· Asian Indian, Chinese<br />
Top markets comprise over 31% of all <strong>multicultural</strong> population in <strong>the</strong> nation and are 65%<br />
<strong>multicultural</strong> on average, a rate that is 1.7 times greater than <strong>the</strong> national norm.<br />
HOW CAN DEMOGRAPHIC SHIFTS DRIVE MY BUSINESS STRATEGY?<br />
1. Integrate <strong>multicultural</strong> insights into your core business strategy as <strong>multicultural</strong> <strong>consumers</strong> account for <strong>the</strong><br />
majority of U.S. population growth and will soon offset <strong>the</strong> declining base of non-<strong>multicultural</strong>s.<br />
2. Identify <strong>the</strong> role of <strong>multicultural</strong> <strong>consumers</strong> in your overall business strategy. If <strong>the</strong>y are not <strong>the</strong> core consumer<br />
included in your strategy, <strong>the</strong>y are likely to represent a vital growth opportunity.<br />
3. Marketing to Millennials and younger generations must be driven by <strong>multicultural</strong> insights, as younger age cohorts<br />
are already over 50% <strong>multicultural</strong>.<br />
4. Average years of effective buying power are greater for <strong>multicultural</strong> <strong>consumers</strong>, offering a tangible ROI advantage<br />
through <strong>the</strong> effect of dollars spent today.<br />
5. Most major U.S. population centers are already majority <strong>multicultural</strong>, demanding not only specific <strong>multicultural</strong><br />
activation, but also a strategy based on increased cultural influence on <strong>the</strong> non-<strong>multicultural</strong> population.<br />
Copyright © <strong>2015</strong> The Nielsen Company<br />
13