green & myerson 2004.. - of /courses
green & myerson 2004.. - of /courses
green & myerson 2004.. - of /courses

Create successful ePaper yourself
Turn your PDF publications into a flip-book with our unique Google optimized e-Paper software.
Green and Myerson Page 46 <strong>of</strong> 48<br />
NIH-PA Author Manuscript NIH-PA Author Manuscript NIH-PA Author Manuscript<br />
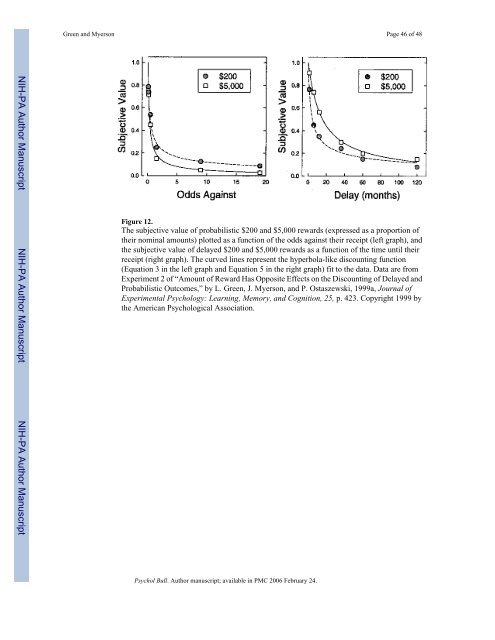
Figure 12.<br />
The subjective value <strong>of</strong> probabilistic $200 and $5,000 rewards (expressed as a proportion <strong>of</strong><br />
their nominal amounts) plotted as a function <strong>of</strong> the odds against their receipt (left graph), and<br />
the subjective value <strong>of</strong> delayed $200 and $5,000 rewards as a function <strong>of</strong> the time until their<br />
receipt (right graph). The curved lines represent the hyperbola-like discounting function<br />
(Equation 3 in the left graph and Equation 5 in the right graph) fit to the data. Data are from<br />
Experiment 2 <strong>of</strong> “Amount <strong>of</strong> Reward Has Opposite Effects on the Discounting <strong>of</strong> Delayed and<br />
Probabilistic Outcomes,” by L. Green, J. Myerson, and P. Ostaszewski, 1999a, Journal <strong>of</strong><br />
Experimental Psychology: Learning, Memory, and Cognition, 25, p. 423. Copyright 1999 by<br />
the American Psychological Association.<br />
Psychol Bull. Author manuscript; available in PMC 2006 February 24.