Learning to grade short answer questions using semantic similarity ...
Learning to grade short answer questions using semantic similarity ...
Learning to grade short answer questions using semantic similarity ...

Create successful ePaper yourself
Turn your PDF publications into a flip-book with our unique Google optimized e-Paper software.
tire feature vec<strong>to</strong>r ψ(A i ,A s ) contains a <strong>to</strong>tal of 30<br />
features.<br />
An input pair (A i ,A s ) is then associated with a<br />
<strong>grade</strong> g(A i ,A s ) = u T ψ(A i ,A s ) computed as a linear<br />
combination of features. The weight vec<strong>to</strong>r u is<br />
trained <strong>to</strong> optimize performance in two scenarios:<br />
Regression: An SVM model for regression (SVR)<br />
is trained <strong>using</strong> as target function the <strong>grade</strong>s assigned<br />
by the instruc<strong>to</strong>rs. We use the libSVM 7 implementation<br />
of SVR, with tuned parameters.<br />
Ranking: An SVM model for ranking (SVMRank)<br />
is trained <strong>using</strong> as ranking pairs all pairs of student<br />
<strong>answer</strong>s (A s ,A t ) such that <strong>grade</strong>(A i ,A s ) ><br />
<strong>grade</strong>(A i ,A t ), where A i is the corresponding instruc<strong>to</strong>r<br />
<strong>answer</strong>. We use the SVMLight 8 implementation<br />
of SVMRank with tuned parameters.<br />
In both cases, the parameters are tuned <strong>using</strong> a<br />
grid-search. At each grid point, the training data is<br />
partitioned in<strong>to</strong> 5 folds which are used <strong>to</strong> train a temporary<br />
SVM model with the given parameters. The<br />
regression passage selects the grid point with the<br />
minimal mean square error (MSE), and the SVM-<br />
Rank package tries <strong>to</strong> minimize the number of discordant<br />
pairs. The parameters found are then used <strong>to</strong><br />
score the test set – a set not used in the grid training.<br />
3.5 Iso<strong>to</strong>nic Regression<br />
Since the end result of any grading system is <strong>to</strong> give<br />
a student feedback on their <strong>answer</strong>s, we need <strong>to</strong> ensure<br />
that the system’s final score has some meaning.<br />
With this in mind, we use iso<strong>to</strong>nic regression<br />
(Zadrozny and Elkan, 2002) <strong>to</strong> convert the system<br />
scores on<strong>to</strong> the same [0..5] scale used by the annota<strong>to</strong>rs.<br />
This has the added benefit of making the<br />
system output more directly related <strong>to</strong> the annotated<br />
<strong>grade</strong>, which makes it possible <strong>to</strong> report root mean<br />
square error in addition <strong>to</strong> correlation. We train the<br />
iso<strong>to</strong>nic regression model on each type of system<br />
output (i.e., alignment scores, SVM output, BOW<br />
scores).<br />
4 Data Set<br />
To evaluate our method for <strong>short</strong> <strong>answer</strong> grading,<br />
we created a data set of <strong>questions</strong> from introduc<strong>to</strong>ry<br />
computer science assignments with <strong>answer</strong>s pro-<br />
7 http://www.csie.ntu.edu.tw/˜cjlin/libsvm/<br />
8 http://svmlight.joachims.org/<br />
vided by a class of undergraduate students. The assignments<br />
were administered as part of a Data Structures<br />
course at the University of North Texas. For<br />
each assignment, the student <strong>answer</strong>s were collected<br />
via an online learning environment.<br />
The students submitted <strong>answer</strong>s <strong>to</strong> 80 <strong>questions</strong><br />
spread across ten assignments and two examinations.<br />
9 Table 3 shows two question-<strong>answer</strong> pairs<br />
with three sample student <strong>answer</strong>s each. Thirty-one<br />
students were enrolled in the class and submitted <strong>answer</strong>s<br />
<strong>to</strong> these assignments. The data set we work<br />
with consists of a <strong>to</strong>tal of 2273 student <strong>answer</strong>s. This<br />
is less than the expected 31 × 80 = 2480 as some<br />
students did not submit <strong>answer</strong>s for a few assignments.<br />
In addition, the student <strong>answer</strong>s used <strong>to</strong> train<br />
the perceptron are removed from the pipeline after<br />
the perceptron training stage.<br />
The <strong>answer</strong>s were independently <strong>grade</strong>d by two<br />
human judges, <strong>using</strong> an integer scale from 0 (completely<br />
incorrect) <strong>to</strong> 5 (perfect <strong>answer</strong>). Both human<br />
judges were graduate students in the computer science<br />
department; one (<strong>grade</strong>r1) was the teaching assistant<br />
assigned <strong>to</strong> the Data Structures class, while<br />
the other (<strong>grade</strong>r2) is one of the authors of this paper.<br />
We treat the average <strong>grade</strong> of the two annota<strong>to</strong>rs<br />
as the gold standard against which we compare our<br />
system output.<br />
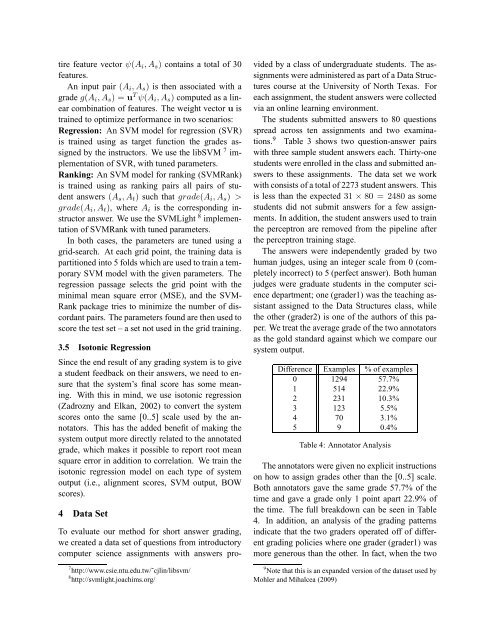
Difference Examples % of examples<br />
0 1294 57.7%<br />
1 514 22.9%<br />
2 231 10.3%<br />
3 123 5.5%<br />
4 70 3.1%<br />
5 9 0.4%<br />
Table 4: Annota<strong>to</strong>r Analysis<br />
The annota<strong>to</strong>rs were given no explicit instructions<br />
on how <strong>to</strong> assign <strong>grade</strong>s other than the [0..5] scale.<br />
Both annota<strong>to</strong>rs gave the same <strong>grade</strong> 57.7% of the<br />
time and gave a <strong>grade</strong> only 1 point apart 22.9% of<br />
the time. The full breakdown can be seen in Table<br />
4. In addition, an analysis of the grading patterns<br />
indicate that the two <strong>grade</strong>rs operated off of different<br />
grading policies where one <strong>grade</strong>r (<strong>grade</strong>r1) was<br />
more generous than the other. In fact, when the two<br />
9 Note that this is an expanded version of the dataset used by<br />
Mohler and Mihalcea (2009)