Learning to grade short answer questions using semantic similarity ...
Learning to grade short answer questions using semantic similarity ...
Learning to grade short answer questions using semantic similarity ...
You also want an ePaper? Increase the reach of your titles
YUMPU automatically turns print PDFs into web optimized ePapers that Google loves.
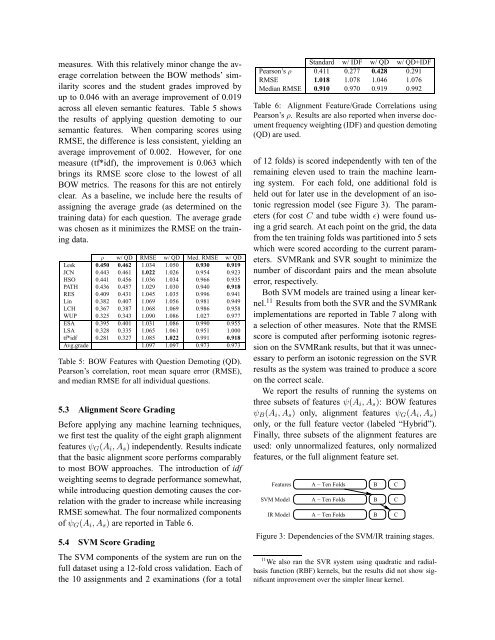
measures. With this relatively minor change the average<br />
correlation between the BOW methods’ <strong>similarity</strong><br />
scores and the student <strong>grade</strong>s improved by<br />
up <strong>to</strong> 0.046 with an average improvement of 0.019<br />
across all eleven <strong>semantic</strong> features. Table 5 shows<br />
the results of applying question demoting <strong>to</strong> our<br />
<strong>semantic</strong> features. When comparing scores <strong>using</strong><br />
RMSE, the difference is less consistent, yielding an<br />
average improvement of 0.002. However, for one<br />
measure (tf*idf), the improvement is 0.063 which<br />
brings its RMSE score close <strong>to</strong> the lowest of all<br />
BOW metrics. The reasons for this are not entirely<br />
clear. As a baseline, we include here the results of<br />
assigning the average <strong>grade</strong> (as determined on the<br />
training data) for each question. The average <strong>grade</strong><br />
was chosen as it minimizes the RMSE on the training<br />
data.<br />
ρ w/ QD RMSE w/ QD Med. RMSE w/ QD<br />
Lesk 0.450 0.462 1.034 1.050 0.930 0.919<br />
JCN 0.443 0.461 1.022 1.026 0.954 0.923<br />
HSO 0.441 0.456 1.036 1.034 0.966 0.935<br />
PATH 0.436 0.457 1.029 1.030 0.940 0.918<br />
RES 0.409 0.431 1.045 1.035 0.996 0.941<br />
Lin 0.382 0.407 1.069 1.056 0.981 0.949<br />
LCH 0.367 0.387 1.068 1.069 0.986 0.958<br />
WUP 0.325 0.343 1.090 1.086 1.027 0.977<br />
ESA 0.395 0.401 1.031 1.086 0.990 0.955<br />
LSA 0.328 0.335 1.065 1.061 0.951 1.000<br />
tf*idf 0.281 0.327 1.085 1.022 0.991 0.918<br />
Avg.<strong>grade</strong> 1.097 1.097 0.973 0.973<br />
Table 5: BOW Features with Question Demoting (QD).<br />
Pearson’s correlation, root mean square error (RMSE),<br />
and median RMSE for all individual <strong>questions</strong>.<br />
5.3 Alignment Score Grading<br />
Before applying any machine learning techniques,<br />
we first test the quality of the eight graph alignment<br />
featuresψ G (A i ,A s ) independently. Results indicate<br />
that the basic alignment score performs comparably<br />
<strong>to</strong> most BOW approaches. The introduction of idf<br />
weighting seems <strong>to</strong> de<strong>grade</strong> performance somewhat,<br />
while introducing question demoting causes the correlation<br />
with the <strong>grade</strong>r <strong>to</strong> increase while increasing<br />
RMSE somewhat. The four normalized components<br />
of ψ G (A i ,A s ) are reported in Table 6.<br />
5.4 SVM Score Grading<br />
The SVM components of the system are run on the<br />
full dataset <strong>using</strong> a 12-fold cross validation. Each of<br />
the 10 assignments and 2 examinations (for a <strong>to</strong>tal<br />
Standard w/ IDF w/ QD w/ QD+IDF<br />
Pearson’s ρ 0.411 0.277 0.428 0.291<br />
RMSE 1.018 1.078 1.046 1.076<br />
Median RMSE 0.910 0.970 0.919 0.992<br />
Table 6: Alignment Feature/Grade Correlations <strong>using</strong><br />
Pearson’s ρ. Results are also reported when inverse document<br />
frequency weighting (IDF) and question demoting<br />
(QD) are used.<br />
of 12 folds) is scored independently with ten of the<br />
remaining eleven used <strong>to</strong> train the machine learning<br />
system. For each fold, one additional fold is<br />
held out for later use in the development of an iso<strong>to</strong>nic<br />
regression model (see Figure 3). The parameters<br />
(for cost C and tube width ǫ) were found <strong>using</strong><br />
a grid search. At each point on the grid, the data<br />
from the ten training folds was partitioned in<strong>to</strong> 5 sets<br />
which were scored according <strong>to</strong> the current parameters.<br />
SVMRank and SVR sought <strong>to</strong> minimize the<br />
number of discordant pairs and the mean absolute<br />
error, respectively.<br />
Both SVM models are trained <strong>using</strong> a linear kernel.<br />
11 Results from both the SVR and the SVMRank<br />
implementations are reported in Table 7 along with<br />
a selection of other measures. Note that the RMSE<br />
score is computed after performing iso<strong>to</strong>nic regression<br />
on the SVMRank results, but that it was unnecessary<br />
<strong>to</strong> perform an iso<strong>to</strong>nic regression on the SVR<br />
results as the system was trained <strong>to</strong> produce a score<br />
on the correct scale.<br />
We report the results of running the systems on<br />
three subsets of features ψ(A i ,A s ): BOW features<br />
ψ B (A i ,A s ) only, alignment features ψ G (A i ,A s )<br />
only, or the full feature vec<strong>to</strong>r (labeled “Hybrid”).<br />
Finally, three subsets of the alignment features are<br />
used: only unnormalized features, only normalized<br />
features, or the full alignment feature set.<br />
Features<br />
SVM Model<br />
IR Model<br />
A − Ten Folds<br />
A − Ten Folds<br />
A − Ten Folds<br />
Figure 3: Dependencies of the SVM/IR training stages.<br />
11 We also ran the SVR system <strong>using</strong> quadratic and radialbasis<br />
function (RBF) kernels, but the results did not show significant<br />
improvement over the simpler linear kernel.<br />
B<br />
B<br />
B<br />
C<br />
C<br />
C


