Measurement of the Multi-TeV Gamma-Ray Flare Spectra of ...
Measurement of the Multi-TeV Gamma-Ray Flare Spectra of ...
Measurement of the Multi-TeV Gamma-Ray Flare Spectra of ...

Create successful ePaper yourself
Turn your PDF publications into a flip-book with our unique Google optimized e-Paper software.
THE ASTROPHYSICAL JOURNAL, 511:149È156, 1999 January 20<br />
( 1999. The American Astronomical Society. All rights reserved. Printed in U.S.A.<br />
MEASUREMENT OF THE MULTI-<strong>TeV</strong> GAMMA-RAY FLARE SPECTRA OF MARKARIAN 421 AND<br />
MARKARIAN 501<br />
F. KRENNRICH,1 S. D. BILLER,2 I. H. BOND,3 P. J. BOYLE,4 S. M. BRADBURY,3 A. C. BRESLIN,4 J. H. BUCKLEY,5<br />
A. M. BURDETT,3 J. BUSSONS GORDO,4 D. A. CARTER-LEWIS,1 M. CATANESE,1 M. F. CAWLEY,6 D. J. FEGAN,4<br />
J. P. FINLEY,7 J. A. GAIDOS,7 T. HALL,7 A. M. HILLAS,3 R. C. LAMB,8 R. W. LESSARD,7 C. MASTERSON,4<br />
J. E. MCENERY,9 G. MOHANTY,1,10 P. MORIARTY,11 J. QUINN,12 A. J. RODGERS,3 H. J. ROSE,3<br />
F. W. SAMUELSON,1 G. H. SEMBROSKI,6 R. SRINIVASAN,6 V. V. VASSILIEV,12 AND T. C. WEEKES12<br />
Received 1998 July 22; accepted 1998 August 27<br />
ABSTRACT<br />
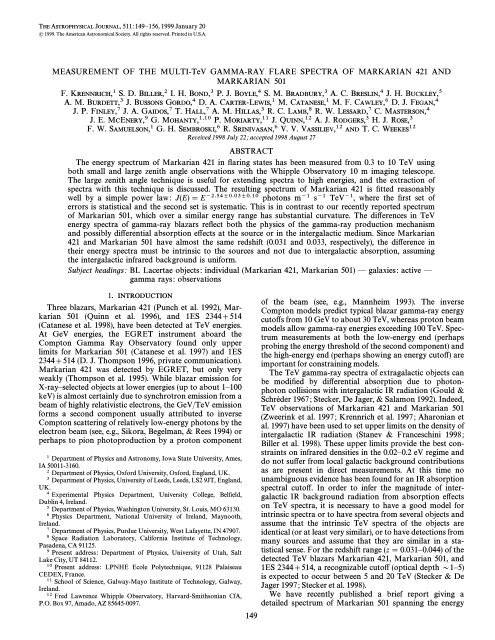
The energy spectrum <strong>of</strong> Markarian 421 in Ñaring states has been measured from 0.3 to 10 <strong>TeV</strong> using<br />
both small and large zenith angle observations with <strong>the</strong> Whipple Observatory 10 m imaging telescope.<br />
The large zenith angle technique is useful for extending spectra to high energies, and <strong>the</strong> extraction <strong>of</strong><br />
spectra with this technique is discussed. The resulting spectrum <strong>of</strong> Markarian 421 is Ðtted reasonably<br />
well by a simple power law: J(E) \ E~2.54B0.03B0.10 photons m~1 s~1 <strong>TeV</strong>~1, where <strong>the</strong> Ðrst set <strong>of</strong><br />
errors is statistical and <strong>the</strong> second set is systematic. This is in contrast to our recently reported spectrum<br />
<strong>of</strong> Markarian 501, which over a similar energy range has substantial curvature. The di†erences in <strong>TeV</strong><br />
energy spectra <strong>of</strong> gamma-ray blazars reÑect both <strong>the</strong> physics <strong>of</strong> <strong>the</strong> gamma-ray production mechanism<br />
and possibly di†erential absorption e†ects at <strong>the</strong> source or in <strong>the</strong> intergalactic medium. Since Markarian<br />
421 and Markarian 501 have almost <strong>the</strong> same redshift (0.031 and 0.033, respectively), <strong>the</strong> di†erence in<br />
<strong>the</strong>ir energy spectra must be intrinsic to <strong>the</strong> sources and not due to intergalactic absorption, assuming<br />
<strong>the</strong> intergalactic infrared background is uniform.<br />
Subject headings: BL Lacertae objects: individual (Markarian 421, Markarian 501) È galaxies: active È<br />
gamma rays: observations<br />
1. INTRODUCTION<br />
Three blazars, Markarian 421 (Punch et al. 1992), Markarian<br />
501 (Quinn et al. 1996), and 1ES 2344]514<br />
(Catanese et al. 1998), have been detected at <strong>TeV</strong> energies.<br />
At GeV energies, <strong>the</strong> EGRET instrument aboard <strong>the</strong><br />
Compton <strong>Gamma</strong> <strong>Ray</strong> Observatory found only upper<br />
limits for Markarian 501 (Catanese et al. 1997) and 1ES<br />
2344]514 (D. J. Thompson 1996, private communication).<br />
Markarian 421 was detected by EGRET, but only very<br />
weakly (Thompson et al. 1995). While blazar emission for<br />
X-rayÈselected objects at lower energies (up to about 1È100<br />
keV) is almost certainly due to synchrotron emission from a<br />
beam <strong>of</strong> highly relativistic electrons, <strong>the</strong> GeV/<strong>TeV</strong> emission<br />
forms a second component usually attributed to inverse<br />
Compton scattering <strong>of</strong> relatively low-energy photons by <strong>the</strong><br />
electron beam (see, e.g., Sikora, Begelman, & Rees 1994) or<br />
perhaps to pion photoproduction by a proton component<br />
1 Department <strong>of</strong> Physics and Astronomy, Iowa State University, Ames,<br />
IA 50011-3160.<br />
2 Department <strong>of</strong> Physics, Oxford University, Oxford, England, UK.<br />
3 Department <strong>of</strong> Physics, University <strong>of</strong> Leeds, Leeds, LS2 9JT, England,<br />
UK.<br />
4 Experimental Physics Department, University College, BelÐeld,<br />
Dublin 4, Ireland.<br />
5 Department <strong>of</strong> Physics, Washington University, St. Louis, MO 63130.<br />
6 Physics Department, National University <strong>of</strong> Ireland, Maynooth,<br />
Ireland.<br />
7 Department <strong>of</strong> Physics, Purdue University, West Lafayette, IN 47907.<br />
8 Space Radiation Laboratory, California Institute <strong>of</strong> Technology,<br />
Pasadena, CA 91125.<br />
9 Present address: Department <strong>of</strong> Physics, University <strong>of</strong> Utah, Salt<br />
Lake City, UT 84112.<br />
10 Present address: LPNHE Ecole Polytechnique, 91128 Palaiseau<br />
CEDEX, France.<br />
11 School <strong>of</strong> Science, Galway-Mayo Institute <strong>of</strong> Technology, Galway,<br />
Ireland.<br />
12 Fred Lawrence Whipple Observatory, Harvard-Smithsonian CfA,<br />
P.O. Box 97, Amado, AZ 85645-0097.<br />
149<br />
<strong>of</strong> <strong>the</strong> beam (see, e.g., Mannheim 1993). The inverse<br />
Compton models predict typical blazar gamma-ray energy<br />
cuto†s from 10 GeV to about 30 <strong>TeV</strong>, whereas proton beam<br />
models allow gamma-ray energies exceeding 100 <strong>TeV</strong>. Spectrum<br />
measurements at both <strong>the</strong> low-energy end (perhaps<br />
probing <strong>the</strong> energy threshold <strong>of</strong> <strong>the</strong> second component) and<br />
<strong>the</strong> high-energy end (perhaps showing an energy cuto†) are<br />
important for constraining models.<br />
The <strong>TeV</strong> gamma-ray spectra <strong>of</strong> extragalactic objects can<br />
be modiÐed by di†erential absorption due to photonphoton<br />
collisions with intergalactic IR radiation (Gould &<br />
Schrèder 1967; Stecker, De Jager, & Salamon 1992). Indeed,<br />
<strong>TeV</strong> observations <strong>of</strong> Markarian 421 and Markarian 501<br />
(Zweerink et al. 1997; Krennrich et al. 1997; Aharonian et<br />
al. 1997) have been used to set upper limits on <strong>the</strong> density <strong>of</strong><br />
intergalactic IR radiation (Stanev & Franceschini 1998;<br />
Biller et al. 1998). These upper limits provide <strong>the</strong> best constraints<br />
on infrared densities in <strong>the</strong> 0.02È0.2 eV regime and<br />
do not su†er from local galactic background contributions<br />
as are present in direct measurements. At this time no<br />
unambiguous evidence has been found for an IR absorption<br />
spectral cuto†. In order to infer <strong>the</strong> magnitude <strong>of</strong> intergalactic<br />
IR background radiation from absorption e†ects<br />
on <strong>TeV</strong> spectra, it is necessary to have a good model for<br />
intrinsic spectra or to have spectra from several objects and<br />
assume that <strong>the</strong> intrinsic <strong>TeV</strong> spectra <strong>of</strong> <strong>the</strong> objects are<br />
identical (or at least very similar), or to have detections from<br />
many sources and assume that <strong>the</strong>y are similar in a statistical<br />
sense. For <strong>the</strong> redshift range (z \ 0.031È0.044) <strong>of</strong> <strong>the</strong><br />
detected <strong>TeV</strong> blazars Markarian 421, Markarian 501, and<br />
1ES 2344]514, a recognizable cuto† (optical depth D1È5)<br />
is expected to occur between 5 and 20 <strong>TeV</strong> (Stecker & De<br />
Jager 1997; Stecker et al. 1998).<br />
We have recently published a brief report giving a<br />
detailed spectrum <strong>of</strong> Markarian 501 spanning <strong>the</strong> energy
150 KRENNRICH ET AL. Vol. 511<br />
range 260 GeVÈ10 <strong>TeV</strong> derived from observations with <strong>the</strong><br />
Whipple Observatory gamma-ray imaging Cerenkov telescope<br />
(Samuelson et al. 1998). This spectrum was derived<br />
from observations made during ““ high ÏÏ states <strong>of</strong> <strong>the</strong> active<br />
galactic nucleus (AGN) that give good statistical precision.<br />
Markarian 501 (Quinn et al. 1998) is variable in <strong>the</strong> <strong>TeV</strong><br />
energy range showing changes on a timescale <strong>of</strong> several<br />
hours. The data were taken at both standard small zenith<br />
angles (SZA) <strong>of</strong> less than 25¡ and at large zenith angles<br />
(LZA) in <strong>the</strong> range <strong>of</strong> 55¡È60¡. The SZA observations are<br />
sensitive to relatively low energies (E \ 5 <strong>TeV</strong>), and <strong>the</strong><br />
LZA observations yield better statistics at high energies.<br />
The details <strong>of</strong> <strong>the</strong> analysis were not explained in <strong>the</strong> brief<br />
report but are given here. In particular, <strong>the</strong> characteristics<br />
<strong>of</strong> Cerenkov imaging telescopes relevant for spectral determination<br />
change substantially from SZA to LZA observations.<br />
In addition, uncertainties in <strong>the</strong> spectrum, e.g., due<br />
to corresponding uncertainties in atmospheric absorption,<br />
are also given here. Finally, we have used <strong>the</strong> Ñux from <strong>the</strong><br />
Crab Nebula (which <strong>of</strong>ten serves as a standard candle in<br />
<strong>TeV</strong> gamma-ray astronomy) to check spectra extracted<br />
from LZA observations against our standard spectrum<br />
(Hillas et al. 1999a).<br />
These recent results from Markarian 501 indicate a spectrum<br />
that is not consistent with a simple power law in which<br />
<strong>the</strong> Ñux, J, is proportional to E~c, but is more accurately<br />
described by a three-parameter curve (parabolic in a plot <strong>of</strong><br />
log J vs. log E given by J D E [ 2.22 ^ 0.04 ^ 0.05 [<br />
(0.47 ^ 0.07) log E, where <strong>the</strong> Ðrst set <strong>of</strong> errors is sta-<br />
10<br />
tistical and <strong>the</strong> second systematic and E is in <strong>TeV</strong>.<br />
(Previously published spectra <strong>of</strong> Markarian 501 covered a<br />
smaller energy span and were consistent with a simple<br />
power law; see, e.g., Bradbury et al. 1997; Aharonian et al.<br />
1997.) In principle, <strong>the</strong> curvature <strong>of</strong> <strong>the</strong> spectrum could arise<br />
ei<strong>the</strong>r from <strong>the</strong> physics <strong>of</strong> gamma-ray emission from AGN,<br />
from intrinsic absorption, or from absorption in <strong>the</strong> intergalactic<br />
medium.<br />
In addition to Markarian 501, <strong>the</strong> Whipple Observatory<br />
<strong>Gamma</strong>-<strong>Ray</strong> Collaboration has a database <strong>of</strong> both SZA<br />
and LZA data for Markarian 421. Fortuitously, <strong>the</strong>se<br />
objects have almost identical redshifts: 0.031 for Markarian<br />
421, and 0.033 for Markarian 501. Hence any di†erences in<br />
<strong>the</strong>ir <strong>TeV</strong> spectra must be intrinsic to <strong>the</strong> AGN and not due<br />
to intergalactic absorption, assuming <strong>the</strong> intergalactic IR<br />
background radiation is uniform. Like Markarian 501,<br />
Markarian 421 is also highly variable, with changes<br />
observed on a timescale as short as 15 minutes (Gaidos et al.<br />
1996). We have previously published a <strong>TeV</strong> spectrum for<br />
Markarian 421 based on a single SZA observation but with<br />
very high Ñux detection lasting only 2 hr (Zweerink et al.<br />
1997). The published spectrum was consistent with a simple<br />
power law; i.e., no curvature was required for an acceptable<br />
Ðt. However, <strong>the</strong> spectrum did not cover as large an energy<br />
range as that for Markarian 501, nor did <strong>the</strong> Markarian 421<br />
spectrum have comparable statistical precision at <strong>the</strong> highenergy<br />
end <strong>of</strong> <strong>the</strong> spectrum. Hence it was not possible to<br />
draw Ðrm conclusions from a comparison <strong>of</strong> <strong>the</strong> two<br />
spectra.<br />
Here we present a new <strong>TeV</strong> spectrum <strong>of</strong> Markarian 421<br />
based upon both SZA and LZA data taken while <strong>the</strong> AGN<br />
was in a high state <strong>of</strong> emission. The SZA data set used<br />
consists <strong>of</strong> two Ñaring detections. The Ðrst is <strong>the</strong> same 2 hr<br />
detection (average Ñux <strong>of</strong> 7.4 crab units) used to obtain <strong>the</strong><br />
previously published spectrum (Zweerink et al. 1997), but<br />
we have taken additional care in <strong>the</strong> treatment <strong>of</strong> energy<br />
threshold e†ects in order to obtain Ñux values at lower<br />
energies. The second detection (27 minutes on source) had<br />
an average Ñux <strong>of</strong> 2.8 crab units and exhibited a remarkably<br />
short rise and fall time <strong>of</strong> 15 minutes. It occurred 8 days<br />
after <strong>the</strong> Ðrst detection. The LZA observations consisted <strong>of</strong><br />
1.5 hr (1995 June) <strong>of</strong> on-source data at zenith angles <strong>of</strong><br />
55¡È60¡ with an average Ñux <strong>of</strong> 3.3 crab units. The new<br />
spectrum is consistent with our previously published result<br />
but spans a larger energy range (comparable to that<br />
published for Markarian 501) and has better statistics at<br />
high energies. The spectrum appears less curved than <strong>the</strong><br />
Markarian 501 spectrum. We show that <strong>the</strong> spectra for <strong>the</strong><br />
two equidistant AGN (Markarian 421 and Markarian 501)<br />
clearly di†er, and this reÑects intrinsic spectral di†erences<br />
near <strong>the</strong> sites <strong>of</strong> gamma-ray production. Combined with<br />
data for <strong>the</strong> two AGN at X-ray energies, <strong>the</strong>se spectra constrain<br />
models <strong>of</strong> physical processes in <strong>the</strong> jets (see Hillas et<br />
al. 1999b). The di†erences also point toward a major difficulty<br />
in inferring intergalactic background radiation intensities<br />
via <strong>TeV</strong> photon attenuation.<br />
2. OBSERVATIONS<br />
The observations presented here were made with <strong>the</strong><br />
Whipple Observatory 10 m imaging Cerenkov telescope.<br />
The camera consisted <strong>of</strong> 109 (until 1996 December 4) or 151<br />
(after 1996 December 4) photomultiplier tubes placed on a<br />
1/4¡ hexagonal matrix. These cameras covered Ðelds <strong>of</strong> view<br />
<strong>of</strong> about 2¡.7 and 3¡.2, respectively. Pulses from each <strong>of</strong> <strong>the</strong><br />
photomultiplier tubes were ampliÐed and sent to gated integrating<br />
analog-to-digital converters, and, in addition, those<br />
from <strong>the</strong> inner 91 tubes were sent to discriminators with<br />
levels corresponding to about 49 photoelectrons. When two<br />
<strong>of</strong> <strong>the</strong> discriminators Ðred, a trigger was generated and<br />
current pulses from all photomultiplier tubes were integrated<br />
for 25 ns and digitized (Cawley et al. 1990). The data<br />
were normally taken in an on-o† mode in which <strong>the</strong> source<br />
is tracked for typically 28 minutes, and <strong>the</strong>n <strong>the</strong> same range<br />
<strong>of</strong> elevation and azimuth angles is tracked for ano<strong>the</strong>r 28<br />
minutes, which gives a background comparison region. The<br />
Crab Nebula serves as a standard candle for <strong>TeV</strong> gammaray<br />
astronomy, and it was observed using <strong>the</strong> same camera<br />
conÐgurations and ranges <strong>of</strong> zenith angles that were used<br />
for <strong>the</strong> blazar observations.<br />
As described previously in Samuelson et al. (1998), <strong>the</strong><br />
Markarian 501 observations were made in <strong>the</strong> time interval<br />
from 1997 February 14 to 1997 June 8 during a high state <strong>of</strong><br />
<strong>the</strong> source in 1997 (Pro<strong>the</strong>roe et al. 1998). During this<br />
period <strong>the</strong> camera had 151 pixels, which gave <strong>the</strong> larger<br />
(3¡.2) Ðeld <strong>of</strong> view. A total <strong>of</strong> 16 hr <strong>of</strong> SZA on-source data<br />
were taken at 8¡È25¡, and 5.1 hr <strong>of</strong> LZA on-source data<br />
were taken at 55¡È60¡. These observations showed that <strong>the</strong><br />
Ñux for <strong>the</strong> 1997 observing season varied from about 0.2 to<br />
4 times <strong>the</strong> Ñux from <strong>the</strong> Crab Nebula, with an average<br />
value <strong>of</strong> 1.4 (see Quinn et al. 1998). This is a factor <strong>of</strong> 7<br />
larger than <strong>the</strong> average Ñux from <strong>the</strong> 1996 observing season,<br />
which is <strong>the</strong> basis for identifying it as Ñare data. We are<br />
somewhat arbitrarily deÐning Ñare data as that which has a<br />
Ñux level substantially above <strong>the</strong> average Ñux as measured<br />
for a given source in our observations.<br />
The SZA data for Markarian 421 consists <strong>of</strong> two detections<br />
on 1996 May 7 and 1996 May 15, measured with <strong>the</strong><br />
109 photomultiplier tube camera. The Ðrst <strong>of</strong> <strong>the</strong>se was<br />
during <strong>the</strong> highest Ñux <strong>TeV</strong> Ñare observed. It consisted <strong>of</strong> a
No. 1, 1999 TEV FLARE SPECTRA 151<br />
2 hr observation in which <strong>the</strong> data rate increased steadily,<br />
giving a count rate at <strong>the</strong> end <strong>of</strong> <strong>the</strong> run <strong>of</strong> about 15<br />
gammas minute~1 at E [ 350 GeV, which is 10 times <strong>the</strong><br />
rate from <strong>the</strong> Crab Nebula. The average rate during <strong>the</strong><br />
runs was 7.4 Crab units. During <strong>the</strong> Ñare <strong>the</strong> AGN was<br />
observed continuously, and hence background comparison<br />
regions were taken from <strong>the</strong> same range <strong>of</strong> elevation and<br />
azimuth angles but from o<strong>the</strong>r nights; however, because <strong>of</strong><br />
<strong>the</strong> strength <strong>of</strong> <strong>the</strong> signal, <strong>the</strong> data are almost free <strong>of</strong> background<br />
after selection <strong>of</strong> gamma-rayÈlike images. The<br />
results are insensitive to <strong>the</strong> exact background runs used<br />
(Zweerink et al. 1997; Zweerink 1997). The second detection<br />
8 days later consisted <strong>of</strong> 27 minutes <strong>of</strong> on-source observations<br />
with corresponding o†-source data. The average<br />
Ñux was 2.8 crab units, and <strong>the</strong> data show a remarkable<br />
peak with a rise and fall time <strong>of</strong> only 15 minutes. The Crab<br />
Nebula database was measured with <strong>the</strong> same camera<br />
during <strong>the</strong> 1995È1996 season and consists <strong>of</strong> 49 on/o† pairs<br />
giving <strong>the</strong> Crab Nebula spectrum reported by Hillas et al.<br />
(1999a).<br />
Observations <strong>of</strong> Markarian 421 at LZA were carried out<br />
in 1995 with <strong>the</strong> 109 pixel camera (Krennrich et al. 1995),<br />
and <strong>the</strong> detection <strong>of</strong> 5È8 <strong>TeV</strong> gamma rays was reported<br />
earlier (Krennrich et al. 1997). For <strong>the</strong> spectral analysis presented<br />
here, we used a subset <strong>of</strong> <strong>the</strong> data for which <strong>the</strong> range<br />
<strong>of</strong> zenith angles is 55¡È60¡, where we have adequate observations<br />
<strong>of</strong> <strong>the</strong> Crab Nebula to obtain a spectrum. This<br />
allows us to use <strong>the</strong> Crab Nebula to test <strong>the</strong> LZA analysis<br />
procedure and show that it is consistent with spectra<br />
derived at SZA. In addition, we required that Markarian<br />
421 was in a Ñare state, which gave a total <strong>of</strong> three on-o†<br />
pairs <strong>of</strong> data measured on 1995 June 20, 29, and 30, with an<br />
average Ñux from <strong>the</strong> AGN <strong>of</strong> 3.3 crab units, comparable to<br />
that <strong>of</strong> <strong>the</strong> 1996 May 15 Ñare (an average <strong>of</strong> 2.8 crab units).<br />
Data from observations <strong>of</strong> <strong>the</strong> Crab Nebula at zenith<br />
angles between 55¡ and 60¡ were collected during 1995,<br />
1996, and 1997 using both <strong>the</strong> 109 and 151 pixel cameras. A<br />
total <strong>of</strong> 17 on-o† pairs (8 hr on source) were used for <strong>the</strong><br />
derivation <strong>of</strong> <strong>the</strong> energy spectrum <strong>of</strong> <strong>the</strong> Crab Nebula. The<br />
spectra derived from <strong>the</strong> two cameras were in agreement.<br />
3. EXTRACTION OF SPECTRA FROM SZA AND LZA DATA<br />
For gamma rays with energies <strong>of</strong> a few hundred GeV<br />
incident near <strong>the</strong> zenith, shower maximum occurs at about<br />
7È9 km above sea level.13 The Cerenkov light from such a<br />
shower forms a pool <strong>of</strong> light about 200 m in diameter at<br />
telescope altitude, 2.3 km for <strong>the</strong> Whipple Observatory. At<br />
large zenith angles, shower maximum occurs far<strong>the</strong>r away<br />
from <strong>the</strong> telescope, which increases <strong>the</strong> area over which <strong>the</strong><br />
Cerenkov light is distributed. The lower light density raises<br />
<strong>the</strong> telescope energy threshold, but for gamma rays with<br />
sufficient energy to produce enough light for triggering <strong>the</strong><br />
collection area is substantially larger (Sommers & Elbert<br />
1987). Since shower maximum occurs at a high altitude for<br />
LZA showers, <strong>the</strong> characteristic Cerenkov angles are<br />
smaller, resulting in a smaller Cerenkov light image nearer<br />
<strong>the</strong> center <strong>of</strong> <strong>the</strong> Ðeld <strong>of</strong> view <strong>of</strong> <strong>the</strong> camera. In this work<br />
we followed an established Whipple procedure in extracting<br />
spectra, speciÐcally Method I as described in detail in<br />
Mohanty et al. (1998). The following parts are required: (1)<br />
13 Shower maximum is <strong>the</strong> region along <strong>the</strong> longitudinal development<br />
<strong>of</strong> <strong>the</strong> electromagnetic cascade with <strong>the</strong> maximum number <strong>of</strong> electrons and<br />
positrons.<br />
a method for selecting gamma-rayÈinitiated shower images<br />
from a background <strong>of</strong> cosmic-rayÈinitiated shower images<br />
based upon image shape and orientation; (2) <strong>the</strong> e†ective<br />
telescope collection area for this selection method; (3) a<br />
method to estimate <strong>the</strong> initial gamma-ray energy for each<br />
event; and (4) <strong>the</strong> resolution function corresponding to this<br />
energy estimate. The method for selecting gamma-ray<br />
events should be relatively independent <strong>of</strong> <strong>the</strong> gamma-ray<br />
energy, E. The method <strong>of</strong> energy estimation should give<br />
good resolution and be relatively free <strong>of</strong> bias. These parts<br />
are described in <strong>the</strong> next two sections, and in <strong>the</strong> last subsection<br />
we show that spectra derived from Crab Nebula<br />
LZA observations agree with our standard SZA results<br />
published earlier.<br />
3.1. Energy T hreshold, Selection Criteria, and<br />
Collection Area<br />
The Cerenkov imaging technique utilizes di†erences in<br />
focal plane image shapes to di†erentiate cosmic-ray background<br />
from gamma rays. The selection criteria (Mohanty<br />
et al. 1998) are based on image shape through <strong>the</strong> width and<br />
length parameters and on orientation through <strong>the</strong> alpha<br />
parameter. Compared with cosmic-ray images, gamma-ray<br />
images are generally narrower and shorter and point<br />
toward <strong>the</strong> center <strong>of</strong> <strong>the</strong> focal plane (see, e.g., Hillas 1985;<br />
Reynolds et al. 1993). The e†ective collection area <strong>of</strong> an<br />
imaging atmospheric Cerenkov telescope is limited not only<br />
by <strong>the</strong> dimension <strong>of</strong> <strong>the</strong> Cerenkov light pool on <strong>the</strong> ground<br />
but also by <strong>the</strong> image parameter cuts that are applied to<br />
increase <strong>the</strong> signal-to-noise ratio. The criteria are derived<br />
from <strong>the</strong> parameter distributions <strong>of</strong> simulated gamma-ray<br />
showers as a function <strong>of</strong> <strong>the</strong>ir total light intensity (““ size ÏÏ<br />
hereafter) in <strong>the</strong> photomultiplier camera. We set <strong>the</strong>se criteria<br />
so that <strong>the</strong>y keep 90% <strong>of</strong> gamma-ray images whose<br />
centroid is 0¡.5È1¡.1 (distance) from <strong>the</strong> center <strong>of</strong> <strong>the</strong> Ðeld <strong>of</strong><br />
view for <strong>the</strong> 151 pixel camera. This distance restriction<br />
improves <strong>the</strong> correlation <strong>of</strong> energy with size. The cuts are<br />
scaled with size so that <strong>the</strong> efficiency for keeping gamma<br />
rays is approximately independent <strong>of</strong> energy.<br />
The telescope is triggered when two <strong>of</strong> <strong>the</strong> inner 91 photomultiplier<br />
tubes give pulses within a triggering gate <strong>of</strong> 30<br />
ns with 49 or more photoelectrons. The trigger electronics<br />
(Cawley et al. 1990) is difficult to model precisely. One <strong>of</strong> <strong>the</strong><br />
problems is that <strong>the</strong> photomultiplier tube pulses include<br />
both Cerenkov light ““ signal ÏÏ and Poisson-Ñuctuating<br />
night-sky noise ““ background, ÏÏ which causes <strong>the</strong> pulse<br />
shapes to vary. The pulses go both to a discriminator that<br />
Ðres when <strong>the</strong> pulse voltage crosses a preset threshold and<br />
to an integrating analog-to-digital converter that records<br />
<strong>the</strong> total charge, q, in <strong>the</strong> pulse (see Mohanty 1995). Because<br />
<strong>of</strong> <strong>the</strong> variation in pulse shape, <strong>the</strong>re is no unique correspondence<br />
between pulse charge and peak voltage, e†ectively<br />
giving <strong>the</strong> discriminators a ““ fuzzy ÏÏ edge having a<br />
width corresponding to 3.5 photoelectrons about a mean<br />
trigger point <strong>of</strong> 49 photoelectrons. In addition, if <strong>the</strong> discriminator<br />
levels are set very low, <strong>the</strong> background trigger<br />
rate for low-light events can be sensitive to night-sky brightness.<br />
We avoid <strong>the</strong>se difficulties using s<strong>of</strong>tware padding<br />
(Cawley 1993) and by adding <strong>the</strong> additional s<strong>of</strong>tware<br />
requirement that a signal corresponding to at least D \<br />
80 photoelectrons is present in at least two pixels. s<strong>of</strong>t<br />
This<br />
raises <strong>the</strong> telescope energy threshold, but <strong>the</strong> collection area<br />
can be readily calculated.
152 KRENNRICH ET AL. Vol. 511<br />
The resulting SZA (20¡) and LZA (55¡È60¡) telescope<br />
areas for events that pass both <strong>the</strong> triggering and image<br />
selection requirements are shown in Figure 1 for <strong>the</strong> 151<br />
pixel camera. It is clear that only SZA measurements have<br />
sensitivity below 1 <strong>TeV</strong>, whereas <strong>the</strong> LZA measurements<br />
have better sensitivity beyond about 5 <strong>TeV</strong>. The LZA collection<br />
area shows a plateau between about 3 and 50 <strong>TeV</strong>.<br />
There is an SZA/LZA overlap region for cross calibration<br />
between about 1 and 10 <strong>TeV</strong>.<br />
One concern is that we have properly extracted SZA<br />
spectra at all but <strong>the</strong> lowest energy point in Figure 1. The<br />
points at 260 and 380 GeV have signiÐcantly reduced collection<br />
area and hence might be unusually sensitive to small<br />
details in <strong>the</strong> simulations. We have looked for such sensitivities<br />
by varying (1) <strong>the</strong> telescope gain, (2) reÑector optical<br />
resolution, and (3) background sky noise used in <strong>the</strong> simulations.<br />
The result is that nei<strong>the</strong>r <strong>the</strong> calculated collection<br />
area nor <strong>the</strong> extracted spectra change signiÐcantly if <strong>the</strong>se<br />
parameters are varied over physically reasonable values.<br />
(Indeed, this is a basis for arriving at systematic errors.)<br />
Fur<strong>the</strong>rmore, <strong>the</strong> gamma-ray image parameter distributions<br />
extracted using on-o† histograms (see Mohanty et al.<br />
1998) agree with simulations. Thus <strong>the</strong> results appear to be<br />
robust.<br />
3.2. Energy Estimation and Resolution<br />
The accuracy <strong>of</strong> <strong>the</strong> energy reconstruction <strong>of</strong> gamma-ray<br />
primaries with a single imaging Cerenkov telescope is<br />
limited by <strong>the</strong> following e†ects: (1) Ñuctuations in <strong>the</strong> Ðrst<br />
interactions that cause <strong>the</strong> height <strong>of</strong> shower maximum to<br />
vary (hence <strong>the</strong> region where most <strong>of</strong> <strong>the</strong> Cerenkov light is<br />
emitted varies, causing Ñuctuations in <strong>the</strong> light density<br />
detected at ground), (2) <strong>the</strong> uncertainty in <strong>the</strong> shower core<br />
distance to <strong>the</strong> telescope, and (3) truncation <strong>of</strong> <strong>the</strong> shower<br />
images close to <strong>the</strong> edge <strong>of</strong> <strong>the</strong> Ðeld <strong>of</strong> view.<br />
All three e†ects occur in a similar fashion for SZA and<br />
LZA observations; however, <strong>the</strong>re are some di†erences: <strong>the</strong><br />
central light emitting region for a LZA shower appears geometrically<br />
smaller in <strong>the</strong> camera because <strong>of</strong> its larger distance<br />
from <strong>the</strong> instrument and <strong>the</strong> smaller Cerenkov angles<br />
in <strong>the</strong> lower density atmosphere. Hence a bigger fraction <strong>of</strong><br />
<strong>the</strong> Cerenkov light image is contained in <strong>the</strong> Ðeld <strong>of</strong> view.<br />
FIG. 1.ÈCollection areas for two di†erent zenith angle ranges: 55¡È60¡<br />
(stars) and 20¡ (crosses) for <strong>the</strong> 151 pixel camera <strong>of</strong> <strong>the</strong> Whipple telescope in<br />
1997. It should be noted that <strong>the</strong> 151 pixel camera has increased <strong>the</strong><br />
collection area at 20¡ relative to <strong>the</strong> older 109 pixel camera because <strong>of</strong> its<br />
larger Ðeld <strong>of</strong> view.<br />
Also, <strong>the</strong> smaller Cerenkov angles for LZA observations<br />
shift <strong>the</strong> center <strong>of</strong> gravity <strong>of</strong> images closer to <strong>the</strong> center <strong>of</strong><br />
<strong>the</strong> Ðeld <strong>of</strong> view. Therefore, truncation e†ects are less important<br />
for LZA data.<br />
Following Mohanty et al. (1998) we have found expressions<br />
for an energy estimate, E3 , as a function <strong>of</strong> ln (size) and<br />
distance, which are relatively free <strong>of</strong> bias and have good<br />
resolution. To a good approximation, for Ðxed energy E <strong>the</strong><br />
distribution E3 is lognormal (see Mohanty et al. 1998) with a<br />
width independent <strong>of</strong> E. It follows that <strong>the</strong> telescope<br />
resolution *E in standard deviations is given by *E/E \ p,<br />
where p is about 0.34 for SZA, and slightly better, about<br />
0.29, for LZA.<br />
3.3. Atmospheric E†ects<br />
Since Cerenkov light from showers at LZA passes<br />
through substantially more atmosphere than at SZA, <strong>the</strong><br />
uncertainties in <strong>the</strong> atmospheric model may have correspondingly<br />
larger e†ects. There are four important extinction<br />
mechanisms:<br />
1. The largest e†ect is <strong>Ray</strong>leigh scattering, for which <strong>the</strong><br />
cross sections are well known. Variations arise because <strong>of</strong><br />
changes in barometric pressure (typically a few percent)<br />
changing <strong>the</strong> column density along <strong>the</strong> line <strong>of</strong> sight from <strong>the</strong><br />
telescope to shower maximum.<br />
2. Ozone exists mainly at altitudes well above shower<br />
maximum, but <strong>the</strong> cross sections for UV absorption are<br />
very large and small concentrations extend into lower<br />
regions, which causes some absorption. Seasonal variations<br />
are <strong>of</strong> order 20%È25% at <strong>the</strong> Whipple Observatory latitude,<br />
and <strong>the</strong>re are daily variations as well.<br />
3. Absorption by O becomes important below about<br />
2<br />
250 nm and removes almost all <strong>the</strong> light at shorter wavelengths.<br />
There are signiÐcant uncertainties in <strong>the</strong> absorption<br />
cross sections, but <strong>the</strong>se uncertainties do not have a large<br />
e†ect because <strong>the</strong> absorption turns on rapidly, and in any<br />
case essentially all <strong>the</strong> light below 250 nm is absorbed.<br />
4. Aerosols exist mainly at low altitudes with a scale<br />
height <strong>of</strong> roughly 1 km, and hence <strong>the</strong> observatory altitude<br />
<strong>of</strong> 2.3 km diminishes <strong>the</strong>ir e†ects. One <strong>of</strong> <strong>the</strong>ir primary<br />
characteristics is variability. If aerosol absorption were signiÐcant,<br />
one would expect signiÐcant variability in <strong>the</strong> telescope<br />
cosmic-rayÈinduced trigger rate, whereas this is<br />
usually stable to a few percent.<br />
In order to estimate <strong>the</strong> e†ects <strong>of</strong> atmospheric uncertainties,<br />
we made some simple calculations using <strong>the</strong> atmospheric<br />
model used for <strong>the</strong> ARTEMIS project (Urban et al.<br />
1996) and a simple aerosol parameterization used for <strong>the</strong><br />
FlyÏs Eye experiment (Baltrusaitis et al. 1985). Assuming a<br />
Cerenkov light spectrum with wavelength-dependent<br />
mirror reÑectivity and photocathode quantum efficiency<br />
folded in, <strong>the</strong> transmission for light from shower maximum<br />
(for 5 <strong>TeV</strong> gamma rays) to <strong>the</strong> telescope was calculated<br />
under various assumptions. The altitude <strong>of</strong> shower<br />
maximum for showers initiated by gamma rays at <strong>the</strong> zenith<br />
is 9 and 10 km for gamma-ray incidents at zenith angles <strong>of</strong><br />
60¡. The results are given in Table 1. As can be seen from<br />
<strong>the</strong> table, atmospheric transmission from shower maximum<br />
at 60¡ is 78% <strong>of</strong> that at <strong>the</strong> zenith; however, changes in<br />
transmission due to fairly large increases in various extinction<br />
mechanisms is on <strong>the</strong> order <strong>of</strong> a few percent. This is<br />
small compared with <strong>the</strong> overall uncertainties in telescope<br />
gain <strong>of</strong> about 15% (Mohanty et al. 1998).
No. 1, 1999 TEV FLARE SPECTRA 153<br />
TABLE 1<br />
RELATIVE ATMOSPHERIC TRANSMISSION AT SZA AND LZA<br />
TRANSMISSION<br />
RAYLEIGH AEROSOL O 2<br />
OZONE z \ 0¡ z \ 60¡<br />
(1) (2) (3) (4) (5) (6)<br />
1.......... 1 1 1 1.0 0.78<br />
1.03 ...... 1 1 1 0.99 0.77<br />
1.......... 4 1 1 0.96 0.73<br />
1.......... 1 4 1 0.98 0.76<br />
1.......... 1 1 4 0.93 0.74<br />
NOTE.ÈRow (1) corresponds to standard atmospheric conditions;<br />
row (2) has <strong>the</strong> <strong>Ray</strong>leigh scattering column density increased<br />
by 3% (due to barometric pressure changes); row (3) has <strong>the</strong> aerosol<br />
concentration increased by a factor <strong>of</strong> 4; row (4) has <strong>the</strong> O cross 2<br />
sections increased by a factor <strong>of</strong> 4; and row (5) has <strong>the</strong> ozone concentration<br />
increased by a factor <strong>of</strong> 4.<br />
3.4. T he Crab Nebula Spectrum from L ZA Data<br />
As a check on extraction <strong>of</strong> spectra from LZA observations,<br />
we have analyzed existing data for <strong>the</strong> Crab Nebula<br />
(1995È1997 with <strong>the</strong> 109 and <strong>the</strong> 151 pixel camera). In <strong>the</strong><br />
angular range <strong>of</strong> 55¡È60¡, this consists <strong>of</strong> 8 hr <strong>of</strong> on-source<br />
data with corresponding o†-source runs. When analyzed as<br />
described above, <strong>the</strong> resulting spectrum is shown in Figure<br />
2. Also shown in <strong>the</strong> Ðgure is <strong>the</strong> standard spectrum as<br />
given in Hillas et al. (1999a), which was derived using SZA<br />
observations. It is apparent that <strong>the</strong> two agree over <strong>the</strong><br />
common energy range <strong>of</strong> about 1.1È10 <strong>TeV</strong>. A power-law Ðt<br />
to LZA data yields J(E) \ 3.78 ] 10~7E~2.59B0.15B0.15<br />
photons m~2 s~1 <strong>TeV</strong>~1. The Ðrst set <strong>of</strong> uncertainties are<br />
statistical and <strong>the</strong> second are systematic and were calculated<br />
as in Mohanty et al. (1998). Based on <strong>the</strong> crab analysis<br />
and on our simulations <strong>of</strong> <strong>the</strong> e†ect <strong>of</strong> variations in <strong>the</strong><br />
atmospheric model, we are conÐdent about <strong>the</strong> SZA and <strong>the</strong><br />
LZA energy estimate.<br />
4. MARKARIAN 421 SPECTRUM<br />
We have reanalyzed <strong>the</strong> SZA Ñare data <strong>of</strong> 1996 May 7 by<br />
using a more careful treatment <strong>of</strong> <strong>the</strong> telescope threshold<br />
region. The new spectrum is consistent with our previously<br />
published result but now includes two lower energy points<br />
extending down to 260 GeV instead <strong>of</strong> 560 GeV. The SZA<br />
Ñare data <strong>of</strong> 1996 May 15 were analyzed in exactly <strong>the</strong> same<br />
way. As pointed out previously, <strong>the</strong> threshold region is difficult<br />
to model, and to avoid it in <strong>the</strong> previous analysis we<br />
imposed a secondary s<strong>of</strong>tware trigger level by requiring that<br />
two <strong>of</strong> <strong>the</strong> triggering tubes have signals corresponding to at<br />
least 50 photoelectrons (D \ 49) and that <strong>the</strong> size was at<br />
least 400 photoelectrons. s<strong>of</strong>t<br />
In <strong>the</strong> present analysis, we impose no direct limitation on<br />
<strong>the</strong> signal size but instead require that D \ 80 . This also<br />
avoids <strong>the</strong> troublesome region, but with s<strong>of</strong>t<br />
less cost in energy<br />
threshold. We have studied <strong>the</strong> e†ect on varying D and<br />
found that <strong>the</strong> Ñux values in <strong>the</strong> spectrum are stable above s<strong>of</strong>t<br />
a<br />
value <strong>of</strong> about 70. As D is increased above 100, <strong>the</strong> Ñux<br />
s<strong>of</strong>t<br />
values do not change within statistical errors, but <strong>the</strong>se<br />
errors become signiÐcantly larger. We have also investigated<br />
ano<strong>the</strong>r trigger conÐguration in which at least three<br />
tubes were required to have D greater than 80. This again<br />
s<strong>of</strong>t<br />
led to <strong>the</strong> same Ñux values within errors.<br />
Finally, we reanalyzed <strong>the</strong> 1994/1995 Crab database and<br />
found that it is well Ðt over <strong>the</strong> energy range 0.3È10 <strong>TeV</strong><br />
with a simple power-law consistent with <strong>the</strong> previous result<br />
given by Hillas et al. (1999a).<br />
The spectral Ñux values derived from <strong>the</strong> intense Ñare <strong>of</strong><br />
Markarian 421 at SZA are shown as stars in Figure 3. The<br />
FIG. 2.ÈEnergy spectrum <strong>of</strong> <strong>the</strong> Crab Nebula derived from LZA observations<br />
(circles) in comparison with <strong>the</strong> energy spectrum derived from SZA<br />
(stars) data (Hillas et al. 1999a). The spectral Ðts to <strong>the</strong> two data sets with a<br />
power law are consistent and are indicated by <strong>the</strong> solid and dashed lines.<br />
FIG. 3.ÈEnergy spectra <strong>of</strong> Markarian 421 from <strong>the</strong> data <strong>of</strong> <strong>the</strong> big Ñare<br />
on 1996 May 7 (stars) and a short Ñare on 1996 May 15 (squares), and LZA<br />
data from Ñaring states in 1995 (circles). The Ñux <strong>of</strong> <strong>the</strong> LZA data has been<br />
presented as 0.2 <strong>of</strong> <strong>the</strong> absolute Ñux.
154 KRENNRICH ET AL. Vol. 511<br />
FIG. 4.ÈEnergy spectrum <strong>of</strong> Markarian 421 combining <strong>the</strong> data from<br />
<strong>the</strong> big Ñare on 1996 May 7 (stars), <strong>the</strong> short Ñare on 1996 May 15<br />
(squares), and a Ñaring state in 1995 (circles) at LZA. The absolute Ñuxes <strong>of</strong><br />
<strong>the</strong> LZA data and <strong>the</strong> SZA data from 1996 May 15 have been normalized<br />
to <strong>the</strong> big Ñare data.<br />
FIG. 6.ÈEnergy spectrum <strong>of</strong> Markarian 501 using 15 hr <strong>of</strong> SZA data<br />
(stars) and5hr<strong>of</strong>LZA(circles) data. For this plot <strong>the</strong> absolute Ñux <strong>of</strong> <strong>the</strong><br />
LZA data has been normalized to <strong>the</strong> SZA data. Both a simple power law<br />
(solid line) and a curved Ðt (dashed line) are shown in <strong>the</strong> Ðgure.<br />
data are Ðtted by J(E) \ 2.2 ] 10~6E~2.54B0.04B0.1<br />
photons m~2 s~1 <strong>TeV</strong>~1, which gives a s2 <strong>of</strong> 22.8 for 8 d.o.f.<br />
(probability 0.005). This Ðt is marginal, perhaps indicating<br />
some curvature. The 1996 May 15 data are shown in <strong>the</strong><br />
same Ðgure as boxes and are Ðt by J(E) \<br />
1.0 ] 10~6E~2.45B0.10B0.1 photons m~2 s~1 <strong>TeV</strong>~1, which<br />
gives a s2 <strong>of</strong> 3.2 for 7 d.o.f. The LZA energy spectrum covers<br />
1.5È10.4 <strong>TeV</strong> and is shown as open circles in <strong>the</strong> same<br />
Ðgure. The LZA points can be Ðtted by a power law <strong>of</strong> <strong>the</strong><br />
form J(E) \ 7.53 ] 10~7E~2.52B0.18B0.15 photons m~2<br />
s~1 <strong>TeV</strong>~1, which gives a s2 <strong>of</strong> 4.9 for 4 d.o.f.<br />
Since all <strong>the</strong> spectral shapes are consistent we combine<br />
<strong>the</strong>m in order to reduce <strong>the</strong> statistical uncertainties. In combining<br />
<strong>the</strong> two SZA data sets and <strong>the</strong> LZA data shown in<br />
Figure 4, <strong>the</strong> normalizations <strong>of</strong> <strong>the</strong> 1996 May 15 SZA data<br />
and <strong>the</strong> LZA were treated as free parameters, thus Ðxing <strong>the</strong><br />
absolute normalization to <strong>the</strong> 1996 May 7 Ñare. The<br />
resulting Ðt is J(E) P E~2.54B0.03B0.10 photons m~2 s~1<br />
<strong>TeV</strong>~1, which gives a s2 <strong>of</strong> 31.5 for 21 d.o.f. and a chance<br />
probability <strong>of</strong> 0.07. Thus <strong>the</strong> energy spectrum <strong>of</strong> Markarian<br />
421 between 260 GeV and 10 <strong>TeV</strong> during Ñaring activity is<br />
consistent with a single power law. A curved Ðt for Markarian<br />
421 yields<br />
J(E) \ (2.4 ^ 0.1 ^ 0.3)<br />
A ] 10~6 E B~2.47B0.04B0.05~(0.28B0.09) log10 (E)<br />
1<strong>TeV</strong><br />
photons m~2 s~1 <strong>TeV</strong>~1, with a s2 value <strong>of</strong> 21.5 for 20<br />
d.o.f., which gives a chance probability <strong>of</strong> 0.4.<br />
FIG. 5.ÈEnergy spectrum <strong>of</strong> Markarian 501 (LZA data only) in comparison<br />
to <strong>the</strong> spectrum <strong>of</strong> <strong>the</strong> Crab Nebula derived with <strong>the</strong> same method.<br />
A power-law Ðt to <strong>the</strong> Markarian 501 data gives a s2\14.7 for 5 d.o.f.<br />
(probability <strong>of</strong> 0.015).<br />
5. MARKARIAN 501 SPECTRUM<br />
The Markarian 501 spectrum was analyzed in a similar<br />
way. The results for <strong>the</strong> 5.1 hr <strong>of</strong> LZA observations are<br />
shown toge<strong>the</strong>r with <strong>the</strong> LZA spectrum for <strong>the</strong> Crab
No. 1, 1999 TEV FLARE SPECTRA 155<br />
Nebula in Figure 5. The Ñux level <strong>of</strong> Markarian 501 was on<br />
average B2 crab units during <strong>the</strong>se observations, and <strong>the</strong><br />
spectral slope is similar to that for <strong>the</strong> Crab spectrum. The<br />
spectrum extends up to 10 <strong>TeV</strong> and can be Ðtted between<br />
1.1 and 10.4 <strong>TeV</strong> with a power law yielding s2\14.7 for 5<br />
d.o.f. (chance probability <strong>of</strong> 0.015): J(E) \<br />
7.53 ] 10~7E~2.67B0.09B0.15 photons m~2 s~1 <strong>TeV</strong>~1.<br />
The errors on <strong>the</strong> spectral index are given by a statistical<br />
uncertainty <strong>of</strong> ^0.09, and a systematic uncertainty <strong>of</strong><br />
^0.15. The slightly high value <strong>of</strong> s2 hints at curvature in <strong>the</strong><br />
spectrum.<br />
The LZA data (5.1 hr) can be combined with <strong>the</strong> SZA<br />
data (15 hr), treating <strong>the</strong> normalization <strong>of</strong> <strong>the</strong> former<br />
as a free parameter as described in <strong>the</strong> last section. This<br />
yields <strong>the</strong> spectrum given previously in Samuelson et al.<br />
(1998), which is shown in Figure 6. Fitting this data with<br />
a simple power law, J(E) \ 6.9 ] 10~7E~2.41B0.025<br />
photons m~2 s~1 <strong>TeV</strong>~1, which gives s2\59.7 for<br />
15 d.o.f. with a chance probability <strong>of</strong> 2.5 ] 10~7.<br />
Including a curvature term yields J(E) \ (8.6 ^ 0.3 ^ 0.7)<br />
] 10~7E~2.22B0.04B0.05~(0.47B0.07) log10 (E) photons m~2<br />
s~1 <strong>TeV</strong>~1, which gives s2\18 for 14 d.o.f. with a chance<br />
probability <strong>of</strong> 0.2. As shown in Figure 6, <strong>the</strong> Markarian 501<br />
spectrum is clearly curved. <strong>Spectra</strong>l variability is not likely<br />
to account for <strong>the</strong> curvature; <strong>the</strong> superposition <strong>of</strong> two different<br />
power laws would result in a concave spectrum ra<strong>the</strong>r<br />
than a convex shape.<br />
6. DISCUSSION: MARKARIAN 421 VERSUS<br />
MARKARIAN 501<br />
The spectra derived from LZA and SZA data for Markarian<br />
421 and Markarian 501 are shown in Figure 7. It is<br />
apparent from <strong>the</strong> Ðgure that <strong>the</strong>y di†er; a s2 test places <strong>the</strong><br />
chance probability that <strong>the</strong>y arise from <strong>the</strong> same parent<br />
distribution at 4 ] 10~3. We conclude that <strong>the</strong> energy<br />
FIG. 7.ÈEnergy spectrum <strong>of</strong> Markarian 501 (circles) and Markarian<br />
421 (stars) are compared above. The solid line is a curved Ðt to <strong>the</strong> Markarian<br />
421 Ñuxes, and <strong>the</strong> dotted line is a curved Ðt to <strong>the</strong> Markarian 501<br />
Ñuxes.<br />
spectra <strong>of</strong> Markarian 421 and Markarian 501 during Ñaring<br />
activity are di†erent.<br />
Although Markarian 421 and Markarian 501 are at<br />
almost <strong>the</strong> same redshift, <strong>the</strong>y do di†er in <strong>the</strong>ir X-ray spectrum.<br />
Observations <strong>of</strong> Markarian 421 by <strong>the</strong> ASCA X-ray<br />
satellite experiment, although not contemporaneous with<br />
<strong>the</strong> data presented here, indicate an energy break in <strong>the</strong><br />
synchrotron spectrum <strong>of</strong> 1.6È2.2 keV (Takahashi et al.<br />
1996). In contrast, X-ray observations <strong>of</strong> Markarian 501 by<br />
BeppoSAX taken in 1997 April showed that its synchrotron<br />
power can peak at hard X-ray energies at 100 keV (Pian et<br />
al. 1997). These observations coincide with long-term<br />
Ñaring activity in <strong>TeV</strong> gamma rays (1997 FebruaryÈ1997<br />
August) and indicated that synchrotron power from an<br />
AGN can peak at hard X-ray energies beyond 100 keV. In<br />
addition, Markarian 501 has been detected by <strong>the</strong> OSSE<br />
instrument aboard <strong>the</strong> Compton <strong>Gamma</strong> <strong>Ray</strong> Observatory at<br />
energies <strong>of</strong> 50È470 keV (Catanese et al. 1997), which clearly<br />
shows, for <strong>the</strong> Ðrst time, that synchrotron emission can peak<br />
above 100 keV.<br />
At GeV energies, Markarian 421 is seen by EGRET (Lin<br />
et al. 1992), albeit weakly, whereas Markarian 501 is not<br />
seen (Catanese et al. 1997). Thus in terms <strong>of</strong> <strong>the</strong><br />
synchrotronÈinverse Compton models for which <strong>the</strong> GeV<br />
emission is from <strong>the</strong> inverse Compton mechanism, it would<br />
appear that both <strong>the</strong> synchrotron peak and <strong>the</strong> inverse<br />
Compton peak are shifted to higher energies, leaving <strong>the</strong><br />
EGRET GeV energy sensitivity range in <strong>the</strong> gap between<br />
<strong>the</strong>m for Markarian 501. As shown in Figure 7, in <strong>the</strong><br />
energy range 260 GeVÈ10 <strong>TeV</strong>, <strong>the</strong> spectrum <strong>of</strong> Markarian<br />
501 is harder at lower energies and shows more curvature<br />
than Markarian 421. In fact <strong>the</strong> latter is consistent with a<br />
straight line (i.e., pure power law). This is also consistent<br />
with <strong>the</strong> peak inverse Compton power occurring at higher<br />
energies for Markarian 501, nearer <strong>the</strong> range covering our<br />
measurements. We see no obvious contradiction <strong>of</strong> our<br />
results with a synchrotronÈinverse Compton picture for <strong>the</strong><br />
origin <strong>of</strong> <strong>the</strong> <strong>TeV</strong> radiation.<br />
In order to probe intergalactic IR radiation via attenuation<br />
<strong>of</strong> <strong>TeV</strong> gamma rays, it is Ðrst necessary to know <strong>the</strong><br />
intrinsic energy spectra <strong>of</strong> AGN. <strong>Spectra</strong>l features such as<br />
<strong>the</strong> curvature <strong>of</strong> Markarian 501 cannot be ascribed a priori<br />
to this attenuation mechanism. This is clear because Markarian<br />
421 and Markarian 501 have almost identical redshifts<br />
yet di†erent spectra. The di†erences in <strong>the</strong>ir spectra<br />
can perhaps be explained in <strong>the</strong> context <strong>of</strong> <strong>the</strong> synchrotronÈ<br />
inverse Compton picture alluded to above (Hillas et al.<br />
1999b). A pro<strong>of</strong> <strong>of</strong> detection <strong>of</strong> <strong>the</strong> IR background radiation<br />
through a <strong>TeV</strong> photon absorption requires a detailed study<br />
<strong>of</strong> <strong>the</strong> spectrum <strong>of</strong> <strong>TeV</strong> blazars and <strong>the</strong>ir spectral variability;<br />
however, <strong>the</strong> IR limits (Biller et al. 1998) that allow for<br />
uncertainties in spectral shape are unchanged by this work.<br />
In summary, we have shown that <strong>the</strong> <strong>TeV</strong> spectra <strong>of</strong><br />
Markarian 421 and Markarian 501 di†er signiÐcantly, <strong>the</strong><br />
latter showing more curvature and a harder spectral slope<br />
below 2 <strong>TeV</strong>. Since <strong>the</strong> redshifts are almost identical, this<br />
di†erence can only be attributed to physics intrinsic to <strong>the</strong><br />
objects <strong>the</strong>mselves, and it is not inconsistent with a<br />
synchrotron-inverse Compton picture.<br />
We acknowledge <strong>the</strong> technical assistance <strong>of</strong> K. Harris<br />
and E. Roache. This research is supported by grants from<br />
<strong>the</strong> US Department <strong>of</strong> Energy and by NASA, PPARC in<br />
<strong>the</strong> UK, and Forbairt in Ireland.
156 KRENNRICH ET AL.<br />
Aharonian, F. A., et al. 1997, A&A, 327, L5<br />
Baltrusaitis, R. M., et al. 1985, Nucl. Intrum. Methods Phys. Res., A240,<br />
410<br />
Biller, S. D., et al. 1998, Phys. Rev. Lett., 80, 2992<br />
Bradbury, S. M., et al. 1997, A&A, A320, L5<br />
Catanese, M., et al. 1997, ApJ, 487, L143<br />
ÈÈÈ. 1998, ApJ, 501, 616<br />
Cawley, M. F. 1993, in Toward a Major Atmospheric Cerenkov Detector-<br />
II, ed. R. C. Lamb, 176<br />
Cawley, M. F., et al. 1990, Exp. Astron., 1, 173<br />
Gaidos, J. A., et al. 1996, Nature, 383, 319<br />
Gould, R. J., & Schre` der, G. 1967, Phys. Rev., 155, 1408<br />
Hillas, A. M. 1985, Proc. 19th Int. Cosmic-<strong>Ray</strong> Conf. (La Jolla, CA), 3, 445<br />
Hillas, A. M., et al. 1999a, ApJ, in press<br />
ÈÈÈ. 1999b, in preparation<br />
Krennrich, F., et al. 1995, in Toward a Major Atmospheric Cerenkov<br />
Detector, ed. M. Cresti, 161<br />
ÈÈÈ. 1997, ApJ, 482, 758<br />
Lin, Y. C., et al. 1992, ApJ, 401, L61<br />
Mannheim, K. 1993, Astron. Astrophys. Trans., 269, 67<br />
Mohanty, G. 1995, Ph.D. <strong>the</strong>sis, Iowa State Univ.<br />
REFERENCES<br />
Mohanty, G., et al. 1998, Astropart. Phys., 9, 15<br />
Pian, E., et al. 1997, ApJ, 492, L17<br />
Pro<strong>the</strong>roe, R. J., Bhat, C. L., Fleury, P., Lorenz, E., Teshima, M., &<br />
Weekes, T. C. 1998, Proc. 25th Int. Cosmic-<strong>Ray</strong> Conf. (Durban), 8, 317<br />
Punch, M., et al. 1992, Nature, 358, 477<br />
Quinn, J., et al. 1996, ApJ, 456, L83<br />
ÈÈÈ. 1998, in preparation<br />
Reynolds, P. T., et al. 1993, ApJ, 404, 206<br />
Samuelson, F. W., et al. 1998, ApJ, 501, L17<br />
Sikora, M., Begelman, M. C., & Rees, M. J. 1994, ApJ, 421, 153<br />
Sommers, P., & Elbert, J. W. 1987, J. Phys. G., 13, 553<br />
Stanev, T., & Franceschini, A. 1998, ApJ, 494, L159<br />
Stecker, F. W., & De Jager, O. C. 1997, ApJ, 476, 712<br />
Stecker, F. W., De Jager, O. C., & Salamon, M. H. 1992, ApJ, 390, L49<br />
ÈÈÈ. 1998, A&A, submitted<br />
Takahashi, T., et al. 1996, Mem. Soc. Astron. Italiana, 67, 533<br />
Thompson, D. J., et al. 1995, ApJS, 101, 259<br />
Urban, M., et al. 1996, Nucl. Instrum. Methods Phys. Res., A368, 503<br />
Zweerink, J., 1997, Ph.D. <strong>the</strong>sis, Iowa State Univ.<br />
Zweerink, J., et al. 1997, ApJ, 490, L170