Measurement of the Multi-TeV Gamma-Ray Flare Spectra of ...
Measurement of the Multi-TeV Gamma-Ray Flare Spectra of ...
Measurement of the Multi-TeV Gamma-Ray Flare Spectra of ...

Create successful ePaper yourself
Turn your PDF publications into a flip-book with our unique Google optimized e-Paper software.
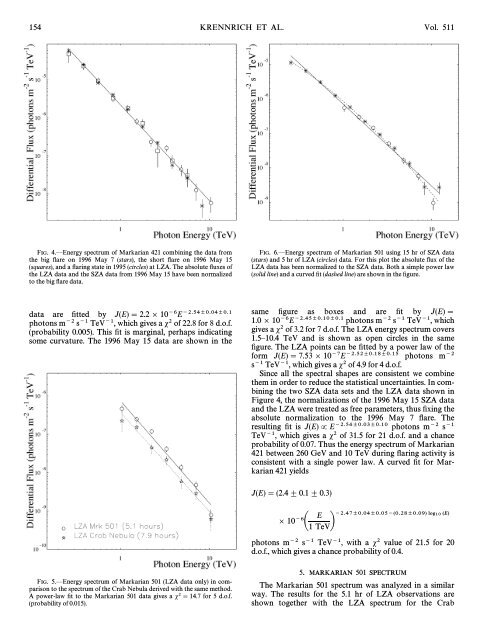
154 KRENNRICH ET AL. Vol. 511<br />
FIG. 4.ÈEnergy spectrum <strong>of</strong> Markarian 421 combining <strong>the</strong> data from<br />
<strong>the</strong> big Ñare on 1996 May 7 (stars), <strong>the</strong> short Ñare on 1996 May 15<br />
(squares), and a Ñaring state in 1995 (circles) at LZA. The absolute Ñuxes <strong>of</strong><br />
<strong>the</strong> LZA data and <strong>the</strong> SZA data from 1996 May 15 have been normalized<br />
to <strong>the</strong> big Ñare data.<br />
FIG. 6.ÈEnergy spectrum <strong>of</strong> Markarian 501 using 15 hr <strong>of</strong> SZA data<br />
(stars) and5hr<strong>of</strong>LZA(circles) data. For this plot <strong>the</strong> absolute Ñux <strong>of</strong> <strong>the</strong><br />
LZA data has been normalized to <strong>the</strong> SZA data. Both a simple power law<br />
(solid line) and a curved Ðt (dashed line) are shown in <strong>the</strong> Ðgure.<br />
data are Ðtted by J(E) \ 2.2 ] 10~6E~2.54B0.04B0.1<br />
photons m~2 s~1 <strong>TeV</strong>~1, which gives a s2 <strong>of</strong> 22.8 for 8 d.o.f.<br />
(probability 0.005). This Ðt is marginal, perhaps indicating<br />
some curvature. The 1996 May 15 data are shown in <strong>the</strong><br />
same Ðgure as boxes and are Ðt by J(E) \<br />
1.0 ] 10~6E~2.45B0.10B0.1 photons m~2 s~1 <strong>TeV</strong>~1, which<br />
gives a s2 <strong>of</strong> 3.2 for 7 d.o.f. The LZA energy spectrum covers<br />
1.5È10.4 <strong>TeV</strong> and is shown as open circles in <strong>the</strong> same<br />
Ðgure. The LZA points can be Ðtted by a power law <strong>of</strong> <strong>the</strong><br />
form J(E) \ 7.53 ] 10~7E~2.52B0.18B0.15 photons m~2<br />
s~1 <strong>TeV</strong>~1, which gives a s2 <strong>of</strong> 4.9 for 4 d.o.f.<br />
Since all <strong>the</strong> spectral shapes are consistent we combine<br />
<strong>the</strong>m in order to reduce <strong>the</strong> statistical uncertainties. In combining<br />
<strong>the</strong> two SZA data sets and <strong>the</strong> LZA data shown in<br />
Figure 4, <strong>the</strong> normalizations <strong>of</strong> <strong>the</strong> 1996 May 15 SZA data<br />
and <strong>the</strong> LZA were treated as free parameters, thus Ðxing <strong>the</strong><br />
absolute normalization to <strong>the</strong> 1996 May 7 Ñare. The<br />
resulting Ðt is J(E) P E~2.54B0.03B0.10 photons m~2 s~1<br />
<strong>TeV</strong>~1, which gives a s2 <strong>of</strong> 31.5 for 21 d.o.f. and a chance<br />
probability <strong>of</strong> 0.07. Thus <strong>the</strong> energy spectrum <strong>of</strong> Markarian<br />
421 between 260 GeV and 10 <strong>TeV</strong> during Ñaring activity is<br />
consistent with a single power law. A curved Ðt for Markarian<br />
421 yields<br />
J(E) \ (2.4 ^ 0.1 ^ 0.3)<br />
A ] 10~6 E B~2.47B0.04B0.05~(0.28B0.09) log10 (E)<br />
1<strong>TeV</strong><br />
photons m~2 s~1 <strong>TeV</strong>~1, with a s2 value <strong>of</strong> 21.5 for 20<br />
d.o.f., which gives a chance probability <strong>of</strong> 0.4.<br />
FIG. 5.ÈEnergy spectrum <strong>of</strong> Markarian 501 (LZA data only) in comparison<br />
to <strong>the</strong> spectrum <strong>of</strong> <strong>the</strong> Crab Nebula derived with <strong>the</strong> same method.<br />
A power-law Ðt to <strong>the</strong> Markarian 501 data gives a s2\14.7 for 5 d.o.f.<br />
(probability <strong>of</strong> 0.015).<br />
5. MARKARIAN 501 SPECTRUM<br />
The Markarian 501 spectrum was analyzed in a similar<br />
way. The results for <strong>the</strong> 5.1 hr <strong>of</strong> LZA observations are<br />
shown toge<strong>the</strong>r with <strong>the</strong> LZA spectrum for <strong>the</strong> Crab