Measurement of the Multi-TeV Gamma-Ray Flare Spectra of ...
Measurement of the Multi-TeV Gamma-Ray Flare Spectra of ...
Measurement of the Multi-TeV Gamma-Ray Flare Spectra of ...

Create successful ePaper yourself
Turn your PDF publications into a flip-book with our unique Google optimized e-Paper software.
No. 1, 1999 TEV FLARE SPECTRA 155<br />
Nebula in Figure 5. The Ñux level <strong>of</strong> Markarian 501 was on<br />
average B2 crab units during <strong>the</strong>se observations, and <strong>the</strong><br />
spectral slope is similar to that for <strong>the</strong> Crab spectrum. The<br />
spectrum extends up to 10 <strong>TeV</strong> and can be Ðtted between<br />
1.1 and 10.4 <strong>TeV</strong> with a power law yielding s2\14.7 for 5<br />
d.o.f. (chance probability <strong>of</strong> 0.015): J(E) \<br />
7.53 ] 10~7E~2.67B0.09B0.15 photons m~2 s~1 <strong>TeV</strong>~1.<br />
The errors on <strong>the</strong> spectral index are given by a statistical<br />
uncertainty <strong>of</strong> ^0.09, and a systematic uncertainty <strong>of</strong><br />
^0.15. The slightly high value <strong>of</strong> s2 hints at curvature in <strong>the</strong><br />
spectrum.<br />
The LZA data (5.1 hr) can be combined with <strong>the</strong> SZA<br />
data (15 hr), treating <strong>the</strong> normalization <strong>of</strong> <strong>the</strong> former<br />
as a free parameter as described in <strong>the</strong> last section. This<br />
yields <strong>the</strong> spectrum given previously in Samuelson et al.<br />
(1998), which is shown in Figure 6. Fitting this data with<br />
a simple power law, J(E) \ 6.9 ] 10~7E~2.41B0.025<br />
photons m~2 s~1 <strong>TeV</strong>~1, which gives s2\59.7 for<br />
15 d.o.f. with a chance probability <strong>of</strong> 2.5 ] 10~7.<br />
Including a curvature term yields J(E) \ (8.6 ^ 0.3 ^ 0.7)<br />
] 10~7E~2.22B0.04B0.05~(0.47B0.07) log10 (E) photons m~2<br />
s~1 <strong>TeV</strong>~1, which gives s2\18 for 14 d.o.f. with a chance<br />
probability <strong>of</strong> 0.2. As shown in Figure 6, <strong>the</strong> Markarian 501<br />
spectrum is clearly curved. <strong>Spectra</strong>l variability is not likely<br />
to account for <strong>the</strong> curvature; <strong>the</strong> superposition <strong>of</strong> two different<br />
power laws would result in a concave spectrum ra<strong>the</strong>r<br />
than a convex shape.<br />
6. DISCUSSION: MARKARIAN 421 VERSUS<br />
MARKARIAN 501<br />
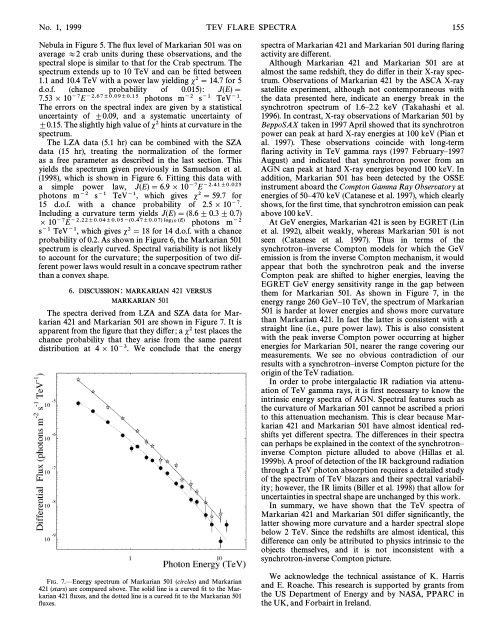
The spectra derived from LZA and SZA data for Markarian<br />
421 and Markarian 501 are shown in Figure 7. It is<br />
apparent from <strong>the</strong> Ðgure that <strong>the</strong>y di†er; a s2 test places <strong>the</strong><br />
chance probability that <strong>the</strong>y arise from <strong>the</strong> same parent<br />
distribution at 4 ] 10~3. We conclude that <strong>the</strong> energy<br />
FIG. 7.ÈEnergy spectrum <strong>of</strong> Markarian 501 (circles) and Markarian<br />
421 (stars) are compared above. The solid line is a curved Ðt to <strong>the</strong> Markarian<br />
421 Ñuxes, and <strong>the</strong> dotted line is a curved Ðt to <strong>the</strong> Markarian 501<br />
Ñuxes.<br />
spectra <strong>of</strong> Markarian 421 and Markarian 501 during Ñaring<br />
activity are di†erent.<br />
Although Markarian 421 and Markarian 501 are at<br />
almost <strong>the</strong> same redshift, <strong>the</strong>y do di†er in <strong>the</strong>ir X-ray spectrum.<br />
Observations <strong>of</strong> Markarian 421 by <strong>the</strong> ASCA X-ray<br />
satellite experiment, although not contemporaneous with<br />
<strong>the</strong> data presented here, indicate an energy break in <strong>the</strong><br />
synchrotron spectrum <strong>of</strong> 1.6È2.2 keV (Takahashi et al.<br />
1996). In contrast, X-ray observations <strong>of</strong> Markarian 501 by<br />
BeppoSAX taken in 1997 April showed that its synchrotron<br />
power can peak at hard X-ray energies at 100 keV (Pian et<br />
al. 1997). These observations coincide with long-term<br />
Ñaring activity in <strong>TeV</strong> gamma rays (1997 FebruaryÈ1997<br />
August) and indicated that synchrotron power from an<br />
AGN can peak at hard X-ray energies beyond 100 keV. In<br />
addition, Markarian 501 has been detected by <strong>the</strong> OSSE<br />
instrument aboard <strong>the</strong> Compton <strong>Gamma</strong> <strong>Ray</strong> Observatory at<br />
energies <strong>of</strong> 50È470 keV (Catanese et al. 1997), which clearly<br />
shows, for <strong>the</strong> Ðrst time, that synchrotron emission can peak<br />
above 100 keV.<br />
At GeV energies, Markarian 421 is seen by EGRET (Lin<br />
et al. 1992), albeit weakly, whereas Markarian 501 is not<br />
seen (Catanese et al. 1997). Thus in terms <strong>of</strong> <strong>the</strong><br />
synchrotronÈinverse Compton models for which <strong>the</strong> GeV<br />
emission is from <strong>the</strong> inverse Compton mechanism, it would<br />
appear that both <strong>the</strong> synchrotron peak and <strong>the</strong> inverse<br />
Compton peak are shifted to higher energies, leaving <strong>the</strong><br />
EGRET GeV energy sensitivity range in <strong>the</strong> gap between<br />
<strong>the</strong>m for Markarian 501. As shown in Figure 7, in <strong>the</strong><br />
energy range 260 GeVÈ10 <strong>TeV</strong>, <strong>the</strong> spectrum <strong>of</strong> Markarian<br />
501 is harder at lower energies and shows more curvature<br />
than Markarian 421. In fact <strong>the</strong> latter is consistent with a<br />
straight line (i.e., pure power law). This is also consistent<br />
with <strong>the</strong> peak inverse Compton power occurring at higher<br />
energies for Markarian 501, nearer <strong>the</strong> range covering our<br />
measurements. We see no obvious contradiction <strong>of</strong> our<br />
results with a synchrotronÈinverse Compton picture for <strong>the</strong><br />
origin <strong>of</strong> <strong>the</strong> <strong>TeV</strong> radiation.<br />
In order to probe intergalactic IR radiation via attenuation<br />
<strong>of</strong> <strong>TeV</strong> gamma rays, it is Ðrst necessary to know <strong>the</strong><br />
intrinsic energy spectra <strong>of</strong> AGN. <strong>Spectra</strong>l features such as<br />
<strong>the</strong> curvature <strong>of</strong> Markarian 501 cannot be ascribed a priori<br />
to this attenuation mechanism. This is clear because Markarian<br />
421 and Markarian 501 have almost identical redshifts<br />
yet di†erent spectra. The di†erences in <strong>the</strong>ir spectra<br />
can perhaps be explained in <strong>the</strong> context <strong>of</strong> <strong>the</strong> synchrotronÈ<br />
inverse Compton picture alluded to above (Hillas et al.<br />
1999b). A pro<strong>of</strong> <strong>of</strong> detection <strong>of</strong> <strong>the</strong> IR background radiation<br />
through a <strong>TeV</strong> photon absorption requires a detailed study<br />
<strong>of</strong> <strong>the</strong> spectrum <strong>of</strong> <strong>TeV</strong> blazars and <strong>the</strong>ir spectral variability;<br />
however, <strong>the</strong> IR limits (Biller et al. 1998) that allow for<br />
uncertainties in spectral shape are unchanged by this work.<br />
In summary, we have shown that <strong>the</strong> <strong>TeV</strong> spectra <strong>of</strong><br />
Markarian 421 and Markarian 501 di†er signiÐcantly, <strong>the</strong><br />
latter showing more curvature and a harder spectral slope<br />
below 2 <strong>TeV</strong>. Since <strong>the</strong> redshifts are almost identical, this<br />
di†erence can only be attributed to physics intrinsic to <strong>the</strong><br />
objects <strong>the</strong>mselves, and it is not inconsistent with a<br />
synchrotron-inverse Compton picture.<br />
We acknowledge <strong>the</strong> technical assistance <strong>of</strong> K. Harris<br />
and E. Roache. This research is supported by grants from<br />
<strong>the</strong> US Department <strong>of</strong> Energy and by NASA, PPARC in<br />
<strong>the</strong> UK, and Forbairt in Ireland.