New peaks - Motilal Oswal
New peaks - Motilal Oswal
New peaks - Motilal Oswal

Create successful ePaper yourself
Turn your PDF publications into a flip-book with our unique Google optimized e-Paper software.
August 2011<br />
Thematic Report | Sector: Pharmaceuticals<br />
Domestic Formulations<br />
<strong>New</strong> <strong>peaks</strong><br />
Nimish Desai (NimishDesai@<strong>Motilal</strong><strong>Oswal</strong>.com); Tel: +91 22 3982 5406<br />
Amit Shah (Amit.Shah@<strong>Motilal</strong><strong>Oswal</strong>.com); Tel: +91 22 3982 5423
Domestic Formulations | <strong>New</strong> Peaks<br />
Domestic Formulations<br />
Page No.<br />
<strong>New</strong> <strong>peaks</strong> - USD21b opportunity by 2015 ...................................... 1-5<br />
4 A's and 4 Ailments ............................................................................ 6-8<br />
A #1 - Affordability ............................................................................. 9-11<br />
A #2 - Access ................................................................................... 12-13<br />
A #3 - Awareness .................................................................................. 14<br />
A #4 - Ailments ................................................................................. 15-17<br />
4 Buys - Cipla, Lupin, Torrent and GSK Pharma.......................... 18-22<br />
Ailments ........................................................................................... 23-30<br />
Infection ............................................................................. 24<br />
CVS Disease .................................................................... 25<br />
Diabetes ........................................................................... 26<br />
CNS Diseases .................................................................. 27<br />
Pain .................................................................................. 28<br />
Gastro-intestinal (GI) Problems ......................................... 29<br />
Respiratory Diseases ....................................................... 30<br />
Annexure ......................................................................................... 31-36<br />
Company .......................................................................................37-142<br />
Cipla ............................................................................ 38-49<br />
Lupin ............................................................................ 50-61<br />
Torrent Pharma ............................................................. 62-71<br />
GSK Pharma................................................................ 72-79<br />
Sun Pharma ................................................................. 80-91<br />
Cadila ........................................................................92-103<br />
Ranbaxy ................................................................... 104-115<br />
Dr Reddy's Labs ...................................................... 116-127<br />
Glenmark..................................................................128-142
The Indian Pharma Story<br />
4 A’s. 4 Ailments. 4 Buys<br />
USD21b opportunity by 2015<br />
We estimate the 2015 Indian domestic market size at Rs960b (USD21b) i.e. a CAGR of<br />
16% over 2010-15 (FY11-16) founded on 4 pillars what we call as 4 A's viz. Affordability,<br />
Access, Awareness and Ailments.<br />
Accelerating growth in domestic formulation market (USD b)<br />
Indian pharma mkt size-INR b<br />
Approach 1 983<br />
Approach 2 936<br />
Approach 3 962<br />
Average 960<br />
3.3 3.5 3.7 4.1 4.7 5.2<br />
2000<br />
2001<br />
2002<br />
2003<br />
Acute larger, but chronic faster<br />
Historically, in the Indian pharma market, the acute ailments therapy segment was the<br />
largest in terms of sales, although it experienced slower growth rates than some of the<br />
chronic therapies. Nevertheless, almost all therapy areas experienced double-digit growth.<br />
Therapeutic mix - 2000 Therapeutic mix - 2010<br />
Antidiabeti<br />
CNS<br />
c<br />
5% Others<br />
3%<br />
12%<br />
Dermatolo<br />
gy<br />
6%<br />
Gynaecolo<br />
gy<br />
6%<br />
Cardiac<br />
9%<br />
6.0<br />
7.5 7.9 8.3<br />
10.2<br />
9.3% CAGR14.2% CAGR 15.6% CAGR<br />
Pain/<br />
Analgesic<br />
10 %<br />
2004<br />
2005<br />
Vitamins/<br />
Minerals<br />
10%<br />
2006<br />
2007<br />
Gastroin<br />
testinal<br />
10%<br />
Respirator<br />
y<br />
11%<br />
2008<br />
2009<br />
A ntidiabeti<br />
c<br />
6%<br />
CNS<br />
6%<br />
Dermatolo<br />
gy<br />
5%<br />
Gynaecolo<br />
gy<br />
6%<br />
2010<br />
2011<br />
Others<br />
13%<br />
Cardiac<br />
11%<br />
2012<br />
Pain/<br />
Analgesic<br />
9%<br />
2013<br />
2014<br />
21.0<br />
2015<br />
Antiinfectives<br />
18 %<br />
Antiinfectives<br />
16 %<br />
Gastrointestinal<br />
11%<br />
Vitamins/<br />
Minerals<br />
8%<br />
Respirato<br />
y<br />
9%<br />
A#1: Affordability<br />
Medicines are becoming more affordable led by (1) Rising per capita income, (2) Urbanization,<br />
and (3) Higher penetration of health insurance. This is driving the growth in the<br />
domestic pharma market.<br />
2015 Indian pharma market estimate: Affordability approach<br />
Per capita Per capita Multiplier Pharma<br />
GDP pharma conspn. (x) market<br />
INR CAGR INR CAGR (%) INR b CAGR (%) (%)<br />
(1) (2) (3) (4) (6) (7)<br />
(5) = (4) / (2)<br />
FY01 20,786 - 140 - - 151 -<br />
FY06 33,827 10.2 212 8.7 0.8 230 8.9<br />
FY11 60,048 12.2 390 12.9 1.1 465 15.1<br />
FY16 105,668 12.0 784 15.0 1.3 983 15.0<br />
Dermatology 25 5.4 15.1 51 5.3 15 26<br />
A#2: Access<br />
Anti-infectives<br />
Gynaecology<br />
80<br />
26<br />
17.2<br />
5.7<br />
11.2<br />
26.9<br />
147<br />
49<br />
15.3<br />
5.1<br />
13<br />
13<br />
67<br />
22<br />
People's access to medicines is improving given (1) Rising government spend on healthcare,<br />
(2) India's improving medical infrastructure, and (3) Companies' thrust on increasing<br />
rural reach. All are combined to further expand the domestic pharma market.<br />
Pain/Analgesic<br />
Vitamins/Minerals<br />
Others<br />
Total<br />
40<br />
36<br />
59<br />
465<br />
8.6<br />
7.7<br />
12.8<br />
100.0<br />
14.3<br />
5.4<br />
27.6<br />
15.1<br />
68<br />
58<br />
119<br />
962<br />
7.0<br />
6.0<br />
12.4<br />
100.0<br />
11<br />
10<br />
15<br />
15.6<br />
28<br />
22<br />
60<br />
496<br />
India’s medical infrastructure among the weakest in the world<br />
Germany<br />
France<br />
Australia<br />
A#3: Awareness<br />
Health awareness in India is rising on the back of (1) Improving literacy, and (2) Rising<br />
penetration of media. This serves as an undercurrent for sustaining pharma demand.<br />
High correlation of literacy with per capita pharma consumption<br />
100<br />
Russia<br />
85<br />
70<br />
55<br />
40<br />
Italy<br />
US<br />
UK<br />
Japan<br />
Brazil<br />
China<br />
India<br />
Orissa<br />
Domestic Formulations market will be USD21b in 2015, 2x over 2010. Buy Cipla, Lupin, Torrent, GSK Pharma<br />
The India domestic pharma story is founded on 4 pillars, what we call the 4 A's - Affordability,<br />
Access, Awareness and Ailments. These 4 A's will enable the market to be 2x - from USD10b<br />
in 2010 to USD21b in 2015. A significant share of the market delta is explained by<br />
4 Ailments - CVS, Diabetes, CNS and Infection. These ailment segments rank high on<br />
what we call the Attractiveness Factor, measured as incremental market size divided by<br />
Bihar<br />
139<br />
Literacy rate (%)<br />
Gujarat<br />
97<br />
UP<br />
83<br />
Rajasthan<br />
A#4: Ailments<br />
72<br />
Doctors/10,000<br />
Hospital beds/10,000<br />
Assam<br />
Per Capita Pharma spend (Rs)<br />
Karnataka<br />
Madhya<br />
Pradesh<br />
As a trend, incidence of chronic/lifestyle ailments (cardiovascular, central nervous system,<br />
diabetes) is rising compared to acute ailments. Medicine demand from these segments<br />
will grow faster than the rest of the Indian pharma market.<br />
Share of chronic ailments segment is on the rise (%)<br />
Acute segment<br />
West Bengal<br />
Andhra<br />
Pradesh<br />
16 22 23 30<br />
84 78 77<br />
4 A’s 4 Ailments<br />
2000 2005 2010 2015E<br />
39<br />
39<br />
39<br />
31<br />
30<br />
24<br />
9 5<br />
2015 Indian pharma market estimate: Access approach<br />
Year Pharmacies CAGR Mkt (INR b) Mkt/Pharmacy (INR) CAGR (%)<br />
2000 322,023 - 151 467,420 -<br />
2005 410,992 5.0 230 559,622 3.7<br />
2010 550,000 6.0 465 846,018 8.6<br />
2015 736,024 6.0 936 1,272,121 8.5<br />
Tamil Nadu<br />
Haryana<br />
Chronic segment<br />
12<br />
11<br />
Punjab<br />
20<br />
25<br />
23<br />
26<br />
Kerala<br />
70<br />
34<br />
34<br />
Maharashtra<br />
43<br />
42<br />
800<br />
600<br />
400<br />
200<br />
0<br />
CVS, Diabetes, CNS and Anti-infectives<br />
We believe that CATS like Cardiovascular (CVS), Diabetes, Central Nervous System (CNS)<br />
will account for a major chunk of the incremental market over the next 5 years. Also, with<br />
rising income levels in the rural areas, anti-infectives will also record good growth over<br />
the same period. We believe these four will be the key segments of the future.<br />
2015 Indian pharma market estimate: Ailment approach (INR b)<br />
2010 2015E Incr. mkt<br />
Share (%) Share 2015 on 2009<br />
Mkt size CAGR (%) Mkt size (%) CAGR (%)<br />
27 5.8 22.1 83 8.6 25 56<br />
Anti-diabetic<br />
CVS 53 11.3 17.1 137 14.2 21 84<br />
CNS 26 5.6 9.4 65 6.7 20 39<br />
Gastrointestinal 51 11.1 16.2 103 10.8 15 52<br />
Respiratory 41 8.8 13.5 82 8.5 15 41<br />
CVS, Anti-infectives, Diabetes and CNS: Key segments with relatively fewer players<br />
No. of Players<br />
2010<br />
2009<br />
2008<br />
2005<br />
2001<br />
2000<br />
0<br />
10<br />
20<br />
30<br />
40<br />
0 20 40 60 80 100<br />
Gynaecology<br />
9<br />
9<br />
10<br />
Vitamines<br />
11<br />
11<br />
11<br />
14<br />
13<br />
Dematology<br />
24<br />
CNS<br />
AF - 215<br />
Pain<br />
Diabetes<br />
AF - 396<br />
AI<br />
AF - 337<br />
Respiratory<br />
AF - 147<br />
GI<br />
AF - 109<br />
Incremental mkt size (Rs b) 2010-15E<br />
38<br />
45<br />
Segm ent Size (INR b)<br />
53<br />
Contribution to Industry (%)<br />
CVS<br />
AF - 400<br />
CVS (2001-10 CAGR - 15.9%) Diabetes (2001-10 CAGR - 17.8%)<br />
CNS (2001-10 CAGR - 14.4%) Anti-infectives (2001-10 CAGR - 12.4%)<br />
2010<br />
2009<br />
2008<br />
2005<br />
2001<br />
2000<br />
5<br />
5<br />
6<br />
6<br />
5<br />
the number of players who will share the pie. Companies with a strong presence in these<br />
ailment segments are therefore better placed. Most companies with a meaningful presence<br />
in Indian market will clock healthy growth in sales and profits. We have identified winning<br />
stocks based on a combined approach of conventional P/E-based valuation and our proprietary<br />
MEDICINES Score. Our 4 Buys are Cipla, Lupin, Torrent and GSK Pharma.<br />
Note: AF=Incremental market size divided by number of players<br />
7<br />
7<br />
8<br />
17<br />
19<br />
22<br />
Segment Size (INR B)<br />
26<br />
Contribution to Industry (%)<br />
2010<br />
2009<br />
2008<br />
2005<br />
2001<br />
2000<br />
2010<br />
2009<br />
2008<br />
2005<br />
2001<br />
2000<br />
3<br />
4<br />
4<br />
5<br />
6<br />
5<br />
5<br />
6<br />
17<br />
17<br />
18<br />
20<br />
10<br />
18<br />
22<br />
Segment Size (INR b)<br />
27<br />
Contribution to Industry (%)<br />
47<br />
61<br />
70<br />
80<br />
28<br />
18 Segment Size (INR B)<br />
Contribution to Industry (%)<br />
29<br />
19<br />
4 Buys<br />
Presence in high-potential segments<br />
The chart below maps the positioning of pharmaceutical players in the key therapeutic<br />
segments of CVS, Diabetes, anti-infectives and CNS. We have plotted the dominance of<br />
each player in these respective segments using prescription market share as the key<br />
measure of dominance.<br />
Company mapping with respect to therapeutic classes<br />
Sun Pharma, Abbott, U S V, Ranbaxy, Alkem, Sun Pharma,<br />
Torrent, Cadila,<br />
High<br />
Aventis, Sun Aristo, Cipla, Intas, Torrent,<br />
Cipla, Unichem, Pharma<br />
GSK, Piramal Abbott, Piramal<br />
Ranbaxy, Lupin<br />
Dominance<br />
Medium<br />
Low<br />
Aventis, U S V,<br />
Emcure, Piramal,<br />
Dr Reddy’s,<br />
Intas, Micro Labs<br />
IPCA Labs,<br />
AstraZeneca,<br />
Pfizer<br />
Eli Lilly, Piramal,<br />
Micro Labs,<br />
Lupin<br />
Panacea,<br />
Ranbaxy<br />
Alembic, Mankind,<br />
FDC, Macleods,<br />
Lupin<br />
Attractiveness of international business<br />
It is imperative to map the domestic and the non-domestic businesses of companies to<br />
take an overall view on them, as depicted below.<br />
Company mapping: Attractiveness of domestic and international business<br />
International Business<br />
Favourable<br />
Neutral<br />
Unfavourable<br />
Note: Only companies<br />
covered in this report<br />
have been mapped<br />
Earnings growth v/s valuation<br />
Aventis,<br />
Ranbaxy,<br />
Unichem,<br />
Micro Labs<br />
Novartis, Cipla,<br />
Lupin<br />
CVS Diabetes Anti-infectives CNS<br />
Glenmark Pharma<br />
Dr Reddy<br />
Cipla, GSK<br />
Pharma<br />
Cadila, Piramal,<br />
Ranbaxy<br />
Pfizer, Mankind,<br />
Dr Reddy’s,<br />
Sun Pharma,<br />
Glenmark, Biocon<br />
Others<br />
Sun Pharma, Cipla,<br />
Lupin, Cadila,<br />
Torrent Pharma<br />
Ranbaxy,<br />
GSK Pharma<br />
Unfavorable Neutral Favorable<br />
Domestic Business<br />
We plotted the Screen #2 shortlisted companies in a matrix of FY11-13E EPS CAGR and<br />
FY11 P/E as depicted below. Based on the same, the top picks are Torrent, Cipla & Lupin.<br />
Company mapping with respect to earnings growth and valuation<br />
FY11 P/E<br />
40<br />
30<br />
20<br />
10<br />
Dr Reddy<br />
GSK<br />
Lupin<br />
Cadila<br />
Cipla<br />
Torrent<br />
Glenmark<br />
10.0 14.0 18.0 22.0 26.0 30.0<br />
FY11-13E EPS CAGR (%)<br />
Top picks: Cipla, Lupin, Torrent and GSK<br />
We have identified nine key success factors (KSFs) for shortlisting Indian pharma<br />
companies and their stocks. These success factors correspond to the initials of the word<br />
"MEDICINES". We have rated the companies on these KSFs to arrive at a final<br />
MEDICINES Score out of a maximum possible 100.<br />
Indian domestic pharma players: The MEDICINES scorecard<br />
M E D I C I N E S Total<br />
Sun 7 9 8 6 9 9 7 9 13 77<br />
Cipla 6 7 8 6 6 7 5 7 14 66<br />
GSK Pharma** 4 9 7 3 6 9 - 6 14 64<br />
Lupin 5 6 6 6 8 5 6 6 14 62<br />
Torrent Pharma 6 7 6 5 6 3 6 8 14 61<br />
Cadila 6 7 7 5 6 5 6 6 12 60<br />
Dr. Reddy's Labs 4 6 6 4 6 2 7 5 12 52<br />
Glenmark 2 3 5 6 6 5 3 9 10 49<br />
Ranbaxy 6 5 7 5 6 3 5 3 9 49<br />
** GSK Pharma total MEDICINES score pro-rated as rating for Non-domestic business is not applicable<br />
Sun<br />
Ranbaxy (53%, 65x)<br />
August 2011
The 4 Ailments<br />
Lifestyle ailments will grow faster than others<br />
Attractiveness Factor - Our key test to check health of ailment segments<br />
• Usually, size is considered as the key criteria for the attractiveness of any market • AF = Incremental market size / No. of players. Obviously, higher the AF, better<br />
or market segment.<br />
the prospects of incumbents.<br />
• But to arrive at the 4 key ailment segments, we have used the measure of • Thus, Gastro and Respiratory will have higher incremental market than CNS. But<br />
Attractiveness Factor (AF).<br />
the same will be shared among a very large number of players, diluting the<br />
segments' attractiveness.<br />
Indian Power Sector: Story in Pictures<br />
• Of the 4 key segments, the AF ranking is (1) CVS - 400, (2) Diabetes - 396, (3)<br />
Infection - 337, and (4) CNS - 215.<br />
• CVS, Infection and Diabetes (in that order) rank higher than all other segments,<br />
both in terms of incremental market size and AF.<br />
• Market share of the 4 key ailments set to rise from 40% in 2010 to 45% in 2015<br />
The 4 Buys<br />
Based on detailed MEDICINES Score ranking<br />
MEDICINES Score - Criteria, maximum score (in brackets) & rating methodology<br />
M - Mix & Market share (10): Strong presence in lifestyle segments rated higher<br />
E - Equity with doctors (10): Higher prescription share and rankings rated higher<br />
D - Distribution & reach (10): Wider distribution and reach in relevant<br />
geographies are rated higher<br />
I - Introductions (10): Higher contribution from new launches are rated higher<br />
C - CAGR & scale-up (10): Consistent high growth is rated higher<br />
I - Improvement in MR productivity (10): Consistently high or improving Sales/<br />
MR is rated higher<br />
N - Non-domestic business (10): Attractive overseas opportunity (incl one-offs) is<br />
rated higher<br />
E - Earnings growth (10): High long-term earnings growth (FY05-13) is rated higher<br />
S - Stock attractiveness (20): Captures outlook, valuation, and our overall view.<br />
Mix<br />
Equity with doctors<br />
MEDICINES Chronic therapy Score Comment<br />
Score<br />
Score contribution (%)<br />
Sun 77 61 7 Leader in CNS, Gynaec and 2nd in CVS, Anti-diabetics 9<br />
Market leader in AI and Respiratory 7<br />
Cipla 66 42 6<br />
Leader in Anti-TB segment 6<br />
Lupin 62 43 5<br />
Ranks 2nd in CNS and 7th 7<br />
Torrent Pharma 61 62 6<br />
in CVS<br />
Market leader in Derma, Vit and Pain 9<br />
GSK Pharma ** 64 5 4<br />
Mgmt<br />
Among top 3 players in CVS and GI 7<br />
Cadila 60 31 6<br />
Ranks 3rd in GI and Pain Mgmt 6<br />
Dr. Reddy's Labs 52 28 4<br />
Ranks 2nd in Dermatology 3<br />
Glenmark 49 24 2<br />
Among the leaders in AI and 5<br />
Ranbaxy 49 21 6<br />
Dermatology<br />
** GSK Pharma total MEDICINES score pro-rated as rating for Non-domestic business is not applicable<br />
Domestic formulations companies - Comparative valuations (INR)<br />
Company Target Upside EPS (INR) P/E (X) EV/EBITDA (X) ROE (%)<br />
(CMP) Price (%) FY12E FY12E FY11 FY12E FY13E FY12E FY11 FY13E FY11 FY13E FY11 FY13E<br />
Top Picks<br />
Cipla (281) 361 28 12.0 13.4 16.4 23.3 21.0 17.1 17.4 14.5 12.1 14.5 14.4 15.6<br />
Lupin (450) 514 14 19.3 22.3 25.7 23.3 20.2 17.5 19.5 16.8 13.8 29.3 27.1 25.7<br />
Torrent (589) 762 29 31.9 40.1 47.6 18.4 14.7 12.4 12.4 9.6 8.0 29.2 29.3 27.7<br />
GSK (2,155) 2,330 8 68.6 77.5 89.6 31.4 27.8 24.1 21.9 20.2 17.2 30.1 31.3 33.4<br />
Others<br />
Sun (464) 524 13 13.6 17.3 20.9 34.2 26.8 22.2 22.4 20.8 16.7 16.2 17.7 18.5<br />
Cadila (824) 907 10 30.9 28.3 41.1 26.6 29.1 20.0 17.2 17.2 14.0 37.5 27.3 27.6<br />
DRRD* (1,446) 1,670 15 65.6 68.6 81.1 21.6 20.7 17.5 16.7 17.1 14.4 24.1 22.5 23.5<br />
Glenmark (318) 310 -3 12.5 16.1 19.7 25.5 19.7 16.1 17.7 10.4 11.1 17.4 17.0 17.1<br />
Ranbaxy ## (468) 412 -12 25.8 11.9 16.7 15.2 33.0 23.3 11.1 23.0 18.5 19.4 11.4 10.4<br />
* Dr. Reddy's<br />
## - Adjusted for Rs77/sh of DCF value of FTF; Dr. Reddy's Labs & Ranbaxy core valuations adjusted for DCF value of Para-IV upsides<br />
Distribution & reach<br />
Metro/Tier I MR strength Score<br />
(% of sales)<br />
73 2,600 8<br />
63 5,100 8<br />
70 3,682 6<br />
73 3,600 6<br />
60 2,500 7<br />
65 4,500 7<br />
68 3,165 6<br />
70 2,078 5<br />
66 4,500 7<br />
Introductions<br />
In last Contbn to Score<br />
4 years growth (%)<br />
124 56 6<br />
304 45 6<br />
266 69 6<br />
151 49 5<br />
21 15 3<br />
197 37 5<br />
89 31 4<br />
105 52 6<br />
255 50 5<br />
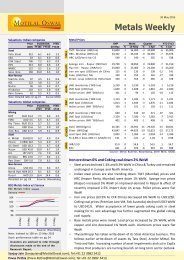
Sector performance vis-a-vis benchmark<br />
Outperformer post the credit crisis<br />
The DF index has consistently outperformed the Sensex and the BSE<br />
Healthcare index as well from Sep-2009 onwards. In fact the DF index<br />
commenced its outperformance vis-à-vis the BSE Healthcare index<br />
immediately post the credit crises of 2008.<br />
We believe that the outperformance reflects the relatively defensive<br />
nature of the DF business coupled with reasonable growth and good<br />
profitability. The outperformance is also aided by the fact that the DF<br />
business is relatively less capital intensive as compared to some of the<br />
other pharma businesses.<br />
CAGR & Scale-up (%) - Sales<br />
FY05-11 FY11-13 Score<br />
23 18 9<br />
14 13 6<br />
22 19 8<br />
19 18 6<br />
8 14 6<br />
12 15 6<br />
18 16 6<br />
19 17 6<br />
10 16 6<br />
Improvement in productivity<br />
(Sales/MR, INR m)<br />
2004 2010 Score<br />
3.2 7.8 9<br />
4.8 4.9 7<br />
3.6 3.6 5<br />
1.5 2.3 3<br />
6.5 7.1 9<br />
4.1 3.6 5<br />
3.6 3.2 2<br />
3.1 3.6 5<br />
4.6 3.6 3<br />
Non domestic<br />
business<br />
Favorability Score<br />
High 7<br />
Medium 5<br />
High 6<br />
High 6<br />
Not applicable 0<br />
High 6<br />
High 7<br />
Low 3<br />
Medium 5<br />
Domestic Formulations (DF) Index is an outperformer over 5 years ...<br />
250<br />
200<br />
150<br />
100<br />
50<br />
Aug-06<br />
Nov-06<br />
Feb-07<br />
All indices re-based to 100<br />
Sensex BSE Healthcare Index DF Index<br />
May-07<br />
Aug-07<br />
Nov-07<br />
Feb-08<br />
May-08<br />
Aug-08<br />
Nov-08<br />
Feb-09<br />
May-09<br />
Aug-09<br />
Nov-09<br />
Feb-10<br />
May-10<br />
Aug-10<br />
Nov-10<br />
Feb-11<br />
May-11<br />
Aug-11<br />
Earnings Growth<br />
(FY11-13)<br />
Comment (%) Score<br />
22 9<br />
21 7<br />
13 6<br />
22 8<br />
16 6<br />
21 6<br />
12 5<br />
24 9<br />
55 3<br />
130<br />
120<br />
110<br />
100<br />
90<br />
80<br />
Aug-10<br />
Stock<br />
attractiveness<br />
Comment Score<br />
Neutral 13<br />
Top pick 14<br />
Top pick 14<br />
Top pick 14<br />
Buy 14<br />
Neutral 12<br />
Neutral 12<br />
Neutral 10<br />
Sell 9<br />
... and also in the last 1 year<br />
Oct-10<br />
Dec-10<br />
Feb-11<br />
Apr-11<br />
Jun-11<br />
Aug-11<br />
August 2011
Thematic Report | Sector: Pharmaceuticals<br />
Domestic Formulations<br />
Summary<br />
<strong>New</strong> <strong>peaks</strong> - USD21b opportunity by 2015<br />
4 A's. 4 ailments. 4 buys<br />
4 A's - Lead to USD21b opportunity by 2015<br />
The India domestic pharma story is founded on 4 pillars, what we call the 4 A's -<br />
A #1 - Affordability<br />
Medicines are becoming more affordable led by (1) Rising per capita income, (2)<br />
Urbanization, and (3) Higher penetration of health insurance. This is driving the growth in<br />
the domestic pharma market.<br />
A #2 - Access<br />
People's access to medicines is improving given (1) Rising government spend on healthcare,<br />
(2) India's improving medical infrastructure, and (3) Companies' thrust on increasing rural<br />
reach. All are combined to further expand the domestic pharma market.<br />
Companies covered<br />
Top buys<br />
• Cipla<br />
• Lupin<br />
• Torrent Pharma<br />
• GSK Pharma<br />
Others<br />
• Sun Pharma<br />
• Cadila<br />
• Ranbaxy<br />
• Dr. Reddy's Labs<br />
• Glenmark<br />
Indian pharma mkt (INR b)<br />
Approach 1 (pg 5) 983<br />
Approach 2 (pg 6) 936<br />
Approach 3 (pg 6) 962<br />
Average 960<br />
USD b 21<br />
A #3 - Awareness<br />
Health awareness in India is rising on the back of (1) Improving literacy, and (2) Rising<br />
penetration of media. This serves as an undercurrent for sustaining pharma demand.<br />
A #4 - Ailments<br />
As a trend, incidence of chronic/lifestyle ailments (cardiovascular, central nervous system,<br />
diabetes) is rising compared to acute ailments. Medicine demand from these segments<br />
will grow faster than the rest of the Indian pharma market.<br />
Based on the past data and present trends, we have estimated the 2015 (FY16) Indian<br />
pharma market using three different approaches -<br />
• Approach 1 (Affordability-based): Correlation between per capita GDP and per<br />
capita pharma consumption<br />
• Approach 2 (Access-based): Trend in pharmacies and sales per pharmacy<br />
• Approach 3 (Ailment-based): Summation of various ailment segment sizes.<br />
Averaging the figure using the three approaches, we estimate the 2015 Indian domestic<br />
market size at INR960b (USD21b) i.e. a CAGR of 16% over 2010-15 (FY11-FY16).<br />
4 ailments - CVS, anti-diabetics, anti-infectives and CNS are high<br />
potential segments<br />
We believe that chronic therapies like Cardiovascular (CVS), anti-diabetics and Central<br />
Nervous System (CNS) will account for a major chunk of the incremental market over<br />
the next 5 years. Also, with rising income levels in the rural areas, anti-infectives will also<br />
record good growth over the same period. We believe these four will be the key segments<br />
of the future, and garner more than 50% of the delta in the Indian formulations market,<br />
2015 over 2010.<br />
August 2011 1
Domestic Formulations | <strong>New</strong> Peaks<br />
We juxtaposed the incremental opportunity of various therapeutic segments against the<br />
number of existing players in each of these segments, to arrive at the following plot.<br />
CVS, Anti-infectives, Diabetes and CNS are large segments with relatively fewer players<br />
Top 4 ailment<br />
segments are<br />
mainly based on<br />
Attractiveness Factor,<br />
which is highest for<br />
CVS, Diabetes, Antiinfectives<br />
and CNS<br />
in that order<br />
No. of Players<br />
Incremental mkt size (INR b) 2010-15E<br />
0 20 40 60 80 100<br />
0<br />
10<br />
20<br />
30<br />
40<br />
Gynaecology<br />
Vitamins<br />
Dermatology<br />
CNS<br />
AF - 215<br />
Pain<br />
Diabetes<br />
AF - 396<br />
AI<br />
AF - 337<br />
Respiratory<br />
AF - 147<br />
GI<br />
AF - 109<br />
CVS<br />
AF - 400<br />
Note: AF is Attractiveness Factor of segment, which is defined by the incremental size of the opportunity<br />
per player<br />
Source: Industry/MOSL<br />
Our key conclusions from this chart:<br />
1. As discussed before, CVS, Anti-infectives, Diabetes and CNS will record maximum<br />
share of incremental market (the size of bubble indicates this).<br />
2. We also note that the attractiveness factor (i.e. incremental segment market size<br />
divided by number of players) is most favorable for these segments.<br />
3. Hence, companies which enjoy strong positioning in these segments will be able to<br />
generate maximum value from their respective domestic formulations businesses.<br />
Valuation summary<br />
EPS CAGR P/E (x)<br />
(FY11-13) (FY13)<br />
Cipla 16.7 17<br />
Lupin 15.3 18<br />
Torrent Pharma 22.1 12<br />
GSK Pharma 14.2 24<br />
Sun Pharma 24.1 22<br />
Cadila 15.3 20<br />
Ranbaxy 53.1 23<br />
DRL 11.2 18<br />
Glenmark 25.8 16<br />
4 buys - Cipla, Lupin, Torrent Pharma and GSK Pharma<br />
Having identified the most attractive ailment segments, we have adopted two approaches<br />
to arrive at our top plays on India's domestic formulations opportunity:<br />
• Approach 1: 3-screen shortlisting process as follows:<br />
‣ Screen #1: Identify companies with dominating presence in high-potential ailment<br />
segments<br />
‣ Screen #2: Of the above, exclude companies with unfavorable non-domestic<br />
business<br />
‣ Screen #3: Juxtapose the Screen #2 surviving companies vis-à-vis earnings growth<br />
and valuation<br />
• Approach 2: MEDICINES score, based on nine key success factors for picking<br />
domestic formulation stocks<br />
Approach 1: 3-screen shortlisting process<br />
Screen #1: Identify companies with dominating presence in high-potential ailment<br />
segments<br />
The chart below maps the positioning of pharmaceutical players in the key therapeutic<br />
segments of CVS, Diabetes, anti-infectives and CNS. We have plotted the dominance of<br />
each player in these respective segments using prescription market share as the key<br />
measure of dominance.<br />
August 2011 2
Domestic Formulations | <strong>New</strong> Peaks<br />
Company mapping with respect to therapeutic classes<br />
High<br />
Sun Pharma,<br />
Torrent, Cadila,<br />
Cipla, Unichem,<br />
Ranbaxy, Lupin<br />
Abbott, U S V,<br />
Aventis,<br />
Sun Pharma<br />
Ranbaxy, Alkem,<br />
Aristo, Cipla,<br />
GSK Pharma,<br />
Piramal<br />
Sun Pharma, Intas,<br />
Torrent, Abbott,<br />
Piramal<br />
Cipla, GSK Pharma<br />
Dominance<br />
Medium<br />
Aventis, U S V,<br />
Emcure, Piramal,<br />
Dr Reddy's, Intas,<br />
Micro Labs<br />
Eli Lilly, Piramal,<br />
Micro Labs, Lupin<br />
Alembic,Mankind,<br />
FDC, Macleods,<br />
Lupin<br />
Aventis, Ranbaxy,<br />
Unichem,<br />
Micro Labs<br />
Cadila, Piramal,<br />
Ranbaxy<br />
Low<br />
IPCA Labs,<br />
AstraZeneca,<br />
Pfizer<br />
Panacea,<br />
Ranbaxy<br />
Novartis, Cipla,<br />
Lupin<br />
Pfizer, Mankind,<br />
Dr Reddy's,<br />
Sun Pharma,<br />
Glenmark, Biocon<br />
Companies in bold have been covered in this report<br />
CVS Diabetes Anti-infectives CNS<br />
Others<br />
Source: MOSL<br />
Screen #2: Most Indian companies are not pure-plays; view on non-domestic<br />
business is also important<br />
It is imperative to map the domestic and the non-domestic businesses of companies to<br />
take an overall view on them, as depicted below.<br />
Company mapping relative to the attractiveness of domestic and international business<br />
Sun Pharma,<br />
3 of our 4<br />
top picks are<br />
favorably placed<br />
in both their<br />
domestic and<br />
international<br />
businesses<br />
International Business<br />
Favourable<br />
Neutral<br />
Unfavourable<br />
Glenmark<br />
Pharma<br />
Dr Reddy<br />
Cipla, Lupin,<br />
Cadila,<br />
Torrent Pharma<br />
Ranbaxy,<br />
GSK Pharma<br />
Note: Only companies<br />
covered in this report have<br />
been mapped<br />
Unfavourable Neutral Favourable<br />
Domestic Business<br />
Source: MOSL<br />
Screen #3: Juxtapose the Screen #2 shortlisted companies vis-à-vis earnings<br />
growth and valuation<br />
We plotted the Screen #2 shortlisted companies in a matrix of FY11-13E EPS CAGR and<br />
FY11 P/E as depicted below. Based on the same, the top picks are Cipla, Lupin and<br />
Torrent Pharma. We are also positive on GSK Pharma as we believe it deserves premium<br />
valuation due to strong parentage (giving access to large product pipeline), brand-building<br />
ability, industry-best RoCE of over 45% and likely positioning in post patent era.<br />
August 2011 3
Domestic Formulations | <strong>New</strong> Peaks<br />
Earnings growth v/s Valuation: Cipla, Torrent, Lupin on top ...<br />
... GSK merits rich valuation due to superior return ratios<br />
FY11 P/E (x)<br />
40<br />
30<br />
Dr Reddy<br />
20<br />
GSK<br />
Cadila<br />
Lupin Cipla<br />
Ranbaxy (53%, 65x)<br />
Sun<br />
Glenmark<br />
Torrent<br />
22<br />
25<br />
RoCE (%) Adj. RoCE (%) Very high due<br />
to -ve capital<br />
employed<br />
26<br />
22 23<br />
19<br />
16<br />
47<br />
14<br />
17 16<br />
7 28 27<br />
13<br />
15<br />
25<br />
10<br />
10.0 14.0 18.0 22.0 26.0 30.0<br />
FY11-13E EPS CAGR (%)<br />
Note - Adj. RoCE - RoCE adjusted for other income in P&L and Cash in Balance sheet<br />
RoCE and Adj. RoCE are average of FY11-13<br />
Sun<br />
Cipla<br />
Source: MOSL<br />
Approach 2: The MEDICINES score<br />
We have identified nine key success factors (KSFs) for shortlisting Indian pharma<br />
companies and their stocks. These success factors correspond to the initials of the word<br />
"MEDICINES". We have rated the companies on these KSFs to arrive at a final<br />
"MEDICINES Score" out of a maximum possible 100. The companies with the highest<br />
MEDICINES Score are the most attractive investment ideas.<br />
We have considered the following KSFs for evaluating the domestic formulations business<br />
(see box on page 21 for explanation). Our MEDICINES Scorecard is given below.<br />
DRL<br />
Ranbaxy<br />
Cadila<br />
Lupin<br />
GSK<br />
Glenmark<br />
Torrent<br />
MEDICINES<br />
Measures<br />
M<br />
E<br />
D<br />
I<br />
C<br />
I<br />
N<br />
E<br />
S<br />
Mix & Market share<br />
Equity with doctors<br />
Distribution & reach<br />
Introductions<br />
CAGR & scale-up<br />
Improvement in MR productivity<br />
Non-domestic business<br />
Earnings growth<br />
Stock attractiveness<br />
4 of the top 5<br />
MEDICINES score<br />
companies<br />
correspond with<br />
Approach 1. We<br />
are Neutral on Sun<br />
only due to rich<br />
valuations<br />
Indian domestic pharma players: The MEDICINES scorecard<br />
M E D I C I N E S Total<br />
Sun 7 9 8 6 9 9 7 9 13 77<br />
Cipla 6 7 8 6 6 7 5 7 14 66<br />
GSK Pharma ** 4 9 7 3 6 9 - 6 14 64<br />
Lupin 5 6 6 6 8 5 6 6 14 62<br />
Torrent Pharma 6 7 6 5 6 3 6 8 14 61<br />
Cadila 6 7 7 5 6 5 6 6 12 60<br />
Dr. Reddy's Labs 4 6 6 4 6 2 7 5 12 52<br />
Glenmark 2 3 5 6 6 5 3 9 10 49<br />
Ranbaxy 6 5 7 5 6 3 5 3 9 49<br />
** GSK Pharma score pro-rated as rating for Non-domestic business is not applicable Source: MOSL<br />
4 buys: Cipla, Lupin, Torrent, GSK Pharma<br />
4 of the top 5 MEDICINES score companies correspond with Approach 1. Thus, combining<br />
both Approaches 1 and 2, our top picks are Cipla, Lupin, Torrent and GSK Pharma.<br />
We are Neutral on Sun Pharma only due to rich valuations.<br />
August 2011 4
Domestic Formulations | <strong>New</strong> Peaks<br />
Financial & valuation summary<br />
Company<br />
Cipla<br />
Year Net Sales PAT EPS EPS P/E P/BV RoE RoCE EV/ EV/<br />
End (INR M) (INR M) (INR) GR. (%) (X) (X) (%) (%) Sales EBITDA<br />
03/11A 63,145 9,671 12.0 -3.7 23.3 3.4 14.5 15.8 3.6 17.4<br />
03/12E 69,193 10,760 13.4 11.1 21.0 3.0 14.4 17.2 3.3 14.5<br />
03/13E 79,041 13,177 16.4 22.2 17.1 2.7 15.6 18.8 2.8 12.1<br />
Lupin<br />
Torrent<br />
Pharma<br />
GSK Pharma<br />
03/11A 57,068 8,582 19.3 25.9 23.3 6.1 29.3 25.1 3.6 19.5<br />
03/12E 64,784 9,913 22.3 15.5 20.2 5.0 27.1 28.2 3.2 16.8<br />
03/13E 74,127 11,418 25.7 15.2 17.5 4.1 25.7 27.1 2.7 13.8<br />
03/11A 22,265 2,702 31.9 0.8 18.4 4.9 29.2 24.1 2.3 12.4<br />
03/12E 25,596 3,392 40.1 25.6 14.7 3.8 29.3 24.9 1.9 9.6<br />
03/13E 29,817 4,029 47.6 18.8 12.4 3.1 27.7 25.1 1.6 8.0<br />
12/10A 21,116 5,814 68.6 15.2 31.4 9.5 30.1 44.8 7.6 21.9<br />
12/11E 23,740 6,567 77.5 12.9 27.8 8.7 31.3 46.3 6.8 20.2<br />
12/12E 26,921 7,586 89.6 15.5 24.1 8.0 33.4 49.5 5.9 17.2<br />
Sun Pharma<br />
** Includes<br />
Para-IV/oneoff<br />
upsides<br />
Cadila<br />
Ranbaxy<br />
03/11A** 57,214 18,161 17.5 34.4 26.5<br />
03/12E 65,601 17,952 17.3 27.9 26.8 4.4 17.7 20.5 6.6 20.8<br />
03/13E 75,976 21,626 20.9 20.5 22.2 3.9 18.5 22.2 5.5 16.7<br />
03/11A 46,302 6,334 30.9 26.4 26.6 7.8 37.5 30.5 3.8 17.2<br />
03/12E 51,717 5,801 28.3 -8.4 29.1 6.2 27.3 25.4 3.4 17.2<br />
03/13E 59,983 8,419 41.1 45.1 20.0 5.0 27.6 27.2 2.9 14.0<br />
12/10A 89,608 10,855 25.8 467.1 15.2 2.9 19.4 15.9 2.3 11.1<br />
12/11E 85,242 4,991 11.9 -54.0 33.0 2.7 11.4 10.7 2.4 23.0<br />
12/12E 93,005 7,052 16.7 41.3 23.3 2.4 10.4 11.1 2.2 18.5<br />
Dr. Reddy's<br />
Glenmark<br />
03/11A 74,693 11,099 65.6 - 21.6 5.3 24.1 16.7 3.5 16.7<br />
03/12E 81,754 11,615 68.6 7.8 20.7 4.7 22.5 15.4 3.2 17.1<br />
03/13E 90,323 13,725 81.1 18.2 17.5 4.2 23.5 17.0 2.9 14.4<br />
03/11A 29,491 3,548 12.5 7.2 25.5 4.2 17.4 13.4 3.6 17.7<br />
03/12E 37,007 4,584 16.1 29.2 19.7 3.2 17.0 15.3 2.8 10.4<br />
03/13E 40,693 5,612 19.7 22.4 16.1 2.6 17.1 16.3 2.5 11.1<br />
Domestic Formulations (DF) Index is an outperformer over 5 years ...<br />
... and also in the last 1 year<br />
250<br />
200<br />
150<br />
100<br />
Sensex BSE Healthcare Index DF Index<br />
130<br />
120<br />
110<br />
100<br />
90<br />
50<br />
80<br />
Aug-06<br />
Nov-06<br />
Feb-07<br />
May-07<br />
Aug-07<br />
Nov-07<br />
Feb-08<br />
May-08<br />
Aug-08<br />
Nov-08<br />
Feb-09<br />
May-09<br />
Aug-09<br />
Nov-09<br />
Feb-10<br />
May-10<br />
Aug-10<br />
Nov-10<br />
Feb-11<br />
May-11<br />
Aug-11<br />
Aug-10<br />
Oct-10<br />
Dec-10<br />
Feb-11<br />
Apr-11<br />
Jun-11<br />
Aug-11<br />
All indices re-based to 100<br />
August 2011 5
Domestic Formulations | <strong>New</strong> Peaks<br />
Main Report<br />
4 A's and 4 Ailments<br />
To drive USD21b opportunity by 2015, 2x over 2010<br />
The India domestic pharma story is founded on 4 pillars, what we call the 4 A's -<br />
A #1<br />
A #2<br />
A #3<br />
A #4<br />
Affordability<br />
Medicines are becoming more affordable led by (1) Rising per capita income, (2)<br />
Urbanization, and (3) Higher penetration of health insurance. This is driving the growth in<br />
the domestic pharma market (see page 9).<br />
Access<br />
People's access to medicines is improving given (1) Rising government spend on healthcare,<br />
(2) India's improving medical infrastructure, and (3) Companies' thrust on increasing rural<br />
reach. All are combined to further expand the domestic pharma market (see page 12).<br />
Awareness<br />
Health awareness in India is rising on the back of (1) Improving literacy, and (2) Rising<br />
penetration of media. This serves as an undercurrent for sustaining pharma demand (see<br />
page 14).<br />
Ailments<br />
As a trend, incidence of chronic/lifestyle ailments (cardiovascular, central nervous system,<br />
diabetes) is rising compared to acute ailments. Medicine demand from these segments<br />
will grow faster than the rest of the Indian pharma market (see page 15).<br />
USD21b opportunity by 2015<br />
Based on the past data and present trends, we have estimated the 2015 (FY16) Indian<br />
pharma market using three different approaches -<br />
• Approach 1 (Affordability-based): Correlation between per capita GDP and per<br />
capita pharma consumption<br />
• Approach 2 (Access-based): Trend in pharmacies and sales per pharmacy<br />
• Approach 3 (Ailment-based): Summation of various ailment segment sizes.<br />
Averaging the market size arrived using each approach, we estimate the total India market<br />
size at USD21b by 2015. We discuss below the methodology under the three approaches.<br />
Approach 1: Affordability-based<br />
Correlation between per capita GDP and per capita pharma consumption<br />
Approach 1: Affordability<br />
Market size: INR983b<br />
We see a strong correlation between India's per capita GDP and per capita pharma<br />
consumption. With rising income, pharmaceuticals accounts for a higher share of overall<br />
household spend, as indicated by the rising multiplier of per capita pharma consumption<br />
CAGR to per capita GDP CAGR. Thus, FY01-06, per capita pharma consumption CAGR<br />
was 8.7%, 0.8x of per capita GDP CAGR. Over the next five years (FY06-11), per capita<br />
pharma consumption CAGR rose to 12.9%, and the multiplier increased to 1.1x.<br />
August 2011 6
Domestic Formulations | <strong>New</strong> Peaks<br />
We estimate FY11-16 per capita GDP CAGR of 12%. Applying a 1.3x multiplier, we<br />
arrive at FY16 per capita pharma spend of INR784. Multiplying by the then expected<br />
population, we estimate the pharma market size at INR983b, a CAGR of 15% from current<br />
level of INR465b.<br />
2015 Indian pharma market estimate: Affordability approach<br />
Per capita Per capita Multiplier Pharma<br />
GDP pharma conspn. (x) market<br />
INR CAGR (%) INR CAGR (%) INR b CAGR (%)<br />
(1) (2) (3) (4) (5) = (4) / (2) (6) (7)<br />
FY01 20,786 - 140 - - 151 -<br />
FY06 33,827 10.2 212 8.7 0.8 230 8.9<br />
FY11 60,048 12.2 390 12.9 1.1 465 15.1<br />
FY16 105,668 12.0 784 15.0 1.3 983 15.0<br />
Source: Industry/MOSL<br />
Approach 2: Access-based<br />
Trend in pharmacies and sales per pharmacy<br />
Our methodology here is as follows -<br />
• Consider the growth in number of pharmacies in 2005 over 2000, and 2010 over 2005<br />
• Calculate the CAGR in average market size per pharmacy over 5-year time frames<br />
• Extrapolate both of the above for 2015 to arrive at the pharma market size.<br />
Approach 2: Access<br />
Market size: INR936b<br />
2015 Indian pharma market estimate: Access approach<br />
Year Pharmacies CAGR M k t Mkt/Pharmacy CAGR<br />
(%) (INR b) (INR) (%)<br />
2000 322,023 - 151 467,420 -<br />
2005 410,992 5.0 230 559,622 3.7<br />
2010 550,000 6.0 465 846,018 8.6<br />
2015 736,024 6.0 936 1,272,121 8.5<br />
Note: As precise data on pharmacies is not available, we have back calculated number of pharmacies for<br />
2005 and 2000 based on the 2010 estimate of 550,000 pharmacies and long-term CAGR of 4.5%<br />
Source: Industry/MOSL<br />
Approach 3: Ailments-based<br />
Summation of various ailment segment sizes<br />
Approach 3: Ailments<br />
Market size: INR962b<br />
The Indian pharma market can be broken down into 10 major therapeutic segments. We<br />
have analyzed the 2000-2010 growth trend in each of these segments. Going forward, we<br />
believe the growth will accelerate, especially in chronic ailment therapeutic segments<br />
such as CVS, CNS and anti-diabetics.<br />
Adding up the individual segments in 2015, we arrive at the total Indian pharma market<br />
size of INR962b.<br />
August 2011 7
Domestic Formulations | <strong>New</strong> Peaks<br />
2015 Indian pharma market estimate: Ailment approach (INR b)<br />
Market CAGR M k t Incremental<br />
size (%) size mkt - 2015<br />
2000 2005 2010 00-05 05-10 10-15E 2015E over 2010<br />
Anti-diabetic 5 10 27 17.2 22.1 25 83 56<br />
CVS 13 24 53 13.3 17.1 21 137 84<br />
CNS 7 17 26 19.6 9.4 20 65 39<br />
Gastrointestinal 17 24 51 8.0 16.2 15 103 52<br />
Respiratory 16 22 41 6.5 13.5 15 82 41<br />
Dermatology 8 13 25 8.7 15.1 15 51 26<br />
Anti-infectives 29 47 80 10.5 11.2 13 147 67<br />
Gynaecology 9 8 26 -2.3 26.9 13 49 22<br />
Pain/Analgesic 14 21 40 7.6 14.3 11 68 28<br />
Vitamins/Minerals 15 28 36 12.9 5.4 10 58 22<br />
Others 19 18 59 -1.3 27.6 15 119 60<br />
Total 151 212 406 7.1 13.8 15.7 962 436<br />
Source: Industry/MOSL<br />
2015 Indian domestic pharma market of USD21b<br />
Average of the three approaches<br />
Indian pharma mkt (INR b)<br />
Approach 1 983<br />
Approach 2 936<br />
Approach 3 962<br />
Average 960<br />
USD b 21<br />
Averaging the figure arrived using the three approaches, we estimate the 2015 Indian<br />
domestic market size at INR960b (USD21b) i.e. a CAGR of 16% over 2010-15 (FY11-<br />
FY16).<br />
Independently, McKinsey has also estimated the Indian domestic pharma market after<br />
considering factors like income demographics, medical infrastructure, disease incidence<br />
and penetration of health insurance. It estimates 2015 market size of USD20b (INR920b<br />
@ INR/USD of 46). In the process, India will improve its global rank in terms of value<br />
from 14 currently to top 10 by year 2015.<br />
Accelerating growth in domestic formulation market India will be among world's top 10 pharma markets by 2015<br />
(USD b)<br />
9.3% CAGR<br />
14.2% CAGR<br />
3.3 3.5 3.7 4.1 4.7 5.2 6.0 7.5 7.9 8.3 10.2<br />
15.6% CAGR<br />
21.0<br />
444<br />
1.8<br />
2015 market size (US$b) Grow th over 2005 (x)<br />
3.3<br />
2.9<br />
2.2<br />
1.2 1.4 1.7 1.8 1.9 1.9<br />
2.1<br />
1.9<br />
1.2 1.3<br />
82<br />
46 38 25 32 25 25 38 19 20 15 15 20<br />
2000<br />
2001<br />
2002<br />
2003<br />
2004<br />
2005<br />
2006<br />
2007<br />
2008<br />
2009<br />
2010<br />
2011<br />
2012<br />
2013<br />
2014<br />
2015<br />
US<br />
Japan<br />
France<br />
Germany<br />
Italy<br />
UK<br />
Spain<br />
Canada<br />
China<br />
Mexico<br />
Brazil<br />
South Korea<br />
Turkey<br />
India<br />
Source: Mckinsey/MOSL<br />
We proceed to discuss the key issues under each of the 4 As, culminating in the<br />
MEDICINES framework to zero-in on our top picks.<br />
August 2011 8
Domestic Formulations | <strong>New</strong> Peaks<br />
A #1 - Affordability<br />
Rising per capita income, urbanization, and health insurance penetration will drive<br />
pharma spend<br />
A #1 Affordability<br />
India's NTD journey will steadily drive up per capita income<br />
In 2007, we published our first note on the concept of NTD (next trillion dollar of India's<br />
GDP). The core NTD thesis is this: It took India about 60 years post independence to<br />
clock the first trillion dollar of GDP. With nominal GDP growth of 14-15%, at constant<br />
exchange rates, India's next trillion dollar (NTD) will come in just 4-5 years.<br />
Every successive trillion dollar GDP would take lesser time and by 2020 India would<br />
comfortably reach a USD5t GDP assuming 8% real GDP growth coupled with 5% estimated<br />
inflation.<br />
India's NTD era — next trillion dollar of GDP getting added in successively lower time (USD b)<br />
By FY20<br />
India GDP would<br />
triple from the<br />
current level and<br />
be almost ~5<br />
times the level of<br />
FY08<br />
21<br />
33<br />
57<br />
150<br />
293<br />
1st USD tn<br />
58 years<br />
2nd USD tn<br />
4 years<br />
451<br />
461<br />
479<br />
508<br />
600<br />
721<br />
837<br />
946<br />
1,230<br />
1,214<br />
1,314<br />
1,728<br />
1,969<br />
2,263<br />
2,566<br />
2,909<br />
3,299<br />
3,741<br />
4,243<br />
3rd USD tn<br />
3.5 years<br />
4th USD tn<br />
2 years<br />
5th USD tn<br />
1.5 years<br />
Source: MOSPI/MOSL<br />
With population growing at a much lower rate than GDP, India's per capita GDP will keep<br />
rising steadily for the next several years.<br />
India's per capita GDP is steadily rising (INR)<br />
20,786<br />
22,156<br />
23,476<br />
25,929<br />
30,017<br />
33,827<br />
11.5% CAGR<br />
38,519<br />
43,844<br />
48,696<br />
53,679<br />
60,048<br />
FY01<br />
67,195<br />
75,214<br />
84,215<br />
94,320<br />
FY02<br />
105,668<br />
FY03<br />
FY04<br />
FY05<br />
FY06<br />
FY07<br />
FY08<br />
FY09<br />
FY10<br />
FY11<br />
FY12<br />
FY13<br />
FY14<br />
FY15<br />
FY16<br />
FY51<br />
FY60<br />
FY70<br />
FY80<br />
FY90<br />
FY00<br />
FY01<br />
FY02<br />
FY03<br />
FY04<br />
FY05<br />
FY06<br />
FY07<br />
FY08<br />
FY09<br />
4,811<br />
5,456<br />
FY10<br />
FY11<br />
FY12E<br />
FY13E<br />
FY14E<br />
FY15E<br />
FY16E<br />
FY17E<br />
FY18E<br />
FY19E<br />
FY20E<br />
India's<br />
rising per capita<br />
GDP augurs well<br />
for domestic<br />
pharma market<br />
Source: MOSPI/MOSL<br />
August 2011 9
Domestic Formulations | <strong>New</strong> Peaks<br />
Higher per capita income will boost spend on pharmaceuticals<br />
There is a direct co-relation between per capita income and spend on healthcare, including<br />
pharmaceuticals. Currently, India has one of the world's lowest per capita spend on<br />
pharmaceuticals. As India's per capita income grows going forward, healthcare spend is<br />
expected to witness one of the highest growth rate among all categories over the next two<br />
decades. Healthcare spend is expected to grow to 13% of GDP by 2025.<br />
India has one of the lowest per capita spend on pharmaceuticals % of avg. household income spent on healthcare<br />
700<br />
620<br />
(USD)<br />
US<br />
France<br />
11<br />
15.7<br />
490<br />
450<br />
420<br />
370<br />
280<br />
Germany<br />
10.4<br />
Canada<br />
10.1<br />
Australia<br />
8.9<br />
220 200<br />
130 120<br />
Italy<br />
8.7<br />
60 60<br />
20 10<br />
8<br />
55<br />
Brazil<br />
UK<br />
Japan<br />
8.4<br />
8.4<br />
8<br />
USA<br />
Japan<br />
Canada<br />
France<br />
Germany<br />
Spain<br />
Italy<br />
UK<br />
Romania<br />
Russia<br />
Turkey<br />
Brazil<br />
Mexico<br />
China<br />
Pakistan<br />
India<br />
BRICS (avg)<br />
Russia<br />
China<br />
India<br />
5.4<br />
4.3<br />
4.1<br />
Source: Industry/MOSL<br />
BRICs healthcare as % of GDP<br />
India is the lowest<br />
8.4<br />
5.2<br />
4.3 4.0<br />
Brazil Russia China India<br />
Large population with low healthcare penetration presents huge<br />
opportunity<br />
India has 16% of the world's population, yet only accounts for 1% of the total amount<br />
spent on health globally. India's expenditure on health amounted to 4% of GDP (2008),<br />
substantially lower than developed markets and even BRIC peers - Brazil (8.4%), Russia<br />
(5.2%) and China (4.3%).<br />
Further, public health expenditure accounted for less than 30% of India's total healthcare<br />
costs (2008), reflecting the very basic level of healthcare provided by the government,<br />
which is insufficient to meet the health needs of the entire population. In comparison,<br />
BRIC peer governments accounted for ~50% of their respective country's healthcare<br />
spend.<br />
Going forward, economic growth coupled with improving government finances should<br />
narrow the gap, implying growth in pharma demand.<br />
Share of tier-1 markets in<br />
pharma demand (%)<br />
Rising urbanization is a positive<br />
63<br />
62<br />
61<br />
60 60<br />
2006 2007 2008 2009 2010<br />
Urbanization: a positive for pharma demand<br />
Increasing urbanization leads to higher demand for pharma products based on factors<br />
such as (1) higher affordability, (2) better medical infrastructure, and (3) wider prevalence<br />
of chronic diseases. Share of India's tier-1 markets has increased from 60% in 2006 to<br />
63% in 2010. Thus, the trend of rising urbanization in India is a key positive for growth in<br />
pharma demand.<br />
August 2011 10
Domestic Formulations | <strong>New</strong> Peaks<br />
Metro and Tier-1 cities market share up from<br />
60% in 2006 to 63% in 2010<br />
India - population distribution<br />
METROS CLASS I TOWNS CLASS II TO VI RURAL<br />
21 21 20 18 17<br />
19 19 19 19 20<br />
33 31 32 32 32<br />
}Tier-1<br />
mkt<br />
28 29 29 30 31<br />
72<br />
28<br />
71<br />
29<br />
Urban population (%) Rural Population (%)<br />
70 70 68 66 63<br />
60 57<br />
53 51<br />
43 47<br />
40<br />
34 37<br />
49<br />
30 30 32<br />
54<br />
46<br />
CY2006 CY2007 CY2008 CY2009 CY2010<br />
2000<br />
2005<br />
2009<br />
2010<br />
2015<br />
2020<br />
2025<br />
2030<br />
2035<br />
2040<br />
2045<br />
2050<br />
Source: Industry/MOSL<br />
Rising health insurance penetration to improve affordability<br />
Currently around 300 million people in India are covered under health insurance, and this<br />
number is expected to double by 2020. Going forward, health insurance should get a boost<br />
by way of various regulatory reforms like non-life tariff deregulation, lower capital<br />
requirements for players, increase in FDI limit, etc.<br />
Increasing penetration of health insurance over the next few years will spur demand for<br />
pharmaceuticals as it becomes possible for patients to afford more sophisticated and more<br />
expensive therapies.<br />
Health insurance penetration in India is rising<br />
Per capita premium almost quadruples in 5 years (INR)<br />
Premium (INR (Rs b) b)<br />
0.07%<br />
0.06%<br />
32.1<br />
22.2<br />
Premium (% of GDP)<br />
0.12%<br />
0.10%<br />
66.3<br />
51.3<br />
0.13%<br />
83.1<br />
20.3<br />
28.9<br />
45.4<br />
57.9<br />
71.5<br />
FY06 FY07 FY08 FY09 FY10<br />
FY06 FY07 FY08 FY09 FY10<br />
Source: IRDA/MOSL<br />
August 2011 11
Domestic Formulations | <strong>New</strong> Peaks<br />
A #2 - Access<br />
Rising government spend on healthcare, better infrastructure will improve<br />
availability<br />
A #2 - Access<br />
Rising government spend on healthcare<br />
Healthcare for all is high on the agenda of the present Indian government. This was<br />
demonstrated in the union budget for 2010-2011, when the healthcare expenditure outlay<br />
was increased to USD5.95b from less than a USD5.17b allocated in 2009-10. The budget<br />
allocation has been significantly increased for rural healthcare, with the government also<br />
announcing plans to set up six "All India Institute of Medical Sciences "(AIIMS) institutions<br />
across the country.<br />
Government spending on healthcare will play a major role in increasing the penetration of<br />
pharmaceuticals especially in rural areas. Government spend has grown at 18% CAGR<br />
over FY06-09 and is translating into higher level of access in Tier II and rural markets.<br />
Under Rashtriya Swasthya Bima Yojna (National Health Insurance Scheme), the<br />
government plans to create health cover for approximately 400m people; 19m families<br />
have already been covered and implementation seems to be on track.<br />
Going forward, the government has announced plans to take its spending on healthcare to<br />
3% of GDP from the current level of about 1%. Rising government spend on healthcare<br />
improves people's access to medicines, helping pharma demand.<br />
Rising government spend on healthcare Allocation under National Rural Health Mission (INR b)<br />
Helathcare Healthcare Exp (Rs (INR b) b) Grow th (%)<br />
21.3<br />
19.3<br />
16.9<br />
14.7<br />
10.1<br />
10.5 9.5<br />
22.7<br />
10.0<br />
67.3<br />
90<br />
108.9<br />
119.3<br />
140.5<br />
2.1<br />
280<br />
286<br />
FY01<br />
FY02<br />
FY03<br />
FY04<br />
FY05<br />
FY06<br />
FY07<br />
FY08<br />
FY09<br />
FY10<br />
FY11<br />
315<br />
348<br />
415<br />
454<br />
521<br />
632<br />
739<br />
907<br />
997<br />
FY06 FY07 FY08 FY09 FY10<br />
Source: Economic Survey, Union Budget 2011<br />
Source: Ministry of Health/MOSL<br />
Improving healthcare infrastructure<br />
The healthcare infrastructure in India is likely to improve and will be a critical growth<br />
driver for pharmaceuticals. Currently, India's healthcare infrastructure is at nascent stage<br />
compared to western countries. India has only 9 hospital beds per 10,000 people compared<br />
to 30-40 in US and Western Europe. Even other developing countries like Brazil, China<br />
and Thailand fare much better than India with 24-30 beds per 10,000. Industry data suggests<br />
the number of hospital beds in India is likely to double by 2015.<br />
Likewise, India's current doctor-population ratio at 5 per 10,000 is the lowest among major<br />
countries. However, with rising number of students gaining admission to medical colleges,<br />
this ratio is set to improve going forward. Further, diagnostic laboratory services market<br />
(estimated at USD750m) is expected to grow @ 20-25% p.a. over the next few years.<br />
August 2011 12
Domestic Formulations | <strong>New</strong> Peaks<br />
Hospital beds per 10,000 - India among world's lowest<br />
Doctors per 10,000 people - India the lowest the among<br />
world majors<br />
Japan<br />
Russia<br />
Germany<br />
France<br />
A us tralia<br />
Italy<br />
UK<br />
Canada<br />
US<br />
China<br />
Brazil<br />
India<br />
9<br />
39<br />
39<br />
39<br />
34<br />
31<br />
30<br />
24<br />
72<br />
83<br />
97<br />
139<br />
Russia<br />
Ita ly<br />
Germany<br />
France<br />
Argentina<br />
US<br />
A us tralia<br />
UK<br />
Mexico<br />
Japan<br />
Brazil<br />
China<br />
Pakis tan<br />
India<br />
5<br />
7<br />
11<br />
12<br />
20<br />
20<br />
26<br />
25<br />
23<br />
30<br />
34<br />
34<br />
43<br />
42<br />
Students entering medical colleges and number of<br />
colleges - rising trend<br />
Source: WHO<br />
No. of allopathic doctors registered with state medical<br />
councils - Rising trend here as well<br />
No of medical colleges in India<br />
757,377<br />
No of students entering medical colleges ('000)<br />
736,743<br />
25<br />
26<br />
29<br />
30<br />
33<br />
35<br />
682,080<br />
708,043<br />
7<br />
18<br />
189<br />
229 242 262 266 289 300<br />
660,856<br />
165<br />
FY96 FY01 FY05 FY06 FY07 FY08 FY09 FY10<br />
2005 2006 2007 2008 2009<br />
Source: National Health Profile<br />
Companies are focusing on increasing their rural reach<br />
Currently around 67 per cent of India's population or 742 million people live in rural areas,<br />
but rural markets contribute to only 17 per cent of the overall pharmaceutical market's<br />
sales. In the last few years both MNCs and Indian pharma companies are increasing their<br />
attention to tier 2 markets. The above-mentioned factors, namely, increasing government<br />
spend on healthcare, improvement in healthcare infrastructure, and growing health<br />
awareness etc is expected to drive pharma growth in these markets.<br />
Growth in tier-2 markets showing signs of catching up (%)<br />
18<br />
METROS CLASS I TOWNS CLASS II TO VI RURAL<br />
26<br />
23<br />
21<br />
18<br />
18<br />
15<br />
16 16<br />
17<br />
14<br />
13<br />
11<br />
9<br />
8<br />
2<br />
CY2007 CY2008 CY2009 CY2010<br />
Source: Industry/MOSL<br />
August 2011 13
Domestic Formulations | <strong>New</strong> Peaks<br />
A #3 - Awareness<br />
Rising literacy levels and media penetration is improving health awareness<br />
A #3 - Awareness<br />
High correlation between literacy and per capita pharma consumption<br />
We believe literacy is one of the key factors driving awareness about healthcare in general<br />
and pharmaceuticals in particular. In fact, literacy also has an indirect impact on pharma<br />
consumption. Higher literacy typically leads to higher per capita income (i.e. A #1,<br />
affordability), which in turn drives pharma demand.<br />
Our study of pharmaceutical consumption and literacy rates among various states of India<br />
confirms a strong correlation between literacy rate and pharma demand. As seen in the<br />
graph below, states with high literacy rates like Kerala, Maharashtra, Punjab and Haryana<br />
have higher per capita spend on pharmaceuticals compared to states with low literacy<br />
rates like Bihar, UP, Rajasthan and Assam.<br />
High correlation of literacy with per capita pharma consumption<br />
Literacy rate in India is rising<br />
100<br />
Literacy rate (%)<br />
Per Capita Pharma spend (Rs)<br />
800<br />
100<br />
Literacy rate (%)<br />
Per CapitaGDP (Rs)<br />
80,000<br />
85<br />
600<br />
75<br />
60,000<br />
70<br />
400<br />
50<br />
40,000<br />
55<br />
200<br />
25<br />
20,000<br />
40<br />
Orissa<br />
Bihar<br />
Gujarat<br />
UP<br />
Rajasthan<br />
Assam<br />
Karnataka<br />
Madhya<br />
West Bengal<br />
Andhra<br />
Tamil Nadu<br />
Haryana<br />
Punjab<br />
Kerala<br />
Maharashtra<br />
0<br />
0<br />
Orissa<br />
Bihar<br />
Gujarat<br />
UP<br />
Rajasthan<br />
Assam<br />
Karnataka<br />
Madhya<br />
West Bengal<br />
Andhra<br />
Tamil Nadu<br />
Haryana<br />
Punjab<br />
Kerala<br />
Maharashtra<br />
0<br />
Rising media penetration also leads to higher awareness<br />
Penetration of all forms of media is rising in India - print, TV, radio and internet. Higher<br />
media exposure leads to better awareness on a whole range of issues including healthcare,<br />
thus favourably influencing pharma demand.<br />
Rising media penetration is a positive for healthcare awareness and pharma demand<br />
Source: Industry/MOSL<br />
51.4<br />
Total TV HH (m) TV penetration (%)<br />
56.3 58.4<br />
53.6<br />
52.1<br />
60.2<br />
57<br />
C&S HH (m)<br />
63<br />
C&S penetration (% of TV Household)<br />
81<br />
73<br />
77<br />
66<br />
108 112 118<br />
129 136 142<br />
62 70 78<br />
94<br />
105<br />
115<br />
2005 2006 2007 2008 2009 2010<br />
2005 2006 2007 2008 2009 2010<br />
Note: HH stands for Households<br />
Source: Industry/MOSL<br />
August 2011 14
Domestic Formulations | <strong>New</strong> Peaks<br />
A #4 - Ailments<br />
Lifestyle drugs and anti-infectives hold the biggest potential<br />
A #4 - Ailments<br />
India has so far been an acute ailments market<br />
Ailments can be of two types - acute and chronic. An acute ailment can be described as<br />
a condition of rapid onset and severe symptoms of brief duration e.g. infectious disease<br />
like common cold, fever etc. Acute ailments may turn chronic if they remain unresolved.<br />
Chronic ailments can be described as conditions that, with current medical knowledge,<br />
can be alleviated but not cured. Unlike acute ailments, chronic ailments (1) do not usually<br />
resolve of their own accord, and (2) are of longer duration e.g. diabetes, asthma, blood<br />
pressure, etc.<br />
Due to relatively poor sanitation conditions, drugs addressing infectious diseases are<br />
predominant in most developing countries. Hence, the proportion of acute to chronic is<br />
higher in developing countries compared with developed countries.<br />
Therapeutic mix of major countries (%): Trend in India's therapeutic mix (%)<br />
India currently is an acute ailments market<br />
Share of chronic ailments segment is on the rise<br />
Chronic<br />
Acute<br />
Acute segment<br />
Chronic segment<br />
35<br />
42 45 45<br />
16<br />
22 23<br />
30<br />
65<br />
73<br />
65<br />
58 55 55<br />
84<br />
78 77<br />
70<br />
35<br />
27<br />
US Germany Japan UK China India<br />
2000 2005 2010 2015E<br />
Source: McKinsey/MOSL<br />
Changing disease profile to boost demand for chronic therapies<br />
India is undergoing a transition in terms of disease profile. The incidence and prevalence<br />
of non-communicable diseases is rapidly increasing due to demographic changes (e.g.<br />
urbanization) and lifestyle changes resulting from socioeconomic development (e.g. obesity,<br />
stress). Higher prevalence coupled with higher prescription compliance (due to improved<br />
affordability) is likely to drive much stronger growth in chronic ailment therapeutic segments<br />
(CATS). In 2006, the share of CATS stood at 22% of pharmaceutical market in India<br />
versus 55-65% in developed markets like US, UK and Japan. By 2015, the share of CATS<br />
is expected to rise to 30% of the then Indian market. (See pages 24-30 for profiles of<br />
major ailments in India.)<br />
August 2011 15
Domestic Formulations | <strong>New</strong> Peaks<br />
Prevalence rates of key chronic ailments to rise Market sizes of major corresponding therapies (INR b)<br />
3.3<br />
4.9<br />
2.8<br />
3.7<br />
2005 2015 (% of population) Market 2005 size 2005 (Rs b) Market 2015 Size 2015 (Rs b)<br />
137<br />
2.5 2.7 2.7<br />
83 82<br />
1.3<br />
0.2 0.2<br />
24<br />
10<br />
22<br />
Coronary<br />
heart<br />
disease<br />
Diabetes Asthma Obesity Cancer<br />
Coronary heart<br />
disease<br />
Diabetes<br />
Respiratory<br />
Source: Industry/MOSL<br />
India: Therapeutic trend (2000 to 2010)<br />
Historically, in the Indian pharma market, the acute ailments therapy segment was the largest in terms of sales, although<br />
it experienced slower growth rates than some of the chronic therapies. Nevertheless, almost all therapy areas experienced<br />
double-digit growth over the 2000-10 period. This is attributed to the preceding three As - Affordability, Access and<br />
Awareness.<br />
Among key therapies, anti-diabetics was the fastest growing in terms of sales with CY00-10 CAGR of 19.6% followed<br />
by CVS (cardiovasculsar system) at 15%. In terms of therapeutic segment market share, both anti-diabetics and CVS<br />
gained ~2.5% share each over CY00-10, whereas anti-infectives and vitamins & minerals lost 2% share each.<br />
Trend in major therapeutic segments Indian pharma market therapeutic mix (2000)<br />
10.8<br />
80<br />
Market Size (Rs b) 2000-10 CAGR (%)<br />
19.6<br />
15.2<br />
14.4<br />
12.0<br />
11.3 11.8<br />
9.9 9.1 10.9<br />
51 41 36 40 53 26 25 26 27<br />
CNS<br />
5%<br />
Dermatology<br />
6%<br />
Antidiabetic<br />
3%<br />
Others<br />
12%<br />
Antiinfectives<br />
18%<br />
Gastroin<br />
testinal<br />
10%<br />
Antiinfectives<br />
Gastrointestinal<br />
Respiratory<br />
Vitamins/Minerals<br />
Pain/Analgesic<br />
Cardiac<br />
Gynaecology<br />
Dermatology<br />
CNS<br />
Antidiabetic<br />
Gynaecology<br />
6%<br />
Cardiac<br />
9%<br />
Pain/<br />
Analgesic<br />
10%<br />
Vitamins/<br />
Minerals<br />
10%<br />
Respiratory<br />
11%<br />
Indian pharma market therapeutic mix (2005) Indian pharma market therapeutic mix (2010)<br />
Antidiabetic<br />
CNS 4%<br />
7%<br />
Dermatology<br />
5%<br />
Gynaecology<br />
3%<br />
Cardiac<br />
10%<br />
Others<br />
8%<br />
Pain/<br />
Analgesic<br />
9%<br />
Vitamins/<br />
Minerals<br />
13%<br />
Antiinfectives<br />
21%<br />
Gastrointestinal<br />
11%<br />
Respiratory<br />
9%<br />
Antidiabetic<br />
6%<br />
CNS<br />
6%<br />
Dermatology<br />
5%<br />
Gynaecology<br />
6%<br />
Others<br />
13%<br />
Cardiac<br />
11%<br />
Pain/<br />
Analgesic<br />
9%<br />
Antiinfectives<br />
16%<br />
Vitamins/<br />
Minerals<br />
8%<br />
Gastrointestinal<br />
11%<br />
Respiratory<br />
9%<br />
Source: Industry/MOSL<br />
August 2011 16
Domestic Formulations | <strong>New</strong> Peaks<br />
CVS, Diabetes, CNS and Anti-infectives will be the high potential segments<br />
We believe that CATS like Cardiovascular (CVS), Diabetes, Central Nervous System<br />
(CNS) will account for a major chunk of the incremental market over the next 5 years.<br />
Also, with rising income levels in the rural areas, anti-infectives will also record good<br />
growth over the same period. We believe these four will be the key segments of the<br />
future, and garner more than 50% of the delta in the Indian formulations market, 2015<br />
over 2010.<br />
We juxtaposed the incremental opportunity of various therapeutic segments against the<br />
number of existing players in each of these segments, to arrive at the following plot.<br />
CVS, Anti-infectives, Diabetes and CNS are large segments with relatively fewer players<br />
Top 4 ailment<br />
segments are<br />
mainly based on<br />
Attractiveness Factor,<br />
which is highest for<br />
CVS, Diabetes, Antiinfectives<br />
and CNS<br />
in that order<br />
No. of Players<br />
Incremental mkt size (INR b) 2010-15E<br />
0 20 40 60 80 100<br />
0<br />
10<br />
20<br />
30<br />
40<br />
Gynaecology<br />
Vitamins<br />
Dermatology<br />
CNS<br />
AF - 215<br />
Pain<br />
Diabetes<br />
AF - 396<br />
AI<br />
AF - 337<br />
Respiratory<br />
AF - 147<br />
GI<br />
AF - 109<br />
CVS<br />
AF - 400<br />
Note: AF is Attractiveness Factor of segment, which is defined by<br />
the incremental size of the opportunity per player<br />
Source: Industry/MOSL<br />
Our key conclusions from this chart:<br />
1. As discussed before, CVS, Anti-infectives, Diabetes and CNS will record maximum<br />
share of incremental market (the size of bubble indicates this).<br />
2. We also note that the attractiveness factor (i.e. incremental segment market size<br />
divided by number of players) is most favorable for these segments.<br />
3. Hence, companies which enjoy strong positioning in these segments will be able to<br />
generate maximum value from their respective domestic formulations businesses.<br />
August 2011 17
Domestic Formulations | <strong>New</strong> Peaks<br />
4 Buys<br />
Cipla, Lupin, Torrent and GSK Pharma<br />
Having identified the most attractive ailment segments, we have adopted two approaches<br />
to arrive at our top plays on India's domestic formulations -<br />
• Approach 1: 3-screen shortlisting process as follows:<br />
‣ Screen #1 - Identify companies with dominating presence in high-potential ailment<br />
segments<br />
‣ Screen #2 - Of the above, exclude companies with unfavorable non-domestic<br />
business<br />
‣ Screen #3 - Juxtapose the Screen #2 surviving companies vis-à-vis earnings growth<br />
and valuation<br />
• Approach 2: MEDICINES score, based on nine key success factors for picking<br />
domestic formulation stocks<br />
The final list from both the approaches is - Cipla, Lupin, Torrent and GSK Pharma.<br />
Approach 1: 3-Screen shortlisting process<br />
Screen #1<br />
Presence in high<br />
potential segments<br />
Identify companies with dominating presence in high-potential ailment<br />
segments<br />
The chart below maps the positioning of pharmaceutical players in the key therapeutic<br />
segments of CVS, Diabetes, anti-infectives and CNS. We have plotted the dominance of<br />
each player in these respective segments using prescription market share as the key<br />
measure of dominance. Given the fragmented nature of the Indian formulations market,<br />
we have defined 5% as the minimum threshold market share which qualifies as high<br />
dominance while market share of between 3-5% qualifies as medium category.<br />
Company mapping with respect to therapeutic classes<br />
High<br />
Sun Pharma,<br />
Torrent, Cadila,<br />
Cipla, Unichem,<br />
Ranbaxy, Lupin<br />
Abbott, U S V,<br />
Aventis,<br />
Sun Pharma<br />
Ranbaxy, Alkem,<br />
Aristo, Cipla,<br />
GSK Pharma,<br />
Piramal<br />
Sun Pharma, Intas,<br />
Torrent, Abbott,<br />
Piramal<br />
Cipla, GSK Pharma<br />
Dominance<br />
Medium<br />
Aventis, U S V,<br />
Emcure, Piramal,<br />
Dr Reddy's, Intas,<br />
Micro Labs<br />
Eli Lilly, Piramal,<br />
Micro Labs, Lupin<br />
Alembic,Mankind,<br />
FDC, Macleods,<br />
Lupin<br />
Aventis, Ranbaxy,<br />
Unichem,<br />
Micro Labs<br />
Cadila, Piramal,<br />
Ranbaxy<br />
Low<br />
IPCA Labs,<br />
AstraZeneca,<br />
Pfizer<br />
Panacea,<br />
Ranbaxy<br />
Novartis, Cipla,<br />
Lupin<br />
Pfizer, Mankind,<br />
Dr Reddy's,<br />
Sun Pharma,<br />
Glenmark, Biocon<br />
Companies in bold have been covered in this report<br />
CVS Diabetes Anti-infectives CNS<br />
Others<br />
Source: MOSL<br />
August 2011 18
Domestic Formulations | <strong>New</strong> Peaks<br />
Sun, Cipla, Lupin, Abbott, GSK best placed to capture the opportunity<br />
We note that these companies are best placed to capture the incremental opportunity in<br />
the high-growth life-style and anti-infectives segments by virtue of:<br />
1. Strong presence in these key segments<br />
2. High prescription market share of at least 5%<br />
3. Brand-building ability of these companies<br />
Ranbaxy, Cadila and Aventis also reasonably well placed<br />
These companies are also relatively well placed in the Indian formulations market and<br />
form the 2nd-tier of companies which should be focused on as participants in this large<br />
opportunity.<br />
Dr. Reddy's & Glenmark need to further strengthen their positioning<br />
The chart above indicates that DRL and Glenmark have a lot of catching-up to do to<br />
qualify as companies which will be able to exploit the large opportunity in the domestic<br />
formulations business. These companies suffer from relatively lower prescription market<br />
share in the high growth therapeutic segments.<br />
Screen #2<br />
Non-domestic business<br />
Most Indian companies are not pure-plays; view on non-domestic business<br />
is also important<br />
It is well-known that most Indian pharmaceutical companies are not pure-plays on the<br />
domestic opportunity given their strong focus on international generic businesses. Hence,<br />
it becomes imperative to map the domestic and the non-domestic businesses of these<br />
companies to take an overall view on these companies. The chart below depicts the matrix<br />
of these two businesses:<br />
Company mapping relative to the attractiveness of domestic and international business<br />
Sun Pharma,<br />
3 of our 4<br />
top picks are<br />
favorably placed<br />
in both their<br />
domestic and<br />
international<br />
businesses<br />
International Business<br />
Favourable<br />
Neutral<br />
Unfavourable<br />
Glenmark<br />
Pharma<br />
Dr Reddy<br />
Cipla, Lupin,<br />
Cadila,<br />
Torrent Pharma<br />
Ranbaxy,<br />
GSK Pharma<br />
Note: Only companies<br />
covered in this report have<br />
been mapped<br />
Unfavourable Neutral Favourable<br />
Domestic Business<br />
Source: MOSL<br />
Screen #3<br />
Earnings growth<br />
v/s Valuation<br />
Juxtapose the Screen #2 shortlisted companies vis-à-vis earnings growth<br />
and valuation<br />
We plotted the Screen #2 shortlisted companies in a matrix of FY11-13E EPS CAGR and<br />
FY11 P/E as depicted below. Based on the same, the top picks are Cipla, Lupin and<br />
Torrent.<br />
August 2011 19
Domestic Formulations | <strong>New</strong> Peaks<br />
Earnings growth v/s Valuation: Cipla, Torrent, Lupin on top ...<br />
... GSK merits rich valuation due to superior return ratios<br />
FY11 P/E (x)<br />
40<br />
30<br />
Dr Reddy<br />
20<br />
GSK<br />
Cadila<br />
Lupin Cipla<br />
Ranbaxy (53%, 65x)<br />
Sun<br />
Glenmark<br />
Torrent<br />
22<br />
25<br />
RoCE (%) Adj. RoCE (%) Very high due<br />
to -ve capital<br />
employed<br />
26<br />
22 23<br />
19<br />
16<br />
47<br />
14<br />
17 16<br />
7 28 27<br />
13<br />
15<br />
25<br />
10<br />
10.0 14.0 18.0 22.0 26.0 30.0<br />
FY11-13E EPS CAGR (%)<br />
Note - Adj. RoCE - RoCE adjusted for other income in P&L and Cash in Balance sheet<br />
RoCE and Adj. RoCE are average of FY11-13<br />
Sun<br />
Cipla<br />
Source: MOSL<br />
Approach 2: The MEDICINES score<br />
We have identified nine key success factors (KSFs) for shortlisting Indian pharma<br />
companies and their stocks. These success factors correspond to the initials of the word<br />
"MEDICINES". We have rated the companies on these KSFs to arrive at a final<br />
"MEDICINES Score" out of a maximum possible 100. The companies with the highest<br />
MEDICINES Score are the most attractive investment ideas.<br />
We have considered the following KSFs for evaluating the domestic formulations business<br />
(see box on page 21 for explanation). Our MEDICINES Scorecard is given below.<br />
DRL<br />
Ranbaxy<br />
Cadila<br />
Lupin<br />
GSK<br />
Glenmark<br />
Torrent<br />
MEDICINES<br />
Measures<br />
M<br />
E<br />
D<br />
I<br />
C<br />
I<br />
N<br />
E<br />
S<br />
Mix & Market share<br />
Equity with doctors<br />
Distribution & reach<br />
Introductions<br />
CAGR & scale-up<br />
Improvement in MR productivity<br />
Non-domestic business<br />
Earnings growth<br />
Stock attractiveness<br />
4 of the top 5<br />
MEDICINES score<br />
companies<br />
correspond with<br />
Approach 1. We<br />
are Neutral on Sun<br />
only due to rich<br />
valuations<br />
Indian domestic pharma players: The MEDICINES scorecard<br />
M E D I C I N E S Total<br />
Sun 7 9 8 6 9 9 7 9 13 77<br />
Cipla 6 7 8 6 6 7 5 7 14 66<br />
GSK Pharma ** 4 9 7 3 6 9 - 6 14 64<br />
Lupin 5 6 6 6 8 5 6 6 14 62<br />
Torrent Pharma 6 7 6 5 6 3 6 8 14 61<br />
Cadila 6 7 7 5 6 5 6 6 12 60<br />
Dr. Reddy's Labs 4 6 6 4 6 2 7 5 12 52<br />
Glenmark 2 3 5 6 6 5 3 9 10 49<br />
Ranbaxy 6 5 7 5 6 3 5 3 9 49<br />
** GSK Pharma score pro-rated as rating for Non-domestic business is not applicable Source: MOSL<br />
4 buys: Cipla, Lupin, Torrent, GSK Pharma<br />
4 of the top 5 MEDICINES score companies correspond with Approach 1. Thus, combining<br />
both Approaches 1 and 2, our top picks are Cipla, Lupin, Torrent and GSK Pharma.<br />
We are Neutral on Sun Pharma only due to rich valuations.<br />
August 2011 20
Domestic Formulations | <strong>New</strong> Peaks<br />
MEDICINES Score - Criteria & rating methodology<br />
We briefly explain below the KSFs and the rating criteria.<br />
M - Mix & Market share Maximum score: 10<br />
Mix & Market share indicates the therapeutic mix for the<br />
company in the domestic formulations market. We have<br />
identified life-style segments (CVS, Diabetes & CNS) and<br />
Anti-infectives as the most attractive segments for driving<br />
future growth and profitability. Companies with strong<br />
presence in these segments will be rated higher.<br />
E - Equity with doctors Maximum score: 10<br />
Equity with doctors implies the brand equity which the<br />
company enjoys with doctors. We have used prescription<br />
market share and prescription rankings as the proxy to<br />
measure brand equity with doctors. Companies with higher<br />
prescription share and better prescription rankings are rated<br />
higher.<br />
D - Distribution & reach Maximum score: 10<br />
This measures the distribution strength of a company in<br />
terms of its presence in metros, Tier-I cities, towns, and<br />
rural areas. Companies with wider distribution reach in<br />
relevant geographies are rated higher.<br />
I - Introductions Maximum score: 10<br />
Introductions measures the ability of a company to drive<br />
sales from new launches in the Indian formulations market<br />
(since this is an important growth contributor for most Indian<br />
companies). Companies with higher contribution from new<br />
launches are rated higher.<br />
C - CAGR and scale-up Maximum score: 10<br />
CAGR & scale-up captures the past and future growth in<br />
the domestic formulations portfolio driven by various factors<br />
like therapeutic mix, brand equity, productivity of sales<br />
force, new launches, etc. Companies with consistent high<br />
growth are rated higher.<br />
I - Improvement in MR productivity Max. score: 10<br />
MR (medical representative) productivity captures the ability<br />
of a company to drive growth in its domestic formulations<br />
portfolio through improvement in productivity of the sales<br />
force (measured as Sales/MR). Companies with<br />
consistently high or improving sales force productivity are<br />
rated higher.<br />
N - Non-domestic business Maximum score: 10<br />
This captures our view on the other businesses of the<br />
company including one-off option values. Companies<br />
expected to do well in these businesses are rated higher.<br />
E - Earnings growth Maximum score: 10<br />
We have considered overall earnings growth, and not just<br />
from the domestic business. Companies with high longterm<br />
earnings growth (FY05-13) are rated higher.<br />
S - Stock Attractiveness Maximum score: 20<br />
Stock attractiveness has a higher weight of 20 compared<br />
to others, and captures our view on the stock including<br />
issues such as depth of management, corporate<br />
governance, return ratios, and valuations. Companies with<br />
favorable outlook are rated higher.<br />
August 2011 21
Domestic Formulations | <strong>New</strong> Peaks<br />
Detailed MEDICINES Score<br />
Mix<br />
MEDICINES Chronic therapy Score<br />
Score contribution (%)<br />
Sun 77 61 7<br />
Cipla 66 42 6<br />
Lupin 62 43 5<br />
Torrent Pharma 61 62 6<br />
GSK Pharma ** 64 5 4<br />
Cadila 60 31 6<br />
Dr. Reddy's 52 28 4<br />
Glenmark 49 24 2<br />
Ranbaxy 49 21 6<br />
Equity with doctors<br />
Comment<br />
Score<br />
Leader in CNS, Gynaec and 2nd in CVS, Anti-diabetics 9<br />
Market leader in AI and Respiratory 7<br />
Leader in Anti-TB segment 6<br />
Ranks 2nd in CNS and 7th in CVS 7<br />
Market leader in Derma, Vit and Pain Mgmt 9<br />
Among top 3 players in CVS and GI 7<br />
Ranks 3rd in GI and Pain Mgmt 6<br />
Ranks 2nd in Dermatology 3<br />
Among the leaders in AI and Dermatology 5<br />
Distribution & reach<br />
Metro/Tier I MR strength Score<br />
Sun<br />
(% of sales)<br />
73 2,600 8<br />
Cipla<br />
63 5,100 8<br />
Lupin<br />
70 3,682 6<br />
Torrent Pharma 73 3,600 6<br />
GSK Pharma ** 60 2,500 7<br />
Cadila<br />
65 4,500 7<br />
Dr. Reddy's 68 3,165 6<br />
Glenmark 70 2,078 5<br />
Ranbaxy 66 4,500 7<br />
Introductions<br />
In last Contbn to Score<br />
4 years growth (%)<br />
124 56 6<br />
304 45 6<br />
266 69 6<br />
151 49 5<br />
21 15 3<br />
197 37 5<br />
89 31 4<br />
105 52 6<br />
255 50 5<br />
CAGR & Scale-up (%) - Sales<br />
FY05-11 FY11-13 Score<br />
23 18 9<br />
14 13 6<br />
22 19 8<br />
19 18 6<br />
8 14 6<br />
12 15 6<br />
18 16 6<br />
19 17 6<br />
10 16 6<br />
Improvement in productivity<br />
(Sales/MR, INR m)<br />
Non domestic<br />
business<br />
Earnings Growth<br />
(FY11-13)<br />
2004 2010 Score Favorability Score Comment (%) Score<br />
Sun<br />
3.2 7.8 9 High 7 22 9<br />
Cipla<br />
4.8 4.9 7 Medium 5 21 7<br />
Lupin<br />
3.6 3.6 5 High 6 13 6<br />
Torrent Pharma 1.5 2.3 3 High 6 22 8<br />
GSK Pharma ** 6.5 7.1 9 Not applicable N.A. 16 6<br />
Cadila<br />
4.1 3.6 5 High 6 21 6<br />
Dr. Reddy's<br />
3.6 3.2 2 High 7 12 5<br />
Glenmark<br />
3.1 3.6 5 Low 3 24 9<br />
Ranbaxy<br />
4.6 3.6 3 Medium 5 55 3<br />
** GSK Pharma total MEDICINES score pro-rated as rating for Non-domestic business is not applicable<br />
Stock<br />
attractiveness<br />
Comment Score<br />
Neutral 13<br />
Top pick 14<br />
Top pick 14<br />
Top pick 14<br />
Buy 14<br />
Neutral 12<br />
Neutral 12<br />
Neutral 10<br />
Sell 9<br />
Domestic formulations companies - Comparative valuations (INR)<br />
Company Target Upside EPS (INR) P/E (X) EV/EBITDA (X) ROE (%)<br />
(CMP) Price (%) FY11 FY12E FY13E FY11 FY12E FY13E FY11 FY12E FY13E FY11 FY12E FY13E<br />
Top Picks<br />
Cipla (281) 361 28 12.0 13.4 16.4 23.3 21.0 17.1 17.4 14.5 12.1 14.5 14.4 15.6<br />
Lupin (450) 514 14 19.3 22.3 25.7 23.3 20.2 17.5 19.5 16.8 13.8 29.3 27.1 25.7<br />
Torrent (589) 762 29 31.9 40.1 47.6 18.4 14.7 12.4 12.4 9.6 8.0 29.2 29.3 27.7<br />
GSK (2,155) 2,330 8 68.6 77.5 89.6 31.4 27.8 24.1 21.9 20.2 17.2 30.1 31.3 33.4<br />
Others<br />
Sun (464) 524 13 13.6 17.3 20.9 34.2 26.8 22.2 22.4 20.8 16.7 16.2 17.7 18.5<br />
Cadila (824) 907 10 30.9 28.3 41.1 26.6 29.1 20.0 17.2 17.2 14.0 37.5 27.3 27.6<br />
DRRD* (1,446) 1,670 15 65.6 68.6 81.1 21.6 20.7 17.5 16.7 17.1 14.4 24.1 22.5 23.5<br />
Glenmark (318) 310 -3 12.5 16.1 19.7 25.5 19.7 16.1 17.7 10.4 11.1 17.4 17.0 17.1<br />
Ranbaxy ## (468) 412 -12 25.8 11.9 16.7 15.2 33.0 23.3 11.1 23.0 18.5 19.4 11.4 10.4<br />
* Dr. Reddy's<br />
## - Adjusted for Rs77/sh of DCF value of FTF; Dr. Reddy's Labs & Ranbaxy core valuations adjusted for DCF value of Para-IV upsides<br />
August 2011 22
Domestic Formulations | <strong>New</strong> Peaks<br />
Ailment Profiles<br />
Ailments<br />
Infection<br />
CVS Disease<br />
Diabetes<br />
CNS Diseases<br />
Pain<br />
Gastro-intestinal (GI) Problems<br />
Respiratory Diseases<br />
August 2011 23
Domestic Formulations | <strong>New</strong> Peaks<br />
Ailment & Therapy profile<br />
Infection<br />
Ailment snapshot<br />
An infection is the colonization of a host organism by a<br />
parasite species. Infecting parasites seek to use the host's<br />
resources to reproduce, often resulting in disease.<br />
Colloquially, infections are usually considered to be caused<br />
by microscopic organisms or microparasites like viruses,<br />
prions, bacteria, and viroids, though larger organisms like<br />
macroparasites and fungi can also infect.<br />
Hosts normally fight infections themselves via their immune<br />
system. Mammalian hosts react to infections with an<br />
innate response, often involving inflammation, followed by<br />
an adaptive response. Pharmaceuticals can also help fight<br />
infections.<br />
Therapy snapshot<br />
Anti-infectives<br />
Anti-infective drugs are used to suppress/cure the infection.<br />
Four types of anti-infective or drugs exist: antibacterial<br />
(antibiotic), antiviral, antitubercular, and antifungal.<br />
Depending on the severity and the type of infection, the<br />
antibiotic may be given by mouth, injection or may be<br />
applied topically. Severe infections of the brain are usually<br />
treated with intravenous antibiotics. Sometimes, multiple<br />
antibiotics are used to decrease the risk of resistance<br />
and increase efficacy. Antibiotics only work for bacteria<br />
and do not affect viruses. Antibiotics work by slowing down<br />
the multiplication of bacteria or killing the bacteria.<br />
Key Drugs<br />
Penicillins, Cephalosporins, Aminoglycosides, Macrolides,<br />
Quinolones, Tetracyclines<br />
Key Brands<br />
Augmentin - GSK, Zifi - FDC, Taxim - Alkem, Mox - Ranbaxy<br />
Azithral - Alembic<br />
Anti-infectives Segment (2001-10 CAGR - 12.4%)<br />
Segment Size (INR B) Contribution to Industry (%)<br />
20<br />
80<br />
19<br />
70<br />
61<br />
18 47 18<br />
29 28<br />
17<br />
17<br />
2000 2001 2005 2008 2009 2010<br />
Anti-infectives Segment - Prescription Rankings<br />
Company Jan-07 Jan-08 Jan-09 Jan-10 Oct-10<br />
Cipla 1 1 1 1 1<br />
Mankind 5 4 4 3 2<br />
Ranbaxy 2 2 3 2 3<br />
FDC 3 3 2 4 4<br />
Piramal (Abbott) 7 7 5 5 5<br />
Macleods 10 10 10 9 6<br />
Unbranded 6 6 7 7 7<br />
Alkem 8 8 8 8 8<br />
Alembic 4 5 6 6 9<br />
GSK 9 9 9 10 10<br />
Anti-infective segment - Value market share (%) - 2010 Anti-infective segment-prescription market share (%) - 2010<br />
Others, 32.5<br />
Ranbaxy,<br />
10.8<br />
Alkem, 10.5<br />
Aristo, 7.3<br />
Others, 44.8<br />
Cipla, 8.4<br />
Mankind, 8.3<br />
Ranbaxy,<br />
7.8<br />
FDC, 7.1<br />
Macleods,<br />
4.8<br />
Alembic, 5<br />
FDC, 5.1<br />
Mankind, 5.6<br />
Cipla, 6.7<br />
GSK, 6<br />
Piramal<br />
(Abbott), 5.7<br />
Aristo, 2.8<br />
GSK, 2.9<br />
Piramal<br />
(Abbott), 5.4<br />
Macleods,<br />
4.5<br />
Alkem, 4.0<br />
Alembic, 4.0<br />
Source: Industry/MOSL<br />
August 2011 24
Domestic Formulations | <strong>New</strong> Peaks<br />
Ailment & Therapy profile<br />
CVS Disease<br />
CVS Drugs<br />
Ailment snapshot<br />
Cardiovascular disease are the class of diseases that<br />
involve the heart or blood vessels (arteries and veins).While<br />
the term technically refers to any disease that affects the<br />
cardiovascular system, it is usually used to refer to those<br />
related to atherosclerosis (arterial disease). These<br />
conditions usually have similar causes, mechanisms, and<br />
treatments. In practice, cardiovascular disease is treated<br />
by cardiologists, thoracic surgeons, vascular surgeons,<br />
neurologists, and interventional radiologists, depending on<br />
the organ system that is being treated.<br />
Key Drugs<br />
Angiotensin II Receptor Blockers, Angiotensin-Converting<br />
Enzyme (ACE) Inhibitors, Antiarrhythmics, Antiplatelet<br />
Therapy snapshot<br />
Cardiovascular medications are used as a means to control<br />
or to prevent certain forms of heart disease. Many people<br />
with advanced heart disease may take several of these<br />
drugs. Types of cardiovascular drugs may be broken into<br />
groups depending upon their action or what they treat.<br />
Categories that might describe drug actions include the<br />
following: statins (for cholesterol), diuretics (for blood<br />
pressure), anticoagulants (for blood thinning), anti-platelet<br />
(for removing bold clots), beta-blockers (for preserving<br />
normal heart rhythm after a heart attack and for lowering<br />
high blood pressure), digitalis drugs (for cardiac failure),<br />
vasodilators (for facilitating blood supply to the heart),<br />
calcium channel blockers (for angina & high blood pressure)<br />
and ACE inhibitors (for high blood pressure).<br />
Key Brands<br />
Storvas - Ranbaxy, Cardace - Sanofi, Aten - Cadila, Losar-<br />
H - Unichem, Minipress-XL - Pfizer<br />
CVS Segment (2001-10 CAGR - 15.9%)<br />
Segment Size (INR B) Contribution to Industry (%)<br />
10<br />
11<br />
9<br />
9<br />
11 11<br />
53<br />
38<br />
45<br />
24<br />
13 14<br />
2000 2001 2005 2008 2009 2010<br />
CVS Segment - Prescription Rankings<br />
Company Jan-07 Jan-08 Jan-09 Jan-10 Oct-10<br />
USV 1 1 1 1 1<br />
Sun 2 2 2 2 2<br />
Piramal (Abbott) 4 4 3 3 3<br />
Cipla 5 5 4 4 4<br />
Lupin 9 7 7 6 5<br />
Torrent 8 8 6 5 6<br />
Zydus-Cadila 3 3 5 7 7<br />
Sanofi 7 6 9 9 8<br />
Unichem 6 9 8 8 9<br />
Micro Labs 11 10 10 11 10<br />
CVS Segment - Value market share (%) - 2010 CVS Segment - Prescription market share (%) - 2010<br />
Sun, 7.1<br />
Others, 41.1<br />
Emcure, 4.8<br />
Sanofi, 5.1<br />
USV, 5.1<br />
Torrent, 6.8<br />
Zydus-<br />
Cadila, 6.5<br />
Unichem,<br />
6.2<br />
Cipla, 5.9<br />
Ranbaxy,<br />
5.8<br />
Lupin, 5.6<br />
Others, 48.2<br />
Micro Labs,<br />
3.3<br />
USV, 9.3<br />
Unichem,<br />
4.0<br />
Sun, 6.8<br />
Piramal<br />
(Abbott), 5.3<br />
Cipla, 5.1<br />
Lupin, 5.0<br />
Torrent, 4.6<br />
Zydus-<br />
Cadila, 4.5<br />
Sanofi, 4.0<br />
Source: Industry/MOSL<br />
August 2011 25
Domestic Formulations | <strong>New</strong> Peaks<br />
Ailment & Therapy profile<br />
Diabetes<br />
Anti-diabetic<br />
Ailment snapshot<br />
Diabetes mellitus, often simply referred to as diabetes, is<br />
a group of metabolic diseases in which a person has high<br />
blood sugar, either because the body does not produce<br />
enough insulin, or because cells do not respond to the<br />
insulin that is produced.<br />
There are three main types of diabetes: Type 1<br />
diabetes: results from the body's failure to produce insulin,<br />
and presently requires the person to inject insulin. Type 2<br />
diabetes: results from insulin resistance, a condition in<br />
which cells fail to use insulin properly, sometimes<br />
combined with an absolute insulin deficiency. Gestational<br />
diabetes: is when pregnant women, who have never had<br />
diabetes before, have a high blood glucose level during<br />
pregnancy. It may precede development of type 2 diabetes.<br />
Key Drugs<br />
Insulin, Alpha-glucosidase inhibitors, Glimepiride, Insulin<br />
sensitizers, Secretagogues<br />
Therapy snapshot<br />
Anti-diabetic medications treat diabetes mellitus by<br />
lowering glucose levels in the blood. With the exceptions<br />
of insulin, exenatide, and pramlintide, all are administered<br />
orally. There are different classes of anti-diabetic drugs,<br />
and their selection depends on the nature of the diabetes,<br />
age and situation of the person, as well as other factors.<br />
Type 1 diabetes can only be controlled with the help of<br />
injected insulin. Type 2 diabetes treatments include (1)<br />
agents which increase the amount of insulin secreted by<br />
the pancreas (Secretagogues), (2) agents which increase<br />
the sensitivity of target organs to insulin (Insulin<br />
sensitizers), and (3) agents which decrease the rate at<br />
which glucose is absorbed from the gastrointestinal tract<br />
(Alpha-glucosidase inhibitors).<br />
Key Brands<br />
Human Mixtrad - Novo, Lantus - Sanofi, Glycomet GP -<br />
USV, Novomix - Novo, Amaryl - Sanofi<br />
Diabetes Segment (2001-10 CAGR - 17.8%)<br />
Segment Size (INR B) Contribution to Industry (%)<br />
5.3 5.4<br />
5.8<br />
4.0<br />
4.3<br />
3.3<br />
27<br />
18<br />
22<br />
5 6<br />
10<br />
2000 2001 2005 2008 2009 2010<br />
Diabetes Segment - Prescription Rankings<br />
Company Jan-07 Jan-08 Jan-09 Jan-10 Oct-10<br />
USV 1 1 1 1 1<br />
Sun 2 2 2 2 2<br />
Abbott 3 3 3 3 3<br />
Sanofi 4 4 6 4 4<br />
Micro Labs 5 7 7 6 5<br />
Lupin 8 8 8 8 6<br />
Franco 7 6 5 7 7<br />
Piramal (Abbott) 6 5 4 5 8<br />
Eris NA NA NA 12 9<br />
Glenmark 9 9 9 10 10<br />
Diabetes Segment - Value market share (%) - 2010 Diabetes Segment - Prescription market share (%) - 2010<br />
Others,<br />
29.6<br />
Abbott, 20<br />
USV, 14.2<br />
Sun, 7.8<br />
USV, 12.4<br />
Others, 40.9<br />
Abbott, 6.6<br />
Franco, 2.7<br />
Wockhardt,<br />
3.2<br />
MSD, 3.2<br />
Lupin, 3.8 Micro Labs,<br />
4<br />
Piramal<br />
(Abbott),<br />
4.2<br />
Sanofi, 9.1<br />
Sun, 7.8<br />
Glenmark,<br />
2.9<br />
Eris, 3.3<br />
Piramal<br />
(Abbott), 4.5<br />
Sanofi, 5.2<br />
Micro Labs,<br />
5.2<br />
Lupin, 4.9<br />
Franco, 4.6<br />
Source: Industry/MOSL<br />
August 2011 26
Domestic Formulations | <strong>New</strong> Peaks<br />
Ailment & Therapy profile<br />
CNS Diseases<br />
CNS Drugs<br />
Ailment snapshot<br />
A central nervous system disease can affect either the<br />
spinal cord (myelopathy) or brain (encephalopathy), both<br />
part of the central nervous system. The central nervous<br />
system controls behaviors in the human body, so this can<br />
be a fatal illness. Common CNS diseases include<br />
Encephalitis, Meningitis, Alzheimer's disease, Parkinson's<br />
disease, Multiple sclerosis and depression.<br />
Therapy snapshot<br />
The key central nervous system drugs obtainable in the<br />
market are antidepressant, ergot derivative, sedative,<br />
antipsychotic, benzodiazepine and antiemtic. Out of the<br />
whole central nervous system drugs market;<br />
antidepressants, antipsychotics and anti epileptics are<br />
the largest growing segments.<br />
Key Drugs<br />
Phenytoin sodium, Mecobalamin, Gabapentin, Citalopram,<br />
Alprazolam.<br />
Key Brands<br />
Eptoin - Abbott, Nurokind Plus - Mankind, Vertin - Solvay<br />
Alprax - Torrent, Trika - Unichem<br />
CNS Segment (2001-10 CAGR - 14.4%)<br />
Segment Size (INR B) Contribution to Industry (%)<br />
5 5<br />
6<br />
4<br />
4<br />
3<br />
27<br />
18<br />
22<br />
5 6<br />
10<br />
2000 2001 2005 2008 2009 2010<br />
CNS Segment - Prescription Rankings<br />
Company Jan-07 Jan-08 Jan-09 Jan-10 Oct-10<br />
Sun 1 1 1 1 1<br />
Intas 3 3 3 2 2<br />
Torrent 2 2 2 3 3<br />
Piramal (Abbott) 5 4 4 4 4<br />
UCB 6 6 5 5 5<br />
Micro Labs 7 7 7 6 6<br />
Local companies NA NA 12 8 7<br />
Unichem 4 5 6 7 8<br />
Abbott 9 9 9 9 9<br />
Wockhardt 10 10 10 11 10<br />
CNS Segment - Value market share (%) - 2010 CNS Segment - Prescription market share (%) - 2010<br />
Others, 24.2<br />
Micro Labs,<br />
3.5<br />
Ranbaxy,<br />
3.8<br />
Unichem,<br />
3.9<br />
Pfizer, 4.2<br />
Sanofi, 4.8<br />
Piramal<br />
(Abbott),<br />
6.5<br />
Sun, 20.7<br />
Intas, 12.2<br />
Torrent, 8.6<br />
Abbott, 7.6<br />
Others, 43.7<br />
Cipla, 2.9<br />
Wockhardt,<br />
3.1<br />
Abbott, 3.5<br />
Sun, 12.1<br />
Intas, 8.2<br />
Unichem,<br />
3.8<br />
Torrent, 8.1<br />
Piramal<br />
(Abbott), 5.5<br />
UCB, 5.0<br />
Micro Labs,<br />
4.2<br />
Source: Industry/MOSL<br />
August 2011 27
Domestic Formulations | <strong>New</strong> Peaks<br />
Ailment & Therapy profile<br />
Pain<br />
Ailment snapshot<br />
Pain, by itself, is not a disease, but is an indicator of<br />
temporary or long-lasting damage to the human body. It is<br />
a major symptom in many medical conditions. Pain is<br />
usually transitory, lasting only until the noxious stimulus<br />
is removed or the underlying damage or pathology has<br />
healed, but some painful conditions, such as rheumatoid<br />
arthritis, peripheral neuropathy, cancer and idiopathic pain,<br />
may persist for years. Pain that lasts a long time is called<br />
chronic, and pain that resolves quickly is called acute.<br />
Acute pain is usually managed with medications while<br />
management of chronic pain, is much more difficult and<br />
may require the coordinated efforts of doctors,<br />
physiotherapists along with medicines.<br />
Pain/NSAIDS Drugs<br />
Therapy snapshot<br />
The key pain management drugs obtainable in the market<br />
are aSalicylates (like Aspirin), Propionic acid derivatives<br />
(like Ibuprofen, Naproxen), Acetic acid derivatives (like<br />
Diclofenac), Oxicam derivatives, Fenamates, Cox-2<br />
Inhibitors, Sulphonanilides.<br />
Key Drugs<br />
Salicylates, Propionic acid derivatives, Acetic acid<br />
derivatives, Oxicam derivatives, Fenamates, Cox-2<br />
Inhibitors, Sulphonanilides<br />
Pain/NSAIDS Segment (2001-10 CAGR - 11.2%)<br />
9.3<br />
Segment Size (INR B) Contribution to Industry (%)<br />
10.0<br />
9.0<br />
8.7<br />
8.7<br />
14 16 21 30 35 40<br />
8.6<br />
2000 2001 2005 2008 2009 2010<br />
Key Brands<br />
Voveran - Novartis, Calpol - GSK, Spamo-Proxyvon -<br />
Wockhardt, Combiflam - Sanofi, Volini - Ranbaxy<br />
Pain/NSAIDS Segment - Prescription Rankings<br />
Company Jan-07 Jan-08 Jan-09 Jan-10 Oct-10<br />
GSK 1 1 2 2 1<br />
Generic-generics 2 2 1 1 2<br />
Dr. Reddy's 3 3 3 3 3<br />
Micro Labs 9 9 8 7 4<br />
Local Companies NA NA 11 4 5<br />
Cipla 4 5 5 5 6<br />
Ipca 11 11 12 10 7<br />
Mankind 15 12 9 6 8<br />
Alkem 7 8 10 12 9<br />
Sanofi 6 4 4 9 10<br />
Pain/NSAIDS Segment - Value market share (%) - 2010 Pain/NSAIDS Segment - Prescription market share (%) - 2010<br />
Novartis,<br />
7.2<br />
Ranbaxy, 7<br />
GSK, 6.4<br />
GSK, 7<br />
Dr. Reddy's,<br />
4.1<br />
Micro Labs,<br />
3.9<br />
Cipla, 3.4<br />
Alkem, 5.8<br />
Ipca, 3.3<br />
Others, 47.5<br />
Elder, 3.7<br />
Zydus-<br />
Cadila, 4<br />
Piramal<br />
(Abbott),<br />
5.5<br />
Sanofi, 4.6<br />
Ipca, 4.3<br />
Dr. Reddy's,<br />
4<br />
Others, 63.5<br />
Mankind, 3.2<br />
Alkem, 3.1<br />
Sanofi, 3.0<br />
Novartis, 2.7<br />
Piramal<br />
(Abbott), 2.7<br />
Source: Industry/MOSL<br />
August 2011 28
Domestic Formulations | <strong>New</strong> Peaks<br />
Ailment & Therapy profile<br />
Gastro-intestinal (GI) Problems<br />
GI Drugs<br />
Ailment snapshot<br />
Diseases/problems related to the GI tract mainly affect<br />
the stomach and the intestines in humans. While the most<br />
common problems are acidity/ulcers, other more serious<br />
diseases include Cancer, Cholera, Colorectal cancer,<br />
Gastroenteritis, Inflammatory bowel disease, Irritable bowel<br />
syndrome, Pancreatitis, Peptic ulcer disease,<br />
Gastroesophageal reflux disease (GERD), etc. While some<br />
of these problems are temporary in nature and can be<br />
cured by medicines, diet alterations, etc., many of these<br />
problems are chronic in nature and generally require longterm<br />
treatments by way of medicines and<br />
gastroenterologists consultations.<br />
Therapy snapshot<br />
The key GI drugs obtainable in the market are Antacids,<br />
Anti-reflux agents, Antiulcerants, GIT regulators,<br />
Antiflatulents, Anti-inflammatories, Anti-spasmodics,<br />
Laxatives, Purgatives, Digestives, Anti-emetics<br />
Key Drugs<br />
Antacids, Anti-reflux agents, Antiulcerants, GIT regulators<br />
Antiflatulents, Anti-spasmodics, Laxatives, Purgatives<br />
Key Brands<br />
Zinetac - GSK, Omez - DRL, Digene - Abbott, Aciloc -<br />
Cadila, Gelusil MPS - Pfizer<br />
GI Segment (2001-10 CAGR - 17.1%)<br />
Segment Size (INR B) Contribution to Industry (%)<br />
11.3<br />
10.6 10.8 10.9 11.1<br />
8.0<br />
17 12 24 37 43 51<br />
GI Segment - Prescription Rankings<br />
Company Jan-07 Jan-08 Jan-09 Jan-10 Oct-10<br />
Mankind 2 1 1 1 1<br />
Cadila 1 2 2 2 2<br />
Dr. Reddy's 5 3 4 4 3<br />
JB Chem 3 4 3 3 5<br />
Torrent 7 6 5 6 6<br />
Local Companies NA NA 14 5 7<br />
Piramal (Abbott) 6 5 6 7 8<br />
Alkem 13 11 10 9 9<br />
Generic-generics 9 8 7 8 10<br />
2000 2001 2005 2008 2009 2010<br />
GI Segment - Value market share (%) - 2010 GI Segment - Prescription market share (%) - 2010<br />
Others, 49.9<br />
Abbott, 7.2<br />
Torrent, 3.6<br />
Ranbaxy,<br />
3.6<br />
Dr. Reddy's,<br />
4.4<br />
Zydus-<br />
Cadila, 4.2<br />
JB Chem,<br />
4.0<br />
Torrent, 3.6<br />
Piramal<br />
(Abbott), 3.5<br />
Zydus-<br />
Cadila, 6.5 Dr. Reddy's,<br />
5.6<br />
Alkem, 5.3<br />
Mankind, 5.2<br />
Sun, 4.7<br />
Aristo, 4.6<br />
Piramal<br />
(Abbott),<br />
3.8<br />
Others, 60.1<br />
Mankind, 6.9<br />
Cadila<br />
Pharma, 4.5<br />
Sun, 2.7 FDC, 2.9<br />
Alkem, 3.4<br />
Source: Industry/MOSL<br />
August 2011 29
Domestic Formulations | <strong>New</strong> Peaks<br />
Ailment & Therapy profile<br />
Respiratory Diseases<br />
Ailment snapshot<br />
Respiratory disease is the term for diseases of the<br />
respiratory system. These include diseases of the lung,<br />
pleural cavity, bronchial tubes, trachea, upper respiratory<br />
tract and of the nerves and muscles of breathing.<br />
Respiratory diseases range from mild and self-limiting such<br />
as the common cold to chronic diseases like asthma/<br />
COPD and life-threatening such as bacterial pneumonia<br />
or pulmonary embolism. They are a common and important<br />
cause of illness and death.<br />
Respiratory Drugs<br />
Therapy snapshot<br />
The key Respiratory Drugs obtainable in the market are<br />
Common cough & cold medicines, Corticosteroids,<br />
Bronchodilators, Mechanical ventilation.<br />
Key Drugs<br />
Common cough & cold medicines, Corticosteroids,<br />
Bronchodilators, Mechanical ventilation<br />
Key Brands<br />
Corex - Pfizer, Phensedyl - Piramal (Abbott), Asthalin -<br />
Cipla, Seroflo - Cipla, Aerocort - Cipla<br />
Respiratory Segment (2001-10 CAGR - 11.4%)<br />
Segment Size (INR B) Contribution to Industry (%)<br />
10.0 10.0<br />
9.4<br />
8.8 8.9<br />
8.8<br />
15 16 22 30 36 41<br />
2000 2001 2005 2008 2009 2010<br />
Respiratory Segment - Prescription Rankings<br />
Company Jan-07 Jan-08 Jan-09 Jan-10 Oct-10<br />
Cipla 1 1 1 1 1<br />
Generic-generics 4 4 4 4 2<br />
Zydus-Cadila 3 3 2 2 3<br />
GSK 2 2 3 3 4<br />
Mankind 22 22 12 6 5<br />
Local Companies NA NA 10 5 6<br />
Centaur Labs 7 7 6 7 7<br />
Indoco 8 8 7 8 8<br />
Sanofi 9 10 9 11 9<br />
Alembic 6 6 8 10 10<br />
Respiratory Segment - Value market share (%) - 2010 Respiratory Segment - Prescription market share (%) - 2010<br />
Others, 33.3<br />
Sanofi, 2.7<br />
Glenmark,<br />
2.8<br />
Wockhardt,<br />
3.2<br />
Alembic, 3.4<br />
Lupin, 4.8 GSK, 5.1<br />
Cipla, 22.1<br />
Piramal<br />
(Abbott),<br />
9.4<br />
Pfizer, 7.8<br />
Zydus-<br />
Cadila, 5.4<br />
Others, 63.9<br />
Cipla, 6.1<br />
Zydus-<br />
Cadila, 4.9<br />
Piramal<br />
(Abbott), 2.5<br />
GSK, 4.9<br />
Mankind, 3.6<br />
Centaur<br />
Labs, 3.0<br />
Indoco, 3.0<br />
Sanofi, 2.8<br />
Alembic, 2.7<br />
Dr. Reddy's,<br />
2.6<br />
Source: Industry/MOSL<br />
August 2011 30
Domestic Formulations | <strong>New</strong> Peaks<br />
Annexure 1: Evolution of the market and state of the<br />
industry<br />
Till 1970, due to product patent regime, multinational pharmaceutical companies dominated<br />
the domestic market and enjoyed 80% market share. However, with the introduction of<br />
process patent law in 1970, the scenario changed dramatically in the last 4 decades.<br />
Today the domestic market is dominated by Indian companies with market share of ~80%.<br />
During the same period, in the absence of product patent, many multinational companies<br />
exited the country while many others followed cautious approach in terms of new product<br />
launches.<br />
Dominance of local companies<br />
Domestic pharmaceutical companies are dominant in India. Due to strong chemistry skills,<br />
local companies have managed to garner ~80% market share in India. Currently, the<br />
market is a fragmented market with the largest player holding 7% market share. The<br />
presence of small and regional players has increased significantly over the years. Due to<br />
intensified competition, prices of the drugs in India are one of the lowest in the world.<br />
However, with the introduction of new product patent law in 2005 as per WTO commitment,<br />
MNCs have started focusing on Indian operations. Many MNCs have shown interest in<br />
expanding their presence in India through organic and inorganic growth means.<br />
We believe that, in the coming years, MNCs will see their market share increasing gradually<br />
on led by Patented product pipeline of parent, strong brand equity among physicians,<br />
strong financial muscles and increased focus of large MNCs on emerging markets as a<br />
next growth driver in light of dwindling revenues in developed countries.<br />
Market share of MNCS in Emerging markets (%)<br />
MNCs<br />
Local<br />
21 23<br />
36<br />
74 78<br />
79 77<br />
64<br />
26 22<br />
Poland Russia Brazil China India<br />
Source: McKinsey/MOSL<br />
August 2011 31
Domestic Formulations | <strong>New</strong> Peaks<br />
Branded generic nature of the industry<br />
Indian pharmaceutical market is largely a branded generic market where the same molecule<br />
is sold by number of companies under different brand name. Nearly 80% of the Indian<br />
retail market is made up of branded generics while rest is distributed between OTC and<br />
generic drugs. Due to the branded generic nature of the business, trade power lies with<br />
the physicians. Here, the relationship and brand equity of the pharmaceutical companies<br />
with physicians is a key determinant of success. The share of branded generics is in India<br />
is higher that some of the other emerging markets. In Brazil and Russia, branded generics<br />
account for 60% and 40% of the market.<br />
We believe that, going forward the markets will be dominated by branded generic segment<br />
while patented products will contribute 10% to the market demand in 2015. Indian companies<br />
have large options for launch of new generics from the basket of pre-1995 drugs. (The<br />
total no of such products is more than 200). Further, domestic players have opportunity to<br />
develop new combination and formulation of the products that are already in the market.<br />
Also it is likely that a proportion of post 1995 molecules will not get full patent protection<br />
due to relatively narrow definition of patentability in the India patent act.<br />
Low pricing levels<br />
Prices of medicines in India are one of the lowest in the world. Prices of drugs in India are<br />
at around 10-12% of US prices and for some products, prices are lower than those in<br />
neighbouring countries such as Sri Lanka, Pakistan and Bangladesh. Severe competition<br />
has resulted in such low prices. On an average there are 50 brands for any major molecule.<br />
The level of specialization of molecule is important driver of pricing premium.<br />
We believe that with the reduction in competition going forward on back of consolidation<br />
in the industry and shift toward specialty therapy segments, prices are likely to stabilize at<br />
current levels if not improve.<br />
August 2011 32
Domestic Formulations | <strong>New</strong> Peaks<br />
Annexure 2: Regulatory framework of the Indian<br />
formulations industry<br />
Product patent regime begun from 2005<br />
India adopted product patent regime in 2005. Earlier, as per original Indian patent act<br />
1970, patents were granted on the basis of process and not products, which helped to build<br />
the basis of a strong and competitive domestic pharmaceutical industry. Indian<br />
pharmaceutical industry had price control mechanism that helped to deliver medicines at<br />
affordable prices to patients in India. Further, the burden of proof in case of infringement<br />
was on the patent holder.<br />
However, due to WTO commitments, India made two important amendments to the patent<br />
act. The first amendment introduced the mailbox system to grant exclusive marketing<br />
rights to post 1995 patent holders in other markets. The second amendment extended<br />
patent term to 20 years and shifted the burden of proof to the patent infringer.<br />
In 2005, the new Indian patent act was introduced to grant product patents to<br />
pharmaceuticals. The act defines the scope of patentability and pre-grant, post-grant<br />
opposition provisions, compulsory licensing and regulatory data protection<br />
Patentability: The patent act established product patent protection for the period of 20<br />
years. The act precludes salts, esters, isomers, polymorphs, metabolites, pure form, particle<br />
size, combinations, derivatives of know substances etc. from patent protection unless they<br />
differ significantly in efficacy, thus effectively restricting patentability only to the NCEs<br />
Pre and Post grant opposition: Both pre and post-grant opposition have been introduced<br />
allowing oral hearing. Opposition can be filed any time from the date of publication of the<br />
patent to the date of grant. This could result into several pre-grant oppositions being filed<br />
causing delay in patent granting process.<br />
Pre-grant oppositions have proven to be a big impediment to patent issuance in India. This<br />
allows anyone to file opposition patents on any of 11 potential grounds for 6 months after<br />
a patent application is published but before the patent is granted. India is the only country<br />
in the world with such a system. Multinational companies claim that domestic companies<br />
are using sequential filings to delay patents, and point to there being no mechanism to<br />
dismiss even the most frivolous oppositions. PhRMA reports than 200 pre-grant oppositions<br />
were pending as of early 2009 and most of these concerned pharmaceuticals (PhRMA,<br />
2009). In addition, there is no mechanism for the applicant to respond and this is likely to<br />
be of significant concern to branded pharmaceutical companies.<br />
August 2011 33
Domestic Formulations | <strong>New</strong> Peaks<br />
Compulsory licensing: Under Paragraph 6 of the DOHA Declaration on TRIPS and<br />
Public Health (from 2001), India is permitted to use compulsory licenses under which the<br />
government forces a patent holder to grant use of a given product to the state. The patent<br />
holder will be entitled for compensation from licensee. CL will be available for export to<br />
developing countries such as in Africa which have insufficient or no manufacturing capacity<br />
in cases of national health emergencies. Thus Indian generics industry has benefited from<br />
compulsory licenses issued in other developing markets. Scope of compulsory licensing<br />
has been broadened to include affordability, non-working of patent etc. The Department<br />
of Industrial Policy and Promotion is considering developing new guidelines to enable the<br />
use of compulsory licensing beyond emergencies, such as in view of anti-competition law<br />
and high drug prices. This could threaten the companies in the long term, particularly if<br />
licenses are used in situations other than emergencies, suggesting they could be used<br />
more liberally.<br />
Regulatory data protection: Regulatory data protection is an integral part of IPR.<br />
Lack of the provision will be a disincentive to R&D based companies and innovators. The<br />
issue is in active consideration.<br />
Since the Patent Amendment Act of 2005, product in addition to process patents are<br />
recognized in India. However, from the perspective of the research-based drug industry,<br />
there are several problems with the IP environment in India. Pharmaceuticals are fighting<br />
to enforce patent linkage in India and meanwhile a string of product patent rejections have<br />
reduced confidence in the Indian market. Despite improvements to the patent legislation,<br />
issues over ever-greening mean that some brands may not necessarily receive patent<br />
protection in India - a move that is detrimental to branded players, but provides a significant<br />
opportunity for domestic generics manufacturers. So far certain drug classes, such as<br />
those that are viewed as expensive life-saving drugs, including cancer and HIV<br />
medication, have been most affected indicating for such drugs it may be more difficult to<br />
patent in India as the legal system is more likely to apply its discretion in the interpretation<br />
of the law and prevent those drugs from being patented.<br />
Roche was the first company to have a patent granted in India under the new patent<br />
regime in February 2006, a patent for Pegasus (paginated interferon alpha-2a) was granted.<br />
However, since then several different product patent applications for other drugs have<br />
been refused. Most recently, the Indian Patent Office rejected Roche's product patent for<br />
its new formulation of the cytomegalovirus infection treatment Calcite (valganciclovir). In<br />
August 2009, India rejected patent applications for Viread (tenofovir, Gilead) - a frontline<br />
drug against human immunodeficiency virus/acquired immunodeficiency syndrome (HIV/<br />
AIDS) in developing countries. Such patent rejections will undoubtedly lower confidence<br />
in the Indian market as such occurrences are no longer seen as isolated events.<br />
This indicates that certain drug classes, such as those that are viewed as expensive lifesaving<br />
drugs, including cancer and HIV medication, may be more difficult to patent in<br />
India as the legal system is more likely to apply its discretion in the interpretation of the<br />
law and prevent those drugs from being patented. This could have a significant impact on<br />
the pharmaceutical companies' choice of products to be marketed in India. However, it is<br />
not all bad news for pharmaceutical players, with some companies managing to emerge<br />
August 2011 34
Domestic Formulations | <strong>New</strong> Peaks<br />
from the patent system triumphant. In February 2008, Johnson & Johnson secured a key<br />
patent for its antiretroviral drug Intelence (etravirine), making it the second antiretroviral<br />
therapy to attain exclusivity in India after Pfizer's Selzentry (maraviroc). This strengthened<br />
the company's position in the Indian market, and is likely to have given the pharmaceutical<br />
industry in general some hope.<br />
Pricing regulations and role of NPPA<br />
National Pharmaceutical Pricing Authority (NPPA) is responsible for pricing decisions in<br />
India. This body falls under the Ministry of Chemicals and Fertilizers and was established<br />
in 1997. The NPPA is responsible for setting and regulating the prices of bulk drugs and<br />
monitoring the availability of treatments in the market to identify shortages and take remedial<br />
steps. The body also maintains data on exports and imports as well as market shares and<br />
the profitability of individual companies. NPPA regulates the prices of certain drugs/<br />
formulations known as 'controlled bulk drugs', while also keeping a tab on the prices of<br />
drugs not in this list so that they are maintained at reasonable levels. Two main criteria are<br />
used for identifying controlled drugs: the drug should be of a mass consumption nature and<br />
there should be an absence of sufficient competition for the drug.<br />
As per the Drugs Prices Control Order (DPCO) of 1997, the NPPA is responsible for<br />
fixing and revising the prices of certain controlled bulk drugs and formulations. In 1970,<br />
the first DPCO was introduced, bringing in direct controls on the profitability of<br />
pharmaceutical businesses: a maximum of 15% pre-tax profit alongside an indirect control<br />
on prices. A revision introduced in 1979 established a price ceiling for certain controlled<br />
bulk drugs and formulations. This revision tried to regulate the retail prices by permitting a<br />
mark-up on ex-factory costs and around 370 drugs were implicated with direct price<br />
controls, a measure that affected 80% of the companies in the market.<br />
The subsequent revisions to the legislation reduced the number of controlled drugs to 142<br />
in 1987, 76 in 1995 and 74 in 1997.<br />
Pricing: The DPCO fixes ceiling price for some of the APIs and formulations. The APIs<br />
and formulations falling under the purview of the legislation are called scheduled drugs.<br />
The NPPA is responsible for the collection of data and study of pricing structures of APIs<br />
and formulations, and provides recommendation to the Ministry of Chemical and Fertilizers.<br />
Currently, 74 bulk drugs and the formulation thereof are under the preview of price control.<br />
Pricing of scheduled bulk drugs: Scheduled bulk drugs are allowed prices (excluding<br />
local taxes) that results in post tax return of 14% on net worth (share capital + free<br />
reserves - value of investments not related to bulk drug business), or a 22% return on<br />
capital employed (fixed asset + working capital). Vis-à-vis a new plant an internal rate of<br />
return based on long term marginal costing is allowed. For a bulk drug produced from the<br />
basic stage, a post tax return of 18% on net worth or a return of 26% of capital employed<br />
is allowed. The NPPA sanctions prices after reviewing detailed supporting calculations,<br />
and only when the approval is sanctions can players go ahead with the sale of the drug.<br />
Sanctioned prices can not be revised without prior approval. When there is one manufacturer<br />
of the bulk drug, the maximum sale price is fixed at 2/3rd of the cutoff level or weighted<br />
average price, depending upon the situation.<br />
August 2011 35
Domestic Formulations | <strong>New</strong> Peaks<br />
Pricing of scheduled formulations manufactured in India: Scheduled formulations are based<br />
on the formula:<br />
RP = (MC+CC+PM+PC) x (1+MAPE/100) + ED<br />
RP: Retail Price<br />
MC: Material Cost<br />
CC: Conversion Cost<br />
PM: Packaging Material<br />
PC: Packaging Charges<br />
MAPE: Maximum Allowable Post Manufacturing Expenses<br />
ED: Excise Duty<br />
MAPE is intended to cover all the costs incurred by a manufacturer after packing - that is,<br />
transport, manufacturer's profit, dealer/retailer's profit etc. As per current order MAPE<br />
should not exceed 100%. Local taxes are added on at the wholesaler/retailers level and<br />
are not part of retail price as above.<br />
Further, the margins earned by distributors and retailers are also regulated. The maximum<br />
margin that a distributor can take is 8% of the maximum retail price; the highest permitted<br />
margin is 16% for retailers. In the case of decontrolled drugs, the margin set for distributors<br />
is 10%, while for retailers it is 20%. The NPPA further ensures that manufacturers do not<br />
remove the price-controlled brands from the market so that essential medicines are still<br />
available for customers. In spite of these regulations, however, violations have been observed<br />
quite frequently. For instance, a study noted that companies market products with pricecontrolled<br />
ingredients without getting the price fixed by the NPPA, even though theoretically<br />
they are required to obtain an official price from the NPPA every time the price of the<br />
controlled ingredient is revised.<br />
Proposed new pharmaceutical policy<br />
The proposed pharmaceutical policy talks about bringing 354 essential drugs under the<br />
purview of the DPCO. Reportedly, this account for ~50% of the industry sales. The new<br />
policy is likely to allow MAPE of 150% with an additional 50% margin for the companies<br />
that invest sufficient on new drug research.<br />
Currently, there is lot of pressure being built on the government by players and key<br />
pharmaceutical associations to revoke the new draft, as the industry views this policy as<br />
regressive in nature. However, it is difficult to comment on the implications of the proposed<br />
price control order before the final verdict is in place. If implemented in the current form,<br />
the new policy will have significant adverse impact on the domestic formulations players.<br />
August 2011 36
Domestic Formulations | <strong>New</strong> Peaks<br />
Companies<br />
Companies<br />
Top buys<br />
• Cipla<br />
• Lupin<br />
• Torrent Pharma<br />
• GSK Pharma<br />
Others<br />
• Sun Pharma<br />
• Cadila<br />
• Ranbaxy<br />
• Dr. Reddy's Labs<br />
• Glenmark<br />
August 2011 37
Domestic Formulations | <strong>New</strong> Peaks<br />
MEDICINES<br />
MEDICINES CAPSULE Score<br />
66/100<br />
Improving asset utilization<br />
Cipla<br />
CMP: INR281<br />
CIPLA IN<br />
TP: INR361 Buy<br />
M: Mix 6/10<br />
Cipla offers a balanced play on chronic and acute<br />
therapeutic segments.<br />
Cipla derives 42% revenue from chronic therapeutic<br />
areas and has a dominant presence in large<br />
segments like anti-infective and CVS.<br />
It has leadership position in the respiratory<br />
segment.<br />
E: Equity with doctors 7/10<br />
Cipla has strong brand equity in some of the largest<br />
therapeutic segments in the industry and ranks<br />
first in the respiratory segment, fourth in the anitinfective<br />
and fifth in the CVS segments.<br />
Based on prescription ranking, Cipla is the market<br />
leader in the anti-infective and respiratory segments<br />
and it is among the leaders in the pain management<br />
and CVS segments.<br />
D: Distribution & reach 8/10<br />
Cipla derives 63% of its revenue from metros and<br />
tier-I cities. Distribution in metros and tier-I towns<br />
increased over time and Cipla is expanding its<br />
reach in tier-II to tier-VI towns.<br />
It has one of the largest field force in the industry<br />
with an MR strength of 5,100.<br />
I: Introductions 6/10<br />
Cipla has been one of the most aggressive players<br />
in launching new products.<br />
It launched 76 new products a year over the past<br />
four years.<br />
The ramp-up in domestic formulations revenue has<br />
been driven by existing products and new launches<br />
over the past four years.<br />
Stock info<br />
Equity Shares (m) 802.9<br />
52-Week Range (INR) 381/275<br />
1,6,12 Rel. Perf. (%) 2/3/0<br />
M.Cap. (INR b) 225.6<br />
M.Cap. (USD b) 4.9<br />
Financial & valuation summary<br />
Year Net Sales PAT EPS EPS P/E P/BV RoE RoCE EV/ EV/<br />
End (INR M) (INR M) (INR) GR. (%) (X) (X) (%) (%) Sales EBITDA<br />
03/10A 56,057 10,050 12.5 25.0 22.4 3.8 17.0 20.6 4.0 16.4<br />
03/11A 63,145 9,671 12.0 -3.7 23.3 3.4 14.5 15.8 3.6 17.4<br />
03/12E 69,193 10,760 13.4 11.1 21.0 3.0 14.4 17.2 3.3 14.5<br />
03/13E 79,041 13,177 16.4 22.2 17.1 2.7 15.6 18.8 2.8 12.1<br />
Background<br />
Cipla is a leading player in the domestic formulations market and has a presence across most therapeutic<br />
areas. The company also has robust exports to several markets including Europe, South Africa, Australia,<br />
US and the Middle East. Cipla's strategy for regulated markets (Europe and US) exports is built around<br />
supply tie-ups with global players.<br />
August 2011 38
Cipla<br />
Chairman Profile<br />
Chairman<br />
Barring the past two years, Cipla has been one of the most consistent performers amongst the Indian<br />
pharmaceutical companies. It was promoted by Dr K A Hamied and is currently managed by<br />
Dr Yusuf Hamied, the founder's son. Establishing a strong presence in India and emerging markets<br />
organically coupled with a low-risk conservative approach is his key achievement.<br />
C: CAGR and scale-up 6/10<br />
Cipla reported in line industry performance, posting<br />
revenue CAGR of 14% over FY05-11. The company<br />
scaled up the business rapidly over the years and<br />
gained market share from competitors, in certain<br />
key segments.<br />
We expect Cipla to post revenue CAGR of 12%<br />
over FY11-13, which is lower than the industry<br />
average, mainly due to a high base and intensifying<br />
competition in the anti-infection segment.<br />
I: Improvement in productivity 7/10<br />
Cipla did not improve its MR productivity over 2004-<br />
10 as sales growth was in line with MR additions.<br />
MR growth was 13.4% and revenue growth was<br />
13.7% over 2004-10<br />
Revenue per MR has been stagnant at INR4.9m<br />
over 2004-10 years. However, even at this level,<br />
productivity is above the industry average.<br />
Rapid scale-up in revenue will be difficult given the<br />
high base and sizable presence in highly<br />
competitive and slow growing acute segments.<br />
N: Non-domestic business 5/10<br />
We are positive on Cipla's international business,<br />
given its strong chemistry skills, large underutilized<br />
capacities and strong generic pipeline.<br />
Short-term performance may be muted until<br />
international regulatory authorities approve the new<br />
Indore SEZ.<br />
E: Earnings growth 7/10<br />
We expect overall top-line CAGR of 12% over FY11-<br />
13, leading to EPS CAGR of 17%.<br />
EPS growth is higher than top-line growth mainly<br />
due to our expectation of increased capacity<br />
utilization at Indore SEZ leading to better cost<br />
absorption.<br />
We expect the international business to post 13%<br />
revenue CAGR over FY11-13 led by 14% CAGR<br />
for formulation exports.<br />
Option values (approval for CFC-free inhalers and<br />
potential MNC contracts) can upgrade FY13 EPS.<br />
S: Stock Attractiveness 14/20<br />
Cipla has one of the most conservative<br />
managements among Indian pharma companies.<br />
Return ratios are muted pending utilization of<br />
significant capex over the past 2-3 years.<br />
Cipla is valued at 21.0x FY12E and 17.1x FY13E<br />
consolidated earnings.<br />
Reiterate Buy with a target price of INR361 (22x<br />
FY13E EPS) excluding potential upsides.<br />
Stock performance (1 year)<br />
Cipla<br />
Sensex - Rebased<br />
400<br />
360<br />
320<br />
280<br />
240<br />
Aug-10 Nov-10 Feb-11 May-11 Aug-11<br />
August 2011 39
Cipla<br />
India formulations<br />
snapshot<br />
Domestic formulations the<br />
largest business segment<br />
for Cipla : The domestic<br />
formulations business is the<br />
leading revenue contributor to<br />
Cipla's top-line though the<br />
contribution has fallen from<br />
75% in FY01 to 44% in FY11. It<br />
is Cipla's most profitable<br />
segment, with EBITDA<br />
contribution estimated at 44%.<br />
This business grew at 14%<br />
CAGR over the past six years.<br />
EBITDA Contribution<br />
Non-DF<br />
EBITDA, 56%<br />
5.1<br />
5.1<br />
5.3<br />
DF<br />
EBITDA,44%<br />
The largest Indian player in<br />
the industry<br />
Before Abbott took over<br />
Piramal Healthcare's domestic<br />
formulations business, Cipla<br />
was the leader in the domestic<br />
formulations market for a few<br />
years. Although Cipla occupies<br />
second position in the<br />
pharmaceuticals industry, it is<br />
the largest Indian company in<br />
the domestic formulations<br />
space. Cipla holds 5.24%<br />
market share in the<br />
pharmaceuticals industry ,<br />
which has grown from 5.05%<br />
in 2006. It posted revenue of<br />
14% CAGR over the past six<br />
years in line with the<br />
industry's CAGR of 14%.<br />
Market Share & growth<br />
Mkt Share (%)<br />
Grow th (%)<br />
16.5<br />
19.8<br />
16.2<br />
13.3 13.4<br />
5.3<br />
5.2<br />
2006 2007 2008 2009 2010<br />
Improving asset utilization<br />
Balanced play on chronic and acute therapeutic segments<br />
Cipla, a leading company in the domestic formulations space, has a strong presence in<br />
therapeutic segments such as AI, respiratory and CVS. Cipla has outperformed market<br />
growth over the past four years and has consistently improved its market share. Cipla offers<br />
a balanced play on lifestyle and acute therapeutic segments.<br />
1. Mix: 6/10<br />
Respiratory, AI, CVS, gynecology dominate sales<br />
The top four therapeutic segments, the respiratory, AI, CVS and gynecology segments,<br />
contribute ~70% of Cipla's domestic formulation revenue. Cipla is the market leader in<br />
two of the largest therapy segments, AI and respiratory segments, though dependence on<br />
AI has fallen over the years. Cipla derives 58% of its revenue from acute therapies and<br />
the rest from chronic therapeutic areas. Cipla's sizable presence in these segments makes<br />
it an attractive play in the domestic formulations business.<br />
Cipla: Therapeutic break-up<br />
Gynae<br />
cology<br />
2%<br />
CVS<br />
15%<br />
GI Pain<br />
FY01<br />
3% Mgmt<br />
6%<br />
Respira<br />
tory<br />
29%<br />
AI<br />
45%<br />
Dermatol<br />
ogy 3% CNS 3%<br />
HIV 3%<br />
Ophthal<br />
mology<br />
3%<br />
Pain 4%<br />
GI 6%<br />
Gynaec<br />
7%<br />
CVS<br />
12%<br />
FY11<br />
Others<br />
8%<br />
Respirat<br />
ory 31%<br />
AI 20%<br />
Source: Company/Industry/MOSL<br />
2. Equity with doctors: 7/10<br />
Good brand equity with physicians; strong positioning in respiratory, AI,<br />
CVS segments<br />
Cipla has been a dominant player in the AI, respiratory and CVS segments, three of the<br />
largest therapeutic segments of the industry. Cipla ranks first in the respiratory segment<br />
and fourth in the AI segment with market shares of 22.1% and 6.7% respectively. It ranks<br />
fifth in the CVS segment with market share of 5.9%. In most of these segments, Cipla has<br />
grown in line with market growth over the past two years.<br />
In terms of the number of prescriptions written, Cipla ranks first in the AI and respiratory<br />
segments with a prescription market share of 8.4% and 6.1% respectively and it ranks<br />
fourth and sixth in the CVS and pain management segments with a prescription market<br />
share of 5.1% and 3.4% respectively. In the AI, respiratory and CVS segments Cipla has<br />
maintained or improved its market ranking but in the other therapeutic segments it has lost<br />
out on ranking.<br />
August 2011 40
Cipla<br />
Market share in key therapies (%) (2010) Growth comparison (%) (2010)<br />
22.1<br />
Avg Gr - Company<br />
Avg Gr - Industry<br />
38.9<br />
6.7<br />
5.9<br />
8.2<br />
3.3<br />
18.4<br />
19.9<br />
15.9 17.9<br />
18.1 18.4<br />
15.0 16.2<br />
14.6<br />
AI CVS Respiratory Gynaecology Dermatology<br />
AI CVS Respiratory Gynaecology Dermatology<br />
* Average growth over 2009-2010 Source: Industry/MOSL<br />
Cipla's prescription ranking<br />
Jan-07 Jan-08 Jan-09 Jan-10 Oct-10<br />
Anti-infectives 1 1 1 1 1<br />
Respiratory 1 1 2 1 1<br />
CVS 5 5 4 4 4<br />
Pain Mgmt 4 5 5 4 5<br />
CNS 8 8 8 10 11<br />
GI 11 10 8 11 13<br />
Derma 10 12 15 15 12<br />
Vit 11 11 14 13 13<br />
Gynaec - - 21 18 21<br />
Source: Industry/MOSL<br />
Top 10 brands contribute 30% of revenue<br />
Cadila's top 10 brands contribute ~30% to total revenue, indicating lower brand<br />
concentration. All Cipla's top 10 brands feature among the top 300 brands of the industry.<br />
Its No1 brand Asthalin (Salbulamol, in the respiratory segment) ranks fourteenth in the<br />
industry and reported growth of 11.7% CAGR over the past four years . Cipla's top four<br />
brands belong to the respiratory segment.<br />
Cipla's top 10 brands<br />
Brand Drug Product Launch Sales (INR m) YoY Gr (%) CAGR (%)<br />
Seroflo Salmeterol+Fluticasone 2000 925 7.0 8.2<br />
Asthalin Salbutamol 1993 1,268 9.8 11.7<br />
Aerocort Salbutamol+Beclomethasone 2008 836 12.4 -<br />
Foracort Formoteral+Budesonide 2001 761 23.2 22.0<br />
Mt pill Mifepriston 2002 654 -4.8 14.6<br />
Novamox Amoxycillin 1980 878 14.2 9.3<br />
Ciplox Ciprofloxacin 1989 818 11.4 8.9<br />
Duolin Salbutamol+Ipratropium 2006 503 26.3 60.1<br />
Amlopres-at Atenolol+Amlodipine 1996 439 4.1 8.4<br />
Budecort Budesonide 1994 423 24.7 18.5<br />
CAGR through 2006-10<br />
Source: Industry/MOSL<br />
3. Distribution and reach: 8/10<br />
Cipla derives 63% of its revenue from metros and class-I towns, in line with the industry<br />
average. Over the past four years, Cipla's revenue CAGR in rural and metro areas, has<br />
been better than that of industry average.<br />
August 2011 41
Cipla<br />
Cipla: Geographical distribution of revenues (%) Industry: Geographical distribution of revenues (%)<br />
METROS CLASS I TOWNS CLASS II TO VI RURAL<br />
23.0 24.2 22.3 19.2 18.3<br />
METROS CLASS I TOWNS CLASS II TO VI RURAL<br />
20.6 20.9 20.0 18.1 17.3<br />
17.9 18.4 18.0<br />
17.9 18.6<br />
19.2 19.0 19.5 19.4 19.6<br />
29.6 27.9 28.8 30.1 30.3<br />
32.6 31.3 31.6 32.5 32.0<br />
29.6 29.5 30.8 32.8 32.7<br />
27.6 28.9 28.9 30.0 31.0<br />
CY06 CY07 CY08 CY09 CY10<br />
CY06 CY07 CY08 CY09 CY10<br />
Cipla: Geography-wise growth rates (%) Industry: Geography-wise growth rates (%)<br />
19.2<br />
16.5<br />
13.0<br />
7.0<br />
METROS<br />
CLASS II TO VI<br />
21.6<br />
20.3<br />
14.2<br />
7.7<br />
CLASS I TOWNS<br />
RURAL<br />
20.7<br />
18.6<br />
12.3<br />
25.0<br />
20.5<br />
19.5<br />
14.4<br />
17.6<br />
14.0<br />
11.1<br />
7.9<br />
METROS<br />
CLASS II TO VI<br />
17.5<br />
15.6<br />
14.7<br />
9.5<br />
CLASS I TOWNS<br />
RURAL<br />
17.7<br />
16.4<br />
13.0<br />
26.2<br />
23.5<br />
20.7<br />
17.5<br />
-2.6<br />
CY07 CY08 CY09 CY10<br />
2.5<br />
CY07 CY08 CY09 CY10<br />
Source: Industry/MOSL<br />
4. Introductions: 6/10<br />
Among the most aggressive players in the industry in product launches;<br />
revenue-per-new-launch rises<br />
Over the past four years, Cipla launched 76 new products (including line extensions)<br />
annually and the average revenue per new launch almost doubled, suggesting better<br />
penetration of launched brands. Overall, revenue growth was driven by existing products<br />
and new launches.<br />
Cipla: <strong>New</strong> launches Cipla: Growth composition (%)<br />
No. Of launches in last 2 yrs<br />
Avg sales per launch (INR m)<br />
105.0<br />
<strong>New</strong> Launches<br />
Existing Brands<br />
54.2<br />
53.8<br />
85.6<br />
8.0<br />
11.0 3.4<br />
12.1<br />
131 157 205 147<br />
5.3 5.6<br />
9.9<br />
7.7<br />
CY07 CY08 CY09 CY10<br />
CY07 CY08 CY09 CY10<br />
Source: Industry/MOSL<br />
August 2011 42
Cipla<br />
5. CAGR and scale up: 6/10<br />
We expect Cipla's domestic formulations business to post 12% CAGR over FY11-13, led<br />
by one of the largest field forces and rapid new launches but partly tempered down by a<br />
large base effect and increasing competition in some of the acute therapeutic segments.<br />
This is below our forecast of 15-16% CAGR for the industry. Cipla is likely to maintain its<br />
leadership in the sector given its high market share in some of the largest therapeutic<br />
segments. Although Cipla employs the largest field force in the industry, its focus on<br />
enhancing workforce productivity must be enhanced, for more profitable growth.<br />
Cipla: Domestic formulations performance<br />
DF Revenue (INR m) YoY Grow th (%)<br />
17.7<br />
16.7<br />
12.9<br />
15.2<br />
10.2<br />
12.2<br />
10.0<br />
13.5<br />
15,014<br />
17,523<br />
19,783<br />
22,786<br />
25,113<br />
28,178<br />
30,995<br />
35,180<br />
FY06 FY07 FY08 FY09 FY10 FY11 FY12E FY13E<br />
Source: Company/MOSL<br />
6. Improvement in MR productivity: 7/10<br />
Sales force additions drive top-line growth<br />
Over FY04-10, Cipla's domestic formulations business posted revenue CAGR of 13.7%<br />
while its sales force grew at a CAGR of 13.4%, implying marginal productivity improvement<br />
of the salesforce. In 2004, Cipla derived INR4.8m revenue per MR, which increase<br />
marginally to INR4.9m in FY10, which is still above industry average.<br />
Cipla: Sales force productivity (2004-10)<br />
No. of MRs Revenue per MR (INR m)<br />
4.9<br />
Sales force addition CAGR (%)<br />
Productivity Improvement CAGR (%)<br />
4.8<br />
13.4<br />
11.5<br />
2,400 5,100<br />
2004 2010<br />
0.3<br />
Cipla<br />
1.9<br />
Industry<br />
Source: Industry/Company/MOSL<br />
August 2011 43
Cipla<br />
7. Non-domestic business: 5/10<br />
Cipla's non-domestic business<br />
Positives<br />
• Strong presence in emerging markets through partners.<br />
• Strong chemistry skills and fully backward integrated low-cost operations.<br />
• Low-risk partnership model<br />
• Large underutilized capacities.<br />
• Has one of the largest global CFC-free inhaler capacities.<br />
• Potential tie-ups with MNCs.<br />
Risks and concerns<br />
• Temporary mismatch between expenses on new SEZ without commensurate revenue<br />
streams pending regulatory approval.<br />
• Working capital intensive.<br />
• Lack of succession planning.<br />
• Delay in planning capacity expansions for future growth.<br />
Key news flow/triggers<br />
• Regulatory approvals for a new SEZ.<br />
• Regulatory approvals for CFC-free inhalers in Europe.<br />
• Signing of supply agreements with MNCs.<br />
Impact assessment<br />
• We are positive on Cipla's international business given its strong chemistry skills, large<br />
underutilized capacities and strong generic pipeline.<br />
• Short-term performance may be muted until international regulatory authorities approve<br />
the new Indore SEZ.<br />
• Expect international business to record 13% CAGR over FY11-13, led by 14% CAGR<br />
of formulation exports.<br />
• Option values (approval for CFC-free inhalers and potential MNC contracts) can<br />
upgrade FY13 EPS.<br />
Sales mix (INR m)<br />
FY09 FY10 FY11 FY12E FY13E FY11-13<br />
CAGR (%)<br />
Domestic 22,786 25,113 28,178 30,995 35,180 11.7<br />
% of revenues 43.0 44.4 44.3 44.4 44.2<br />
Exports 27,430 29,004 33,548 36,971 42,645 12.7<br />
% of revenues 51.8 51.3 52.8 53.0 53.5<br />
Formulations 21,635 23,188 26,756 29,431 34,729 13.9<br />
APIs 5,795 5,816 6,792 7,539 7,916 8.0<br />
Other Operating Income 2,737 2,462 1,842 1,775 1,838 -0.1<br />
% of revenues 5.2 4.4 2.9 2.5 2.3<br />
Total Revenues 52,953 56,579 63,567 69,741 79,663 11.9<br />
Source: Company/MOSL<br />
EBITDA Contribution<br />
Non-DF<br />
EBITDA<br />
56%<br />
DF<br />
EBITDA<br />
44%<br />
Source: Company/MOSL<br />
August 2011 44
Cipla<br />
8-9. Earnings growth and stock attractiveness: 21/30<br />
We believe Cipla has one of the strongest generic pipelines among Indian companies.<br />
After a long delay, we believe Cipla's CFC-free inhaler pipeline is likely to be gradually<br />
commercialized in Europe and upsides from high-margin opportunities like Seretide can<br />
potentially come through over the next two years (our estimates do not include these<br />
upsides).<br />
Cipla's large manufacturing infrastructure, strong chemistry skills and huge inhaler capacity<br />
make it a partner of choice for global MNCs that are ramping up their generics and<br />
presence in emerging markets. This, along with its low-risk strategy and a strong capex<br />
(currently underutilized) should ensure good long-term potential.<br />
Temporary slow-down in overall growth, increased expenses to maintain its Indore SEZ<br />
without commensurate revenue and increasing working capital requirements are our key<br />
concerns.<br />
We estimate base-case EPS CAGR at 17% over FY11-13 with potential upsides from<br />
MNC supplies and CFC-free inhalers. The growth will be led by 13% CAGR for the<br />
international business, tempered by reducing technology licensing income.<br />
We are positive on Cipla's long-term prospects (especially upsides from MNC contracts<br />
and commercialization of CFC-inhalers). Cipla's management has officially confirmed<br />
that it is negotiating supply contracts with MNCs. However, it is taking time to consummate<br />
the deal. When details of such contracts are made public, we expect an upgrade in earnings<br />
to take into account upsides from such contracts. Maintain Buy with a target price of<br />
INR361 (22x FY13E EPS).<br />
Cipla RoE & RoCE (%)<br />
Cipla one year forward P/E<br />
19.1<br />
18.7<br />
17.9<br />
17.1<br />
RoE<br />
17.0<br />
20.6<br />
14.5<br />
15.8<br />
RoCE<br />
14.4<br />
17.2<br />
18.8<br />
15.6<br />
32<br />
27<br />
22<br />
P/E (x) Avg(x) Peak(x) Min(x)<br />
29.5<br />
22.8<br />
17<br />
19.1<br />
12<br />
15.4<br />
2008 2009 2010 2011 2012E 2013E<br />
Aug-06<br />
Mar-07<br />
Aug-07<br />
Feb-08<br />
Aug-08<br />
Feb-09<br />
Aug-09<br />
Feb-10<br />
Aug-10<br />
Feb-11<br />
Aug-11<br />
August 2011 45
Cipla<br />
Annexure: Cipla non-domestic business<br />
Strong generic pipeline<br />
In the US, Cipla entered into partnership for 118 products with 22 partners. The number of<br />
partners increased from 17 to 22 over the past 18 months. Of the pipeline of 110 ANDAs<br />
filed so far, 64 have been approved and 46 are awaiting approval.<br />
Strengthening US parnerships (nos)<br />
17<br />
22<br />
8<br />
12<br />
FY07 FY08 FY09 FY10<br />
Source: Company/MOSL<br />
Strong capex…<br />
Over the past three years, Cipla invested INR18b in expanding its formulations, API and<br />
R&D capacities. A large portion is this capex is underutilized pending facility/product<br />
approvals from international regulatory authorities.<br />
Cipla's gross block (INR b)<br />
43.3<br />
10.9<br />
14.5<br />
18.7<br />
24.3<br />
30.6<br />
35.8<br />
FY05 FY06 FY07 FY08 FY09 FY10 FY11<br />
Source: Company/MOSL<br />
…can lead to INR36b in revenue over the next few years<br />
Going by Cipla's past asset-turnover ratios, we estimate this large capex can generate<br />
INR36b in revenue in the next few years. This compares favorably with reported revenue<br />
of INR56b in FY10 and revenue of INR63b in FY11. Cipla's management is known for its<br />
conservative, low-risk strategy, which implies it would not have embarked on such a large<br />
capex without reasonable revenue visibility.<br />
Significant expenses on Indore SEZ; commensurate revenue to ramp-up<br />
Cipla has invested significant amounts of money, on setting up facilities, over the past 2-3<br />
years. One of its large investments has been in the INR8b Indore SEZ, commissioned in<br />
1QFY11. This is one of the largest investments in an SEZ by a pharmaceutical company.<br />
August 2011 46
Cipla<br />
The company is incurring expenses of INR250m-300m per quarter on this SEZ without<br />
commensurate revenue, pending regulatory approvals. We believe the company is facing<br />
a temporary mismatch between timing of such expenses and commensurate revenue<br />
streams from this investment.<br />
The Cipla management has indicated regulatory authorities from the UK, Australia and<br />
South Africa had recently inspected this facility. It expects exports to these markets to<br />
ramp-up up gradually in forthcoming quarters. The US FDA inspection is yet to take<br />
place. The management also indicated it expected this SEZ to contribute 10-12% to overall<br />
sales by the end of FY12. This is a key factor impacting Cipla's operational performance.<br />
Potential MNC contracts can upgrade earnings, negotiations ongoing<br />
Cipla is negotiating with some MNCs like Pfizer, GSK and Boehringer for long-term<br />
supply agreements. Generally, such deals span many products and multiple markets. These<br />
potential contracts are likely to raise earnings for FY13 (not included in our estimates).<br />
We believe Cipla is well positioned to emerge as a key supplier of generic products to<br />
global MNC companies due to its large manufacturing infrastructure, strong chemistry<br />
skills and large capacity for inhalers.<br />
Pfizer Partnership: Potential Upsides<br />
Pfizer's generic revenue (USD b) 10<br />
Estimated mark up over outsourced products (%) 25<br />
Outsourced products (percentage of total) - assumed 50<br />
Cost of outsourced products for Pfizer (USD b) 4<br />
Upside for Cipla Low Case Moderate Case High Case<br />
Cipla's contribution to Pfizer's outsourcing (%) 1 5 10<br />
Sales (USD m) 40 200 400<br />
INR/USD - assumed 43 43 43<br />
Sales (INR m) 1,720 8,600 17,200<br />
PAT Margin (%) - assumed 15 15 15<br />
PAT (INR m) 258 1290 2580<br />
Incremental EPS 0.3 1.6 3.2<br />
Source: Company/MOSL<br />
CFC-free inhalers a key long-term trigger<br />
Cipla has the third largest global capacity for inhalers and has been the domestic market<br />
leader in the segment over years. Cipla has the advantage of strong chemistry skills and<br />
low-cost of production in this segment.<br />
Inhaler capacity has increased...<br />
... but utilization is at the lowest<br />
Aerosols/Inhalation Devices Capacity (m)<br />
143<br />
89<br />
Aerosols/Inhalation Devices Capacity Utilization (%)<br />
46<br />
54<br />
71 71<br />
96 96<br />
80<br />
67<br />
77<br />
64<br />
56<br />
38<br />
FY05 FY06 FY07 FY08 FY09 FY10 FY11<br />
FY05 FY06 FY07 FY08 FY09 FY10 FY11<br />
Source: Company/MOSL<br />
August 2011 47
Cipla<br />
Cipla is developing eight inhalers and has the third largest inhaler manufacturing capacity<br />
globally. It has commercialized some of its inhalers in the UK, Germany, Spain and Portugal.<br />
While the launch of these inhalers is a key long-term trigger, the visibility of launch timelines<br />
is poor. The management expects its range of eight inhalers to be commercialized in<br />
Europe over the next 2-3 years and it expects 3-6 players for each product in this category,<br />
implying that this will be a low-competition, high-margin opportunity.<br />
Through its partner, Neo Labs, Cipla filed for regulatory approval of a generic Seretide<br />
Inhaler (GSK's US$6.5b global brand with US$250m sales in the UK) in September 2008<br />
in the UK, after the expiry of GSK's data exclusivity. We believe that approval for this<br />
product is likely to come through over the next few quarters. Our estimates do not include<br />
these upsides.<br />
CFC-free Inhalers: Potential Upside<br />
Current global market size of inhalers (USD b) 17<br />
No of generic players including Cipla (assumed) 6<br />
Price erosion (%) (assumed) 70%<br />
Addressable market size (USD b) 5.1<br />
Upside for Cipla Low Case Moderate Case High Case<br />
Cipla's market share (%) 1 3 5<br />
Sales (USD m) 51 153 255<br />
INR/US dollar (assumed) 43 43 43<br />
Sales (INR m) 2,193 6,579 10,965<br />
PAT margin (%) (assumed) 20 20 20<br />
PAT (INR m) 439 1,316 2,193<br />
Incremental EPS 0.5 1.6 2.7<br />
Source: Industry/MOSL<br />
Reducing technology licensing income<br />
Given Cipla's partnership model, it earns licensing income from its partners. This income<br />
has been a key contributor to Cipla's earnings and it recorded 26% CAGR to INR1.5b<br />
over FY07-10. However, this has fallen to INR637m by FY11, adversely impacting Cipla's<br />
earnings growth (licensing income has 100% contribution to the company's PBT).<br />
Reducing licensing income<br />
Tech Licensing Income (INR m)<br />
2,178<br />
1,534<br />
1,538<br />
415 424<br />
765<br />
637<br />
510 510<br />
FY05 FY06 FY07 FY08 FY09 FY10 FY11 FY12E FY13E<br />
Source: Company/MOSL<br />
Forex cover - currently under hedged<br />
Cipla's management continues with its policy of hedging net exposure on a monthly basis.<br />
Current forex hedges are US$190m (down from USD230m in September 2010), which<br />
we believe will be inadequate if the rupee were to appreciate significantly against the US<br />
dollar. We believe Cipla is under-hedged, given its annual net exposure of ~US$300m as<br />
well as some exposure to the euro.<br />
August 2011 48
Cipla<br />
Financials and valuations: Cipla<br />
Income Statement<br />
(INR Million)<br />
Y/E March 2010 2011 2012E 2013E<br />
Gross Sales 54,117 61,798 67,966 77,825<br />
Change (%) 7.8 14.2 10.0 14.5<br />
Exports 29,004 33,548 36,971 42,645<br />
Net Domestic Sales 24,592 27,755 30,447 34,558<br />
Other Operating Income 2,462 1,842 1,775 1,838<br />
Net Income 56,057 63,145 69,193 79,041<br />
Change (%) 7.1 12.6 9.6 14.2<br />
Total Expenditure 42,315 49,927 53,550 60,726<br />
EBITDA 13,742 13,218 15,643 18,315<br />
Margin (%) 24.5 20.9 22.6 23.2<br />
Depreciation 1,671 2,542 3,144 3,476<br />
EBIT 12,071 10,677 12,499 14,839<br />
Int. and Finance Charges 230 173 283 126<br />
Other Income - Rec. 469 1,122 1,234 1,357<br />
PBT before EO Items 12,311 11,625 13,450 16,070<br />
Extra Ordinary Expense -950 0 0 0<br />
PBT but after EO Exp. 13,261 11,625 13,450 16,070<br />
Tax 2,435 1,954 2,690 2,893<br />
Tax Rate (%) 18.4 16.8 20.0 18.0<br />
Reported PAT 10,826 9,671 10,760 13,177<br />
Adj PAT 10,050 9,671 10,760 13,177<br />
Change (%) 29.4 -3.8 11.3 22.5<br />
Margin (%) 17.9 15.3 15.6 16.7<br />
Balance Sheet<br />
(INR Million)<br />
Y/E March 2010 2011 2012E 2013E<br />
Equity Share Capital 1,606 1,606 1,606 1,606<br />
Reserves 57,410 64,966 73,036 82,918<br />
Revaluation Reserves 90 90 90 90<br />
Net Worth 59,106 66,661 74,731 84,614<br />
Loans 51 5,719 3,719 480<br />
Deferred Liabilities 1792 2131 1351 869<br />
Capital Employed 60,948 74,511 79,801 85,962<br />
Gross Block 28,973 42,411 47,411 51,911<br />
Less: Accum. Deprn. 8,861 11,465 14,609 18,085<br />
Net Fixed Assets 20,112 30,946 32,802 33,826<br />
Capital WIP 6,842 2,853 2,853 2,853<br />
Investments 2,464 5,904 5,904 5,904<br />
Ratios<br />
Y/E March 2010 2011 2012E 2013E<br />
Basic (INR)<br />
EPS 12.5 12.0 13.4 16.4<br />
Cash EPS 14.6 15.2 17.3 20.7<br />
BV/Share 73.5 82.9 93.0 105.3<br />
DPS 4.7 6.5 5.7 7.0<br />
Payout (%) 19.8 30.8 25.0 25.0<br />
Valuation (x)<br />
P/E 23.0 20.7 16.9<br />
PEG (x) -6.1 1.8 0.8<br />
Cash P/E 18.2 16.0 13.4<br />
P/BV 3.3 3.0 2.6<br />
EV/Sales 3.6 3.2 2.8<br />
EV/EBITDA 17.2 14.3 12.0<br />
Dividend Yield (%) 2.4 2.1 2.5<br />
Return Ratios (%)<br />
RoE 17.0 14.5 14.4 15.6<br />
RoCE 20.6 15.8 17.2 18.8<br />
Working Capital Ratios<br />
Fixed Asset Turnover (x) 2.8 2.5 2.2 2.4<br />
Debtor (Days) 102 86 93 89<br />
Inventory (Days) 98 110 107 103<br />
Working Capital (Days) 201 195 191 183<br />
Leverage Ratio (x)<br />
Current Ratio 3.6 4.0 3.7 3.7<br />
Debt/Equity 0.0 0.1 0.0 0.0<br />
Cash Flow Statement<br />
(INR Million)<br />
Y/E March 2010 2011 2012E 2013E<br />
Op. Profit/(Loss) before Tax 13,742 13,218 15,643 18,315<br />
Interest/Dividends Recd. 469 1,122 1,234 1,357<br />
Direct Taxes Paid -2,285 -1,614 -3,470 -3,375<br />
(Inc)/Dec in WC -1,289 -2,889 -2,367 -3,359<br />
CF from Operations 10,637 9,837 11,039 12,938<br />
EO expense -950 0 0 0<br />
CF from Oper. incl EO Exp. 11,587 9,837 11,039 12,938<br />
Curr. Assets 43,673 46,599 52,259 59,620<br />
Inventory 15,126 19,062 20,318 22,209<br />
Account Receivables 15,666 14,908 17,690 19,190<br />
Cash and Bank Balance 621 1,010 2,077 3,855<br />
Others 12,260 11,619 12,175 14,367<br />
Curr. Liability & Prov. 12,144 11,791 14,017 16,241<br />
Account Payables 12,144 11,791 14,017 16,241<br />
Net Current Assets 31,530 34,808 38,242 43,380<br />
Appl. of Funds 60,948 74,511 79,801 85,962<br />
E: MOSL Estimates<br />
(inc)/dec in FA -5,037 -9,386 -5,000 -4,500<br />
(Pur)/Sale of Investments -1,651 -3,440 0 0<br />
CF from Investments -6,688 -12,826 -5,000 -4,500<br />
Issue of Shares 6,912 867 0 0<br />
Inc/(Dec) in Debt -9,352 5,668 -2,000 -3,239<br />
Interest Paid -230 -173 -283 -126<br />
Dividend Paid -2,139 -2,983 -2,690 -3,294<br />
CF from Fin. Activity -4,809 3,379 -4,973 -6,660<br />
Inc/Dec of Cash 91 390 1,066 1,779<br />
Add: Beginning Balance 530 621 1,010 2,077<br />
Closing Balance 621 1,010 2,077 3,855<br />
August 2011 49
Domestic Formulations | <strong>New</strong> Peaks<br />
MEDICINES<br />
MEDICINES CAPSULE Score<br />
62/100<br />
Transformed transnational<br />
Lupin<br />
CMP: INR450<br />
LPC IN<br />
TP: INR514 Buy<br />
M: Mix 5/10<br />
Lupin is a balanced play on the domestic chronic<br />
and acute therapeutic segments.<br />
The company derives 43% revenue from chronic<br />
therapeutic areas. The respiratory, AI, CVS and<br />
Anti-TB segments contribute 56% to Lupin's<br />
domestic formulation revenue.<br />
E: Equity with doctors 6/10<br />
Lupin has moderate brand equity in the<br />
pharmaceutical industry but good brand equity in<br />
select segments like the anti-TB segment, in which<br />
it ranks No1 in the industry.<br />
Lupin has been gradually improving its brand equity<br />
in the CVS and anti-diabetes segments and has<br />
improved its prescription ranking in the segments<br />
considerably over the past four years.<br />
D: Distribution & reach 6/10 I: Introductions 6/10<br />
Lupin derives 70% of its revenue from metros and<br />
tier-I cities.<br />
Distribution reach in metros and tier-I towns<br />
increased significantly and the contribution of other<br />
geographies to revenue has reduced over the past<br />
four years.<br />
Lupin has been aggressive in launching new<br />
products over the past four years, compared with<br />
its peers. It launched 67new products and line<br />
extensions a year over the past four years.<br />
<strong>New</strong> launches contributed significantly to Lupin's<br />
revenue growth over the past few years.<br />
Lupin has a field force of 3,682 MRs.<br />
Stock info<br />
Equity Shares (m) 446.2<br />
52-Week Range (INR) 520/348<br />
1,6,12 Rel. Perf. (%) 12/20/29<br />
M.Cap. (INR b) 200.8<br />
M.Cap. (USD b) 4.4<br />
Financial & valuation summary<br />
Year Net Sales PAT EPS EPS P/E P/BV RoE RoCE EV/ EV/<br />
End (INR m) (INR m) (INR) Gr. (%) (x) (x) (%) (%) Sales EBITDA<br />
03/10A 47,405 6,816 15.3 34.8 29.4 7.8 34.1 27.5 4.4 24.6<br />
03/11A 57,068 8,582 19.3 25.9 23.3 6.1 29.3 25.1 3.6 19.5<br />
03/12E 64,784 9,913 22.3 15.5 20.2 5.0 27.1 28.2 3.2 16.8<br />
03/13E 74,127 11,418 25.7 15.2 17.5 4.1 25.7 27.1 2.7 13.8<br />
Background<br />
Lupin is a second tier company actively targeting the regulated generics markets. Historically very strong in<br />
the anti-TB segment, it has over the years built up expertise in fermentation-based products and segments<br />
like cephalosporins, prils and statins. It is also in the process of building a niche portfolio of oral contraceptives<br />
and branded products in the US market.<br />
August 2011 50
Lupin<br />
Chairman Profile<br />
Chairman<br />
Lupin is promoted by Dr. D. B. Gupta (Chairman), a first generation entrepreneur supported by a team of<br />
senior professionals including Dr. Kamal Sharma (MD). Rapid scale-up in the US market (despite being<br />
a relatively late entrant), significant improvement in the product and geographical mix over the past 5 years<br />
coupled with strong backward integration skills are the key achievements.<br />
C: CAGR and scale-up 8/10<br />
Lupin significantly outperformed the industry with<br />
revenue CAGR of 21% over FY05-11. It has scaled<br />
up the business rapidly though on a very low base.<br />
However, the main growth driver was the tripling of<br />
its field force and aggressive new launches, rather<br />
than an increase in productivity.<br />
I: Improvement in productivity 5/10<br />
Lupin was not able to improve MR productivity over<br />
2004-10.<br />
Revenue per MR was stagnant at INR3.6m over<br />
2004-10. At this level the productivity is in line with<br />
the industry average.<br />
We expect Lupin to post 18% revenue CAGR over<br />
FY11-13 outperforming the industry, led by a rapidly<br />
expanding presence in the fast growing chronic<br />
therapeutic areas like CVS and anti-diabetes<br />
segments, an increase in the field force and<br />
aggressive new launches.<br />
N: Non-domestic business 6/10<br />
We are positive about Lupin's international<br />
business, given its strong and differentiated portfolio<br />
in the US and its gradually expanding presence in<br />
Japan.<br />
We expect Lupin's international business to post<br />
13% CAGR over FY11-13, excluding upsides from<br />
Para-IV sales.<br />
E: Earnings growth 6/10<br />
We expect overall top-line CAGR of 14% over FY11-<br />
13 leading to EPS CAGR of 15.3%.<br />
Regulated markets and India formulations will be<br />
key growth drivers.<br />
Option values include upsides from Para-IV<br />
products in the US.<br />
S: Stock Attractiveness 14/20<br />
Cautious approach to international expansion<br />
coupled with a highly profitable US business has<br />
ensured good return ratios in the past. We expect<br />
this to sustain in future.<br />
Lupin is valued at 20.2x FY12E and 17.5x FY13E<br />
consolidated earnings.<br />
Reiterate Buy with a target price of INR514 (20x<br />
FY13E EPS) excluding potential one-off upsides.<br />
Stock performance (1 year)<br />
520<br />
465<br />
Lupin Sensex - Rebased<br />
410<br />
355<br />
300<br />
Aug-10 Nov-10 Feb-11 May-11 Aug-11<br />
August 2011 51
Lupin<br />
India formulations<br />
snapshot<br />
Domestic formulations:<br />
Meaningful contributor to<br />
revenue, profitability<br />
The domestic formulations<br />
business is a meaningful<br />
contributor to Lupin's revenue<br />
and EBITDA with contribution<br />
of ~25%. Unlike some leading<br />
companies in the domestic<br />
formulations space, we<br />
believe Lupin's profitability in<br />
this business is lower than its<br />
peers due to a significant<br />
presence in anti-TB segments<br />
and rapid expansion of sales<br />
force. The business posted<br />
revenue CAGR of 21.5% over<br />
the past six years.<br />
EBITDA Contribution<br />
DF EBITDA<br />
25%<br />
Transformed transnational<br />
Transiting from acute to chronic, generic to branded<br />
Lupin is among the leading Indian companies in the domestic formulations segment. The<br />
company holds a leading position in the anti-TB segment and is among the leaders in the CVS<br />
and anti-diabetes segments. Lupin's revenue growth over the past few years has been<br />
driven by an augmented sales force and new launches. Lupin derives a large part of its<br />
revenue from metros and class-I towns. It is expected to sustain its out-performance to the<br />
industry in future.<br />
1. Mix: 5/10<br />
Respiratory, AI, CVS, anti-TB dominate sales<br />
The top four therapeutic segments, CVS, AI, respiratory and anti-TB contribute ~56% to<br />
Lupin's domestic formulations revenue. Lupin derives ~43% of its domestic formulations<br />
revenue from chronic therapeutic segments. It used to derive about half its domestic<br />
formulations revenue from the Anti-TB segment 10 years ago. However, Lupin's<br />
dependence on the segment has fallen considerably and it now contributes ~10% to<br />
revenues. Meanwhile, It has increased its presence in the CVS and respiratory segments<br />
over the past 10 years.<br />
CVS, AI, Respiratory and Anti-TB dominates the therapy mix<br />
Non-DF<br />
EBITDA, 75%<br />
Among the top 10 players<br />
in the industry<br />
Lupin ranks among the top 10<br />
players in the domestic<br />
formulations industry in terms<br />
of revenues. It commands<br />
2.69% market share, which<br />
has grown from 2.32% in<br />
2006. Lupin has outperformed<br />
the industry over the past six<br />
years with revenue CAGR of<br />
21.5% against the industry<br />
CAGR of 14%.<br />
Pain<br />
4%<br />
VMN<br />
11%<br />
CNS<br />
1%<br />
GI<br />
1%<br />
Others<br />
9%<br />
Pain<br />
2%<br />
FY01<br />
Anti-TB<br />
48%<br />
CVS<br />
5%<br />
Others<br />
22%<br />
AI<br />
21%<br />
Respira<br />
tory<br />
0%<br />
FY11<br />
Pain<br />
3%<br />
Others<br />
20%<br />
Diabetes<br />
5%<br />
GI<br />
3%<br />
FY05<br />
Anti-TB<br />
33%<br />
CVS<br />
21%<br />
CVS<br />
11%<br />
AI<br />
23%<br />
Respira<br />
tory<br />
2%<br />
Lupin<br />
25.0<br />
2.32<br />
Mkt Share (%)<br />
Grow th (%)<br />
24.2<br />
22.7<br />
18.7<br />
12.3<br />
2.5<br />
2.8<br />
2.75<br />
2.69<br />
Gynaecology<br />
3%<br />
CNS<br />
4%<br />
Diabetes<br />
7%<br />
GI<br />
6%<br />
Anti-TB<br />
10%<br />
Respiratory<br />
9%<br />
AI<br />
16%<br />
2006 2007 2008 2009 2010<br />
Source: Company/Industry/MOSL<br />
August 2011 52
Lupin<br />
2. Equity with doctors: 6/10<br />
Brand equity among physicians strong in some therapeutic segments<br />
Lupin's brand equity is strong in some therapeutic segments like anti-TB, in which it ranks<br />
No1, but overall it has average brand equity. In CVS, respiratory and the anti-diabetes<br />
segment, Lupin ranks No. 7, No. 6 and No. 7 with market share of 5.6%, 4.8% and 3.8%<br />
respectively. It has been improving its market share in these segments over the past few<br />
years, outperforming the segments' growth.<br />
Market share in key therapies (%) Growth comparison (%) (2010)<br />
5.6<br />
4.8<br />
Avg Gr - Company<br />
Avg Gr - Industry<br />
39.5<br />
3.8<br />
27.7<br />
23.3<br />
17.9 17.9<br />
16.2<br />
CVS Respiratory Anti-Diabetic<br />
CVS Respiratory Anti-Diabetic<br />
* Average growth over 2009-2010 Source: Industry/MOSL<br />
In terms of the number of prescriptions written, Lupin has consistently led the anti-TB<br />
segment with a prescription market share of 51%. It has been gradually improving its<br />
brand equity in the CVS and anti-diabetes segments and improved its prescription ranking<br />
in these segments over the past four years. It ranks fifth in the CVS segment with a<br />
prescription market share of 5% and ranks sixth in the anti-diabetes segment with a market<br />
share of 4.9%.<br />
Lupin's prescription ranking<br />
Jan-07 Jan-08 Jan-09 Jan-10 Oct-10<br />
Anti-TB 1 1 1 1 1<br />
CVS 9 7 7 6 5<br />
Anti-diabetic 8 8 8 8 6<br />
CNS 13 13 17 13 13<br />
Anti-infectives 13 12 13 14 15<br />
Respiratory 17 16 16 17 15<br />
Source: Industry/MOSL<br />
Top 10 brands contribute 20% of the revenues<br />
Lupin's top 10 brands contribute ~20% to its revenue, indicating low brand concentration.<br />
None of these feature in the top 100 brands of the industry. Its No1 brand, Tonact,<br />
(Atorvastatin, CVS) ranks No101 in the industry and it reported 19% growth over the past<br />
four years. The absence of big brands indicates Lupin's limited brand building ability in<br />
segments other anti-TB therapy.<br />
August 2011 53
Lupin<br />
Lupin's top 10 brands<br />
Brand Drug Product Launch Sales (INR m) YoY Gr (%) CAGR (%)<br />
Tonact Atorvastatin 2000 476 18.4 19.1<br />
Ramistar Ramipril 2001 273 13.5 11.0<br />
Gluconorm-g Glimepiride+Metform. 2003 262 43.8 38.6<br />
R-cinex Anti-TB 1986 257 -8.3 -6.6<br />
Budamate Formoteral+Budesonide 2004 252 20.3 30.3<br />
L-cin Levofloxacin 2002 245 2.1 9.2<br />
Odoxil Cefadroxil oral 1989 214 -10.9 2.2<br />
Esiflo Salmeterol+Fluticasone 2004 207 13.4 14.1<br />
Rablet Rabeprazole 2002 197 18.6 20.4<br />
Percin Other quino 2007 194 23.1 -<br />
CAGR through 2006-10<br />
Source: Industry/MOSL<br />
3. Distribution and reach: 6/10<br />
Lupin derives 70% of its revenue from metros and class-I towns compared with 63% of<br />
the industry average. Over the past four years, revenue CAGR for various geographies<br />
has been much higher than that of industry average except for in rural areas. The outperformance<br />
is significant in metros and class-I towns. The contribution of the metro<br />
region to the sales grew from 28% to 34% over the past five years.<br />
Lupin: Geographical distribution of revenues (%) Geographical distribution of revenues: Industry (%)<br />
Metros Class I Tow ns Class II to VI Rural<br />
17.3 17.0 15.4 13.3 11.9<br />
19.3 18.9 19.2 18.2 17.6<br />
35.5 34.7 35.9 36.7 36.3<br />
Metros Class I Tow ns Class II to VI Rural<br />
20.6 20.9 20.0 18.1 17.3<br />
19.2 19.0 19.5 19.4 19.6<br />
32.6 31.3 31.6 32.5 32.0<br />
27.8 29.5 29.5 31.9 34.2<br />
27.6 28.9 28.9 30.0 31.0<br />
CY06 CY07 CY08 CY09 CY10<br />
CY06 CY07 CY08 CY09 CY10<br />
Lupin: Geography-wise growth rates (%) Industry: Geography-wise growth rates (%)<br />
Metros Class I Tow ns Class II to VI Rural<br />
Metros Class I Tow ns Class II to VI Rural<br />
31.4<br />
22.2<br />
21.2<br />
21.0<br />
27.2<br />
25.2<br />
22.7<br />
10.6<br />
21.7<br />
14.7<br />
6.0<br />
-3.0<br />
27.2<br />
17.6<br />
15.1<br />
6.2<br />
17.6<br />
14.0<br />
11.1<br />
7.9<br />
17.5<br />
15.6<br />
14.7<br />
9.5<br />
17.7<br />
16.4<br />
13.0<br />
2.5<br />
26.2<br />
23.5<br />
20.7<br />
17.5<br />
CY07 CY08 CY09 CY10<br />
CY07 CY08 CY09 CY10<br />
Source: Industry/MOSL<br />
August 2011 54
Lupin<br />
4. Introductions: 6/10<br />
Lupin has been among the most aggressive players in launching new<br />
products<br />
Lupin has aggressively launched new products over the past four years, compared with its<br />
peers. It launched 67 new products annually (including line extensions) over the past four<br />
years. However average revenue per new launches has been stable over the period. <strong>New</strong><br />
launches contributed significantly to Lupin's revenue growth over the past few years though<br />
average revenue per new launch declined from INR104m in CY07 to INR65m in CY10.<br />
Lupin: <strong>New</strong> launches Lupin: Growth composition (%)<br />
104.4<br />
No. Of launches in last 2 yrs<br />
Avg sales per launch (INR m)<br />
97.3<br />
73.2<br />
64.5<br />
7.0<br />
<strong>New</strong> Launches<br />
11.0<br />
Existing Brands<br />
7.8<br />
100 91 177 175<br />
CY07 CY08 CY09 CY10<br />
17.2<br />
14.0<br />
11.7<br />
10.8<br />
-1.6<br />
CY07 CY08 CY09 CY10<br />
Source: Industry/MOSL<br />
5. CAGR and scale up: 8/10<br />
We expect Lupin's domestic formulations to post revenue of 18% CAGR over FY11-13<br />
led by a rapidly expanding presence in fast growing chronic therapeutic areas like CVS<br />
and anti-diabetes, increase in its field force and new launches. We believe Lupin will<br />
continue its out-performance of the industry as historically it has grown much faster than<br />
the industry, clocking revenue of 21.5% CAGR over FY05-11.<br />
Lupin: Domestic formulations revenue rampup<br />
26.1<br />
India Formulation Sales (INR M) Grow th (%)<br />
20.2<br />
16.4<br />
19.4<br />
18.0<br />
18.0<br />
9,496<br />
11,412<br />
13,281<br />
15,863<br />
18,718<br />
22,087<br />
FY08 FY09 FY10 FY11 FY12E FY13E<br />
Source: Company/MOSL<br />
August 2011 55
Lupin<br />
6. Improvement in MR productivity: 5/10<br />
Lupin's top-line growth is driven by additions to its sales force, but has not<br />
been able to improve productivity<br />
Lupin's domestic formulations business revenue posted 20.4% CAGR over FY04-10 and<br />
its sales force grew by 20.2% CAGR, implying stagnant MR productivity. In 2004, Lupin<br />
derived revenue of INR3.6m per MR, which was the same in FY10. Compared with the<br />
average of companies covered in this report, Lupin's performance was below average.<br />
Lupin: Sales force productivity<br />
No. of MRs Revenue per MR (INR m)<br />
3.6 3.6<br />
Sales force addition CAGR (%)<br />
Productivity Improvement CAGR (%)<br />
1,219<br />
3,682<br />
2004 2010<br />
20.2<br />
0.1<br />
Lupin<br />
11.5<br />
1.9<br />
Industry<br />
Source: Company/Industry/MOSL<br />
7. Non-domestic business: 6/10<br />
Lupin's non-domestic business snapshot<br />
Positives<br />
• Lupin has demonstrated one of the fastest ramp-ups in the US, led by branded and<br />
generic products, and gradually increasing precription share.<br />
• Trying to build a differentiated portfolio in the US by targeting niche segments of oral<br />
contraceptives and ophthalmology, coupled with some branded products.<br />
• It is the only Indian player to have a branded presence in the US and has been an early<br />
entrant in Japan through Kyowa acquisition.<br />
• It is highly cost competitive due to backward integration for most of its products.<br />
Risks & concerns<br />
• Generic competition for Suprax (a key product) in US.<br />
• Delays in receiving US FDA approval for oral contraceptives.<br />
• No major progress on NCE research despite working on it for many years.<br />
Key news flows/triggers<br />
• Ramp-up in Antara sales in the US.<br />
• US FDA approvals for oral contraceptives.<br />
• Potential acquisitions in Japan and Latin America.<br />
August 2011 56
Lupin<br />
Impact assessment<br />
• We are positive about Lupin's international business, given its strong and differentiated<br />
portfolio in the US and its gradually expanding presence in Japan.<br />
• We expect international business to record 12% CAGR over FY11-13, excluding<br />
upsides from Para-IV sales. Our estimates factor in the potential competition for<br />
Suprax in US.<br />
• Option values include upsides from Para-IV products in the US.<br />
Sales mix (INR m)<br />
FY09 FY10 FY11 FY12E FY13E FY11-13E<br />
CAGR (%)<br />
India<br />
APIs 2,192 2,302 2,514 2,640 2,772 5.0<br />
Formulations 11,412 13,281 15,863 18,718 22,087 18.0<br />
Total 13,604 15,583 18,377 21,358 24,859 16.3<br />
% of sales 35.6 32.7 32.0 32.8 33.3<br />
Regulated<br />
APIs 650 543 597 579 562 -3.0<br />
Formulations 17,341 23,234 28,229 31,385 35,539 12.2<br />
Total 17,991 23,777 28,826 31,965 36,101 11.9<br />
% of sales 47.1 49.9 50.2 49.0 48.4<br />
Un-regulated<br />
APIs 4,296 4,565 5,477 5,751 6,039 5.0<br />
Formulations 1,930 3,204 4,393 5,711 7,139 27.5<br />
Total 6,226 7,769 9,870 11,462 13,177 15.5<br />
% of sales 16.3 16.3 17.2 17.6 17.7<br />
Others 417 550 348 390 437<br />
Grand Total 38,238 47,678 57,422 65,175 74,574 14.0<br />
Source: Company/MOSL<br />
EBITDA Contribution<br />
Non-DF<br />
EBITDA<br />
75%<br />
DF<br />
EBITDA<br />
25%<br />
8-9. Earnings growth and stock attractiveness: 20/30<br />
Lupin is likely to gradually improve its fundamentals, led by an expanding US generics<br />
pipeline, niche/Para-IV opportunities in the US, strong performance in emerging markets<br />
(including India) and sustained traction in the Japanese business.<br />
While our estimates factor in generic competition for Suprax from FY13 onwards, any<br />
out-of-court settlement for Suprax patent litigation is likely to raise our earnings forecast<br />
for FY13.<br />
Lupin continues to target niche, low-competition opportunities to drive growth and improve<br />
profitability. Its initiatives in the US oral contraception space are efforts in this direction.<br />
The stock trades at, 19.7x FY12E and 17.1x FY13E EPS with a sustained ~25-30% RoE.<br />
Our estimates do not include one-time upsides for Lupin's FTF pipeline in the US. Maintain<br />
Buy with a target price of INR514 (20x FY13E EPS).<br />
August 2011 57
Lupin<br />
Lupin RoE & RoCE<br />
Lupin one year forward P/E<br />
37.1<br />
25.6<br />
RoE (%) RoCE (%)<br />
34.1<br />
29.3<br />
27.1<br />
27.5<br />
25.1<br />
28.2<br />
25.7<br />
27.1<br />
29<br />
23<br />
17<br />
P/E (x) Avg(x) Peak(x) Min(x)<br />
23.9<br />
14.6<br />
19.5<br />
11<br />
5<br />
7.8<br />
2009 2010 2011 2012E 2013E<br />
Aug-06<br />
Mar-07<br />
Aug-07<br />
Feb-08<br />
Aug-08<br />
Feb-09<br />
Aug-09<br />
Feb-10<br />
Aug-10<br />
Feb-11<br />
Aug-11<br />
Lupin non-domestic business: key trends, triggers & risk<br />
US generics: One of the fastest entries by an Indian player<br />
Lupin has the distinction of achieving the fastest ramp-up in the US by any Indian company.<br />
This was achieved through brand acquisition/in-licensing, focusing on niche, low-competition<br />
products, supported by an aggressive pace of filings in the US market. Lupin, which<br />
entered the US market in FY05, posted FY11 US revenues of INR20b, a growth of 9x<br />
over FY06-11.<br />
Targeting niche opportunities resulted in better profitability<br />
Lupin has differentiated itself from other Indian generic companies in the US by:<br />
1. Focusing on branded innovator products - it is the only Indian company to do so.<br />
2. Launching at least one low-competition/patent challenge product in the US every year<br />
over the past few years.<br />
A few years ago, Lupin in-licensed Suprax brand from Fujisawa (the latter had stopped<br />
promoting this brand in the US) and ramped-up sales of the product through price increases,<br />
volume growth and the launch of line extensions of the brand. While Lupin does not<br />
disclose Suprax revenues separately, we estimate they contributed USD80m-90m to its<br />
FY11 US revenues.<br />
Expanding brand portfolio in the US through acquisitions/in-licensing<br />
After its success with Suprax, Lupin has attempted to expand its brand portfolio in the US<br />
by acquiring the Antara brand in FY10 and in-licensing a couple of brands from other<br />
players. While it is yet to replicate the Suprax success for Antara, we believe the brand<br />
holds promise. The other two brands are likely to contribute to revenue in the long-term.<br />
Lupin's niche initiatives in the US have helped it to achieve two main objectives.<br />
1. It rapidly ramped up US revenues with 9x growth CAGR over FY06-11 to INR20b.<br />
2. It significantly improved the profitability of its US operations since branded innovator<br />
products and low-competition/patent challenge generic products enjoy higher profitability<br />
compared with normal generic products.<br />
Niche/patent challenge upsides in the US to continue<br />
The trend of launching niche products in the US will continue. After the contribution from<br />
generic Lotrel during FY11, Lupin has scheduled similar launches in FY12. The<br />
commercialization of its oral contraceptive (a US$4.5b market in the US) products will<br />
add to its protfolio from FY13.<br />
August 2011 58
Lupin<br />
The management has guided for 12 new launches in the US in FY12 of which 3-4 are<br />
expected to be oral contraceptives (with branded market size of USD300m-500m). The<br />
remaining products will target a branded US market worth about USD5b.<br />
Lupin has made 23 filings in the oral contraceptives segment as part of its strategy to<br />
exploit niche and low-competition segments. To strengthen this portfolio, it is focusing on<br />
filing products in the ophthalmology and dermatology segments.<br />
Given that Lupin will be a new player in the oral contraceptives market, we have<br />
conservatively factored in upsides from this opportunity from FY13 despite the management<br />
guidance of launching 3-4 products in FY12.<br />
These potential low-competition launches along with a steady ramp-up in its branded<br />
revenue in the US (sales force strength increased from 70 to 160 MRs) will enable Lupin<br />
to sustain double-digit growth.<br />
We factor in 9% revenue CAGR for Lupin's US operations (over FY11-13) after factoring<br />
in the slowdown in the US branded business and potential competition from generic Suprax.<br />
Our estimates exclude potential one-off opportunities.<br />
Japan can be a large opportunity in the long term<br />
Japan is the new emerging opportunity in the global generics market with the Japanese<br />
government trying to reduced overall healthcare costs in the US$70b Japanese<br />
pharmaceutical market. The government has, in the past two years, legislated to encourage<br />
the use of generics.<br />
However, given the Japanese market's concern for quality products and a brand-conscious<br />
mentality, progress has been gradual for generic products. We, however, believe the Japanese<br />
market holds huge long-term potential for generic players who can convince the Japanese<br />
population about the quality of their products. A successful presence in such a market will<br />
require tie-ups/associations with known local names since Indian companies are still<br />
unknown entities in Japan.<br />
One of the few companies to access Japan's generics market<br />
Given Lupin's entry in the Japanese generic market through the Kyowa acquisition, it is<br />
better positioned to exploit the Japanese generics opportunity compared with its peers.<br />
Lupin acquired Kyowa in October 2007 and ramped-up the business to INR6.2b by FY11.<br />
We estimate 17% revenue CAGR for the Japanese operations, led mainly by new launches.<br />
Gradually expanding profitability of Japanese operations<br />
Lupin expanded gross margins for Kyowa from 33% to 40% over the past two years and<br />
is shifting part of its manufacturing to its Indian facilities, which is likely augment margins.<br />
In FY12 Lupin will shift some of trhe API production to India and the formulation<br />
manufacturing will be gradually shifted to India from FY13. These initiatives are likely to<br />
gradually expand the profitability of Lupin's Japanese operations in the long-term.<br />
August 2011 59
Lupin<br />
Financials and valuations: Lupin<br />
Income Statement<br />
(INR Million)<br />
Y/E March 2010 2011 2012E 2013E<br />
Net Sales 47,405 57,068 64,784 74,127<br />
Change (%) 25.5 20.4 13.5 14.4<br />
Total Expenditure 38,869 46,410 52,590 59,521<br />
EBITDA 8,536 10,659 12,194 14,605<br />
Margin (%) 18.0 18.7 18.8 19.7<br />
Depreciation 1,239 1,755 1,955 2,248<br />
EBIT 7,297 8,903 10,239 12,357<br />
Int. and Finance Charges 385 325 304 232<br />
Other Income - Rec. 1,445 1,341 2,921 1,625<br />
PBT before EO item 8,357 9,920 12,857 13,750<br />
PBT after EO item 8,357 9,920 12,857 13,750<br />
Tax 1,360 1,169 1,928 2,063<br />
Tax Rate (%) 16.3 11.8 15.0 15.0<br />
Reported PAT 6,997 8,750 10,928 11,688<br />
PAT Adj for EO items 6,997 8,750 10,163 11,688<br />
Change (%) 37.8 25.1 16.1 15.0<br />
Margin (%) 14.8 15.3 15.7 15.8<br />
Less: Minority Interest 180 168 250 270<br />
Adj Net Profit 6,816 8,582 9,913 11,418<br />
Consolidated Balance Sheet<br />
(INR Million)<br />
Y/E March 2010 2011 2012E 2013E<br />
Equity Share Capital 889 892 892 892<br />
Fully Diluted Equity Capital 889 889 889 889<br />
Other Reserves 24,789 31,918 39,473 47,551<br />
Total Reserves 24,789 31,918 39,473 47,551<br />
Net Worth 25,678 32,811 40,366 48,444<br />
Minority Interest 255 515 515 515<br />
Deferred liabilities 1,435 1,411 1,411 1,411<br />
Total Loans 11,399 11,624 8,624 5,624<br />
Capital Employed 38,767 46,361 50,916 55,994<br />
Gross Block 22,937 26,389 30,889 35,389<br />
Less: Accum. Deprn. 7,072 9,075 11,030 13,278<br />
Net Fixed Assets 15,865 17,313 19,859 22,110<br />
Capital WIP 3,579 5,312 5,312 5,312<br />
Investments 264 32 32 32<br />
Goodwill & Intangibles 3,197 3,255 3,255 3,255<br />
Curr. Assets 27,755 34,967 39,049 44,034<br />
Inventory 9,715 12,000 13,605 15,567<br />
Account Receivables 11,266 12,558 14,252 16,308<br />
Cash and Bank Balance 2,015 4,201 4,714 4,747<br />
Others 4,759 6,208 6,478 7,413<br />
Curr. Liability & Prov. 11,893 14,518 16,591 18,748<br />
Account Payables 9,649 11,800 12,957 14,825<br />
Provisions 2,243 2,718 3,634 3,923<br />
Net Current Assets 15,862 20,449 22,459 25,285<br />
Appl. of Funds 38,767 46,361 50,916 55,994<br />
E: MOSL Estimates<br />
Ratios<br />
Y/E March 2010 2011 2012E 2013E<br />
Basic (INR)<br />
EPS (Fully Diluted) 15.3 19.3 22.3 25.7<br />
Cash EPS (Fully Diluted) 18.1 23.2 26.7 30.7<br />
BV/Share 57.7 73.5 90.5 108.6<br />
DPS 2.8 3.2 6.0 6.4<br />
Payout (%) 21.2 18.9 28.6 28.6<br />
Valuation (x)<br />
P/E (Fully Diluted) 23.3 20.2 17.5<br />
Cash P/E (Fully Diluted) 19.4 16.9 14.6<br />
P/BV 6.1 5.0 4.1<br />
EV/Sales 3.6 3.2 2.7<br />
EV/EBITDA 19.5 16.8 13.8<br />
Dividend Yield (%) 0.7 1.3 1.4<br />
Return Ratios (%)<br />
RoE 34.1 29.3 27.1 25.7<br />
RoCE 27.5 25.1 28.2 27.1<br />
Working Capital Ratios<br />
Fixed Asset Turnover (x) 2.3 2.3 2.3 2.2<br />
Debtor (Days) 90 87 87 85<br />
Inventory (Days) 75 77 77 77<br />
Wkg. Capital Turnover (Days) 122 131 127 125<br />
Leverage Ratio<br />
Debt/Equity (x) 0.4 0.4 0.2 0.1<br />
Cash Flow Statement<br />
(INR Million)<br />
Y/E March 2010 2011 2012E 2013E<br />
Oper. Profit/(Loss) before Tax 8,536 10,659 12,194 14,605<br />
Interest/Dividends Recd. 1,445 1,341 2,921 1,625<br />
Direct Taxes Paid -1,090 -1,193 -1,928 -2,063<br />
(Inc)/Dec in WC -4,478 -2,401 -1,497 -2,794<br />
CF from Op. incl EO Exp. 4,414 8,405 11,690 11,374<br />
(inc)/dec in FA -6,454 -4,996 -4,500 -4,500<br />
(Pur)/Sale of Investments -49 233 0 0<br />
CF from Investments -6,503 -4,763 -4,500 -4,500<br />
Change in Net Worth 6,029 300 -250 -270<br />
Inc/(Dec) in Debt -834 226 -3,000 -3,000<br />
Interest Paid -385 -325 -304 -232<br />
Dividend Paid -1,483 -1,658 -3,123 -3,340<br />
CF from Fin. Activity 3,327 -1,457 -6,677 -6,841<br />
Inc/Dec of Cash 1,238 2,186 513 33<br />
Add: Beginning Balance 778 2,015 4,201 4,714<br />
Closing Balance 2,015 4,201 4,714 4,747<br />
August 2011 60
Domestic Formulations | <strong>New</strong> Peaks<br />
This page is<br />
left blank<br />
intentionally<br />
August 2011 61
Domestic Formulations | <strong>New</strong> Peaks<br />
MEDICINES<br />
MEDICINES CAPSULE Score<br />
61/100<br />
All's in place<br />
Torrent Pharma<br />
CMP: INR589<br />
TRP IN<br />
TP: INR762 Buy<br />
M: Mix 6/10<br />
Torrent is one of the better plays on remedies for<br />
high-growth lifestyle segments of CNS, CVS and<br />
diabetes. It derives 59% of its revenue from chronic<br />
lifestyle segments.<br />
CVS is the highest contributor with 35% contribution<br />
followed by CNS (21%) and Gastro Intestinal (17%).<br />
E: Equity with doctors 7/10<br />
Torrent enjoys good brand equity with specialist in<br />
the CNS and CVS segments.<br />
In the CNS segment, Torrent Pharma ranks 3rd<br />
with a prescription market share of 8.1% and in<br />
the CVS segment its ranks seventh with a<br />
prescription market share of 4.6%.<br />
Torrent Pharma has either maintained or improved<br />
its prescription ranking in the most of the<br />
therapeutic segments in which it operates.<br />
D: Distribution & reach 6/10 I: Introductions 5/10<br />
Torrent Pharma derives 73% of its revenue from<br />
metros and tier-I cities.<br />
The contribution of rural areas to revenue has fallen<br />
over the past five years from 18.2% to 12.8%.<br />
Over the past four years, revenue CAGR for all<br />
geographies has been below the industry average<br />
except in Metro's.<br />
Torrent Pharma's new product launch rate has been<br />
good compared with its peers in the industry. It<br />
launched 38 new products a year (including line<br />
extensions) over the past four years.<br />
It's revenue growth is driven by its existing products<br />
as well as new launches.<br />
Torrent Pharma has a field force of 3,600<br />
Stock info<br />
Equity Shares (m) 84.6<br />
52-Week Range (INR) 687/497<br />
1,6,12 Rel. Perf. (%) 3/19/18<br />
M.Cap. (INR b) 54.6<br />
M.Cap. (USD b) 1.2<br />
Financial & valuation summary<br />
Year Net Sales PAT EPS EPS P/E P/BV RoE RoCE EV/ EV/<br />
End (INR m) (INR m) (INR) Gr. (%) (x) (x) (%) (%) Sales EBITDA<br />
03/10A 19,040 2,680 31.7 9.9 18.6 6.0 36.2 28.7 2.7 12.5<br />
03/11A 22,265 2,702 31.9 0.8 18.4 4.9 29.2 24.1 2.3 12.4<br />
03/12E 25,596 3,392 40.1 25.6 14.7 3.8 29.3 24.9 1.9 9.6<br />
03/13E 29,817 4,029 47.6 18.8 12.4 3.1 27.7 25.1 1.6 8.0<br />
Background<br />
Though ranked 17th in terms of total revenue in the domestic formulations segment, Torrent derives its<br />
strength from being the leader in some of the most lucrative and fastest growing chronic therapy segments.<br />
It has consistently maintained its leadership in these therapeutic classes, with strong brands and new<br />
product launches.<br />
August 2011 62
Torrent Pharma<br />
Chairman Profile<br />
Chairman<br />
Torrent Pharma was set-up by Late U N Mehta. Mr Mehta started his career as a clerk with the government.<br />
Later, he took a job as a medical representative for Sandoz. Post which he started his own business in<br />
pharmaceutical and eventually established the company. Currently, his son Mr. Sudhir Mehta and<br />
Mr. Sameer Mehta handle the operations of the company.<br />
C: CAGR and scale-up 6/10 I: Improvement in productivity 3/10<br />
Torrent Pharma has significantly outperformed the<br />
industry with revenue CAGR of 19% over FY05-11.<br />
The company has scaled up the business rapidly<br />
albeit on a low base and growth has been achieved<br />
largely because of a favorable therapeutic mix,<br />
improvement in brand equity and increase in field<br />
force productivity.<br />
We expect Torrent Pharma to post 16% CAGR<br />
over FY11-13, outperforming the industry, led by a<br />
strong presence in fast growing chronic therapeutic<br />
areas like CVS, CNS and anti-diabetes and<br />
improvement in brand equity.<br />
Torrent Pharma ranks very low compared to its<br />
larger peers when it comes to field force<br />
productivity.<br />
However the company has managed to improve<br />
the productivity over the last 6 years. Revenue per<br />
MR improved from Rs1.5m in 2004 to Rs2.2m in<br />
2010<br />
N: Non-domestic business 6/10 E: Earnings growth 8/10<br />
We are positive about Torrent Pharma's nondomestic<br />
business given it's has strong presence<br />
in Latin America and expanding its reach in various<br />
regulated and emerging markets.<br />
We expect the international business to post<br />
15.7% CAGR over FY11-13 mainly led by the US<br />
and Latin American markets.<br />
We expect overall top-line CAGR of 16% over FY11-<br />
13 leading to EPS CAGR of 22.1%.<br />
Earnings growth will be driven by the domestic<br />
formulation business and increase in profitability<br />
of international operations.<br />
The company has tie-up with 3 global innovators<br />
for supplying various products. We expect these<br />
supplies to grow at 16.5% CAGR over FY11-13.<br />
Option values include upsides from NCE business.<br />
S: Stock Attractiveness 14/20<br />
A focused and cautious approach to international<br />
expansion along with a highly profitable domestic<br />
business has ensured good return ratios, RoIC is<br />
estimated at 40% over the next two years.<br />
Stock performance (1 year)<br />
Torrent Pharma<br />
700<br />
650<br />
Sensex - Rebased<br />
Torrent Pharma is valued at 14.7x FY12E and 12.4x<br />
FY13E consolidated earnings.<br />
Reiterate Buy with a target price of INR762 (16x<br />
FY13E EPS).<br />
600<br />
550<br />
500<br />
Aug-10 Nov-10 Feb-11 May-11 Aug-11<br />
August 2011 63
Torrent Pharma<br />
India formulations<br />
snapshot<br />
Domestic formulations -<br />
major contributor to<br />
revenue, profits<br />
The domestic formulations<br />
business contributes ~40% to<br />
Torrent Pharma's revenue. The<br />
segment is the most profitable<br />
for Torrent and contributes<br />
~70% to consolidated EBITDA.<br />
Revenue/PBT Contribution<br />
Torrent Pharma<br />
Non-DF EBITDA DF EBITDA<br />
30%<br />
70%<br />
The leading player in the<br />
chronic therapeutic<br />
segment<br />
Torrent Pharma has grown its<br />
market share over the years due<br />
to a significant presence in fast<br />
growing chronic therapeutic<br />
areas. It is among the largest<br />
companies in the chronic<br />
segments. The company's<br />
market share has gone up from<br />
1.9% in 2006 to 2% in 2010. The<br />
company posted 19% CAGR<br />
over the past five years against<br />
14% CAGR for the industry.<br />
Market share has increased<br />
marginally<br />
2.1<br />
2.1<br />
2.0<br />
2.0<br />
1.9<br />
1.9<br />
Mkt Share (%)<br />
Grow th (%)<br />
2006<br />
2007<br />
2008<br />
2009<br />
2010<br />
25<br />
20<br />
15<br />
10<br />
5<br />
0<br />
All's in place<br />
Strong profitable growth, robust balance sheet, attractive valuation<br />
Torrent derives its strength from its strong positioning in some of the most lucrative and<br />
fastest growing chronic therapy segments. It has consistently maintained its leadership in<br />
these therapeutic classes, with strong brands and new product launches. Torrent has 6<br />
brands in the industry's top 300 brands, and has 37 brands in leadership positions in their<br />
respective molecule segments. The company has a field force of 3,600 medical<br />
representatives (MRs). Domestic business has grown at a CAGR of 19% over the last 6 years<br />
through FY11. Torrent derived 40% of its revenue from the domestic formulations business<br />
in FY11, down from 85% in FY04 due to relatively higher growth in its international business.<br />
1. Mix: 6/10<br />
Lifestyle segments like CVS, CNS, anti-diabetes dominate sales<br />
Torrent Pharma derives 59% of its revenue from chronic therapeutic segments, which<br />
dominate the company's revenue mix. The top five therapeutic segments including CNS,<br />
CVS, GI, AI and anti-diabetes contribute ~91% to Torrent's domestic formulations revenue.<br />
Torrent is among the market leader in two of the fastest growing therapeutic segments,<br />
CNS and CVS. Torrent's sizable presence in the chronic therapy segments makes it an<br />
attractive play in the domestic formulations business.<br />
Therapeutic break-up (FY05)<br />
Pain<br />
6%<br />
Antiinfectives<br />
14%<br />
Antidiabetic<br />
3%<br />
others<br />
2%<br />
CNS<br />
17% GI<br />
22%<br />
Cardiac<br />
36%<br />
Therapeutic break-up (FY11)<br />
Cardiac<br />
CNS<br />
Pain<br />
others<br />
Source: Company/Industry/MOSL<br />
2. Equity with doctors: 7/10<br />
Strong brand equity among specialists, among leaders in the CVS and CNS<br />
Torrent has been a dominant player in two of the industry's fastest growing therapeutic<br />
segments i.e CNS and CVS. Torrent ranks No2 in the CVS and No.3 in CNS segments<br />
with a value market share of 6.8% and 8.6% respectively.<br />
19%<br />
4%<br />
13%<br />
5%<br />
Anti-diabetic<br />
Anti-infectives<br />
GI<br />
21%<br />
33%<br />
5%<br />
August 2011 64
Torrent Pharma<br />
Market share in key therapies (%) Growth comparison (%) (2010)<br />
6.8<br />
8.6<br />
16.8<br />
Avg Gr - Company<br />
17.9<br />
15.1<br />
Avg Gr - Industry<br />
17.1<br />
18.0<br />
18.7<br />
3.6<br />
CVS GI CNS<br />
CVS GI CNS<br />
* Average growth over 2009-2010 Source: Industry/MOSL<br />
In terms of prescriptions Torrent Pharma has been one of the leading players in two of the<br />
industry's fastest growing therapeutic segments viz. CNS and CVS. Torrent Pharma ranks<br />
No3 in the CNS and No. 7 in CVS segments with a prescription market share of 8.1% and<br />
4.6% respectively. It ranks sixth in the GI segment. Over the last 4 years, the company<br />
has either maintained or improved its ranking in almost all the therapeutic areas it operates<br />
in.<br />
Torrent's Prescription ranking has improved across therapy segments<br />
Jan-07 Jan-08 Jan-09 Jan-10 Oct-10<br />
CVS 8 8 6 5 7<br />
CNS 2 2 2 3 3<br />
Anti Diabetics 17 10 13 13 14<br />
Anti infectives 14 14 14 15 14<br />
GI 7 6 5 6 6<br />
Source: Industry/MOSL<br />
Top 10 brands contribute 30% of the revenues<br />
Torrent Pharma's top 10 brands contribute ~30% to total revenue, which shows low brand<br />
concentration compared with other leading companies. Four brands of the company feature<br />
among the top 300 brands of the industry. Torrent Pharma's No1 brand, Dilzem, (Diltiazem,<br />
CVS) ranks 102 nd in the industry and it posted revenue CAGR of 13% over the past four<br />
years. Seven of its top 10 brands have grown at double digit CAGR over past 4 years.<br />
Top 10 brands of the company<br />
Brand Drug Product Product Sales YoY Gr. CAGR<br />
Category Launch (INRm) (%) (%)<br />
Dilzem Diltiazem CVS 1987 475 5.7 13.0<br />
Nikoran Nicorandil CVS 1997 410 17.6 19.2<br />
Alprax Alprazolam CNS 1988 396 0.0 5.4<br />
Nebicard Nebivolol CVS 2003 252 14.5 19.8<br />
Topcef Cefixime Anti-infective 1994 235 18.7 16.0<br />
Domstal Domperidone Gastro-intestinal 1988 229 5.5 5.4<br />
Droxyl Cefadroxil Anti-infective 1989 213 3.3 3.5<br />
Azulix-mf Glimepiride+Metformin Diabetes 2002 197 27.5 33.2<br />
Deplatt-a Aspirin + Clopidogrel CVS 2002 191 11.8 24.3<br />
Lamitor Lamotrigine CNS 1998 170 17.0 18.5<br />
CAGR through 2006-10<br />
Source: Industry/MOSL<br />
August 2011 65
Torrent Pharma<br />
3. Distribution and reach: 6/10<br />
Torrent Pharma derives 73% of its revenue from metros and class-I towns, compared<br />
with 63% of the industry average, suggesting a focus on these geographies. In the past<br />
four years, revenue CAGR for all geographies has been lower than that of the industry<br />
average except for Metros. The contribution of rural areas to revenue has fallen over the<br />
past five years from 18.2% in 2006 to 12.8% in 2010.<br />
Geographical distribution of revenues - Torrent Pharma (%) Geographical distribution of revenues - Industry (%)<br />
Metros Class I Tow ns Class II to VI Rural<br />
18.2 17.6 16.9 13.8 12.8<br />
15.7 15.6 15.8<br />
14.2 14.2<br />
27.8 28.5<br />
30.6 28.7 29.9<br />
Metros Class I Tow ns Class II to VI Rural<br />
20.6 20.9 20.0 18.1 17.3<br />
19.2 19.0 19.5 19.4 19.6<br />
32.6 31.3 31.6 32.5 32.0<br />
35.5 38.1 37.4<br />
44.3 44.5<br />
27.6 28.9 28.9 30.0 31.0<br />
CY06 CY07 CY08 CY09 CY10<br />
CY06 CY07 CY08 CY09 CY10<br />
Geography-wise growth rates - Torrent Pharma (%) Geography-wise growth rates - Industry (%)<br />
Metros Class I Tow ns Class II to VI Rural<br />
41.1<br />
26.6<br />
19.0<br />
16.8<br />
12.7<br />
16.4<br />
14.1<br />
10.7<br />
16.0<br />
10.6<br />
9.7<br />
6.3<br />
6.7<br />
7.9<br />
3.8<br />
-3.0<br />
CY07 CY08 CY09 CY10<br />
Metros Class I Tow ns Class II to VI Rural<br />
26.2<br />
23.5<br />
17.6<br />
17.5 17.7<br />
20.7<br />
15.6<br />
14.0<br />
16.4<br />
17.5<br />
14.7<br />
11.1<br />
13.0<br />
7.9<br />
9.5<br />
2.5<br />
CY07 CY08 CY09 CY10<br />
Source: Industry/MOSL<br />
4. Introduction: 5/10<br />
Torrent Pharma's pace of new product launches has been moderate<br />
compared with its peers in the industry. There has been significant<br />
improvement in revenue per new product launched<br />
Torrent's new product launch rate has been moderate compared to its peers in the industry.<br />
It has launched 38 new products annually (including line extensions) over the last 4 years.<br />
The revenue growth is driven by both existing products as well as new launches. The<br />
average revenue per new launch has risen substantially in the past four years from Rs32.7m<br />
in 2006 to Rs118m in 2010, suggesting better penetration of launched brands.<br />
August 2011 66
Torrent Pharma<br />
Torrent Pharma's - new launches Torrent Pharma's growth compositions (%)<br />
126<br />
No. Of launches in last 2 yrs<br />
Avg sales per launch (INR m)<br />
137.2<br />
73<br />
118.3<br />
9.8<br />
<strong>New</strong> Launches<br />
Existing Brands<br />
10.1<br />
9.9<br />
32.7<br />
57.1<br />
43 39<br />
1.3<br />
8.1 6.9<br />
9.1<br />
5.9<br />
CY07 CY08 CY09 CY10<br />
CY07 CY08 CY09 CY10<br />
Source: Industry/MOSL<br />
5. CAGR and scale-up: 6/10<br />
We expect 16% CAGR from Torrent Pharma's domestic formulations business led by a<br />
strong presence in the fastest growing chronic therapeutic segments. We believe the<br />
company will continue to outperform the industry and its peers over the foreseeable future.<br />
Historically the company has outperformed industry in this segment with FY05-11 revenue<br />
CAGR of 19% versus that of 14% for the industry during the same period. We believe<br />
that, Torrent is likely to strengthen its presence in key therapeutic areas, improving its<br />
ranking in the industry.<br />
Torrent Pharma: Domestic formulations revenue ramp-up<br />
Revenues (INR m) Grow th (%)<br />
11,285<br />
2,848<br />
2,904<br />
35.0<br />
3,921<br />
38.8<br />
5,444<br />
5,813<br />
6.8<br />
6,240<br />
7.3<br />
7,254<br />
16.3<br />
8,389<br />
15.6<br />
9,563<br />
14.0<br />
18.0<br />
2.0<br />
FY04 FY05 FY06 FY07 FY08 FY09 FY10 FY11 FY12E FY13E<br />
Source: Company/MOSL<br />
6. Improved MR productivity: 3/10<br />
Torrent's topline growth is driven by both addition to the MR strength and<br />
improvement in the MR productivity. However MR productivity is low<br />
compared to large peers<br />
Torrent Pharma has done a good job over the past six years with a improvement in workforce<br />
productivity. Over FY04-10, Torrent Pharma's domestic formulations business revenue<br />
posted 19.3% CAGR and its sales force expanded by just 10.7% CAGR, implying<br />
significant productivity improvement of the workforce. In 2004, Torrent derived revenue<br />
of Rs1.5m per MR, which rose to Rs2.3m in 2010. However the MR productivity is still<br />
very low compared to large peers.<br />
August 2011 67
Torrent Pharma<br />
Torrent: Salesforce productivity<br />
No. of MRs Revenue per MR (INR m)<br />
2.3<br />
Sales force addition CAGR (%)<br />
Productivity Improvement CAGR (%)<br />
1.5<br />
3,600<br />
1,959<br />
2004 2010<br />
10.7<br />
7.8<br />
Torrent<br />
11.5<br />
1.9<br />
Industry<br />
Source: Company/Industry/MOSL<br />
7. Non-domestic business snapshot: 6/10<br />
Positives<br />
• Strong presence in emerging markets like Brazil and RoW markets. Increasing presence<br />
in other emerging markets<br />
• Increasing presence in US market with healthy product pipeline<br />
• Strong chemistry skills and backward integrated low-cost operations.<br />
• Improving profitability of international subsidiaries.<br />
Risks & concerns<br />
• Delay in getting regulatory approvals for the products<br />
• Worsening of pricing environment in key markets like Germany and US.<br />
• Rupee appreciation vs US$ may have negative impact on earnings.<br />
• Continued losses at Russian subsidiaries will impact overall profits.<br />
Key news flows/triggers<br />
• Ramp up in US revenue in FY12-13<br />
• Begining of supplies to AstraZeneca<br />
• Improvement in profitability of international business<br />
Impact assessment<br />
• Expect the international business to post 15% CAGR over FY11-13 led mainly by US<br />
and CRAMS supplies to AstraZeneca<br />
• We expect the international business to record 16% CAGR over FY11-13 excluding<br />
low-competition and Para-IV products in the US.<br />
• Option values include upsides from future inorganic initiatives.<br />
August 2011 68
Torrent Pharma<br />
Sales mix (INR m)<br />
FY09 FY10 FY11 FY12E FY13E FY11-13<br />
CAGR (%)<br />
Domestic formulation 6,240 7,254 8,389 9,563 11,285 16.0<br />
YoY Growth (%) 7.3 16.3 15.6 14.0 18.0<br />
International formulation7,970 9,157 10,702 12,421 14,331 15.7<br />
YoY Growth (%) 37.8 14.9 16.9 16.1 15.4<br />
Latin America 2,566 3,006 3,519 4,223 4,983 19.0<br />
Russia/CIS 658 391 583 525 577 -0.5<br />
Europe (ex-Germany) 1,011 1,163 1,245 1,469 1,704 17.0<br />
Germany (Heumann) 2,573 2,547 2,986 3,135 3,292 5.0<br />
RoW 885 1,141 1,276 1,429 1,643 13.5<br />
US 278 909 1,093 1,640 2,131 39.6<br />
CRAMS 1,601 1,849 2,096 2,431 2,845 16.5<br />
YoY Growth (%) 7.4 15.5 13.4 16.0 17.0<br />
Others 53 69 33 36 40 10.0<br />
YoY Growth (%) 64.8 29.7 -52.8 10.0 10.0<br />
Net Sales 15,864 18,329 21,220 24,451 28,500 15.9<br />
YoY Growth (%) 20.9 15.5 15.8 15.2 16.6<br />
Other operating income 441 710 1,045 1,145 1,317 12.2<br />
YoY Growth (%) 3.7 61.0 47.1 9.6 15.0<br />
Income from op. 16,306 19,040 22,265 25,596 29,817 15.7<br />
YoY Growth (%) 20.4 16.8 16.9 15.0 16.5<br />
Source: Company/MOSL<br />
EBITDA Contribution<br />
Torrent Pharma<br />
Non-DF<br />
EBITDA<br />
30%<br />
DF<br />
EBITDA<br />
70%<br />
8-9. Earnings growth and stock attractiveness: 22/30<br />
Over the past five years Torrent posted earnings CAGR of 34% and CAGR of capital<br />
employed in the business was 17%. Torrent consistently improved its profitability, with<br />
RoCE increasing from 14.5% in FY05 to 24.1% in FY11. Torrent is likely to post earnings<br />
of 22% CAGR over FY11-13, in line with strong operating performance. It is likely to<br />
sustain high return ratios despite large capex and growing cash on its books. We believe<br />
current valuations do not reflect the improvement in business profitability, turnaround of<br />
international operations and Torrent's strong positioning in the domestic formulations segment.<br />
Torrent should trade at a premium to most mid-cap pharmaceutical companies, and its<br />
valuation gap vis-à-vis frontline pharmaceutical companies should fall, going forward. The<br />
stock trades at 14.7x FY12E and 12.4x FY13E earnings. We believe Torrent's superior<br />
financial performance will drive re-rating. Maintain Buy with a target price of INR762<br />
(16x FY13E EPS), an upside of 26%.<br />
Torrent Pharma RoE & RoCE<br />
Torrent Pharma one year forward P/E<br />
42.0<br />
RoE (%) RoCE (%)<br />
24<br />
P/E (x) Avg(x) Peak(x) Min(x)<br />
36.2<br />
29.2<br />
29.3<br />
27.7<br />
18<br />
12<br />
21.4<br />
11.9<br />
13.4<br />
28.1<br />
28.7<br />
24.1<br />
24.9<br />
25.1<br />
6<br />
0<br />
3.9<br />
FY09 FY10 FY11 FY12E FY13E<br />
Mar-05<br />
Dec-05<br />
Aug-06<br />
May-07<br />
Jan-08<br />
Oct-08<br />
Jul-09<br />
Mar-10<br />
Dec-10<br />
Aug-11<br />
August 2011 69
Torrent Pharma<br />
Financials and valuations: Torrent Pharma<br />
Income Statement<br />
(INR Million)<br />
Y/E March 2010 2011 2012E 2013E<br />
Net Revenues 19,040 22,265 25,596 29,817<br />
Change (%) 16.8 16.9 15.0 16.5<br />
Total Expenditure 14,944 18,173 20,445 23,748<br />
% of Sales 78.5 81.6 79.9 79.6<br />
EBITDA 4,096 4,092 5,151 6,069<br />
Margin (%) 18.5 14.4 16.4 16.7<br />
Depreciation 661 626 952 1,137<br />
EBIT 3,435 3,466 4,199 4,932<br />
Int. and Finance Charges 251 121 172 172<br />
Other Income - Rec. 127 81 109 153<br />
PBT before EO Expense 3,312 3,427 4,137 4,913<br />
Extra Ordinary Exp./(Inc.) 368 0 -21 0<br />
PBT after EO Expense 2,944 3,427 4,158 4,913<br />
Current Tax 705 720 745 884<br />
Deferred Tax -74 5 0 0<br />
Tax 632 725 745 884<br />
Tax Rate (%) 19.1 21.2 18.0 18.0<br />
Reported PAT 2,312 2,702 3,413 4,029<br />
Adj PAT 2,680 2,702 3,392 4,029<br />
Balance Sheet<br />
(INR Million)<br />
Y/E March 2010 2011 2012E 2013E<br />
Equity Share Capital 423 423 423 423<br />
Total Reserves 7,887 9,801 12,531 15,755<br />
Net Worth 8,310 10,224 12,955 16,178<br />
Deferred liabilities 499 480 480 480<br />
Total Loans 5,224 5,721 5,721 5,721<br />
Capital Employed 14,033 16,441 19,155 22,378<br />
Ratios<br />
Y/E March 2010 2011 2012E 2013E<br />
Basic (INR)<br />
EPS (INR) 31.7 31.9 40.1 47.6<br />
Cash EPS 35.1 39.3 51.6 61.1<br />
BV/Share 98.2 120.8 153.1 191.2<br />
DPS 7.0 9.3 8.1 9.5<br />
Payout (%) 25.6 29.1 20.0 20.0<br />
Valuation (x)<br />
P/E 18.4 14.7 12.4<br />
Cash P/E 15.0 11.4 9.6<br />
P/BV 4.9 3.8 3.1<br />
EV/Sales 2.3 1.9 1.6<br />
EV/EBITDA 12.4 9.6 8.0<br />
Dividend Yield (%) 1.6 1.4 1.6<br />
Return Ratios (%)<br />
EBITDA Margins (%) 18.5 14.4 16.4 16.7<br />
Net Profit Margins (%) 14.1 12.1 13.3 13.5<br />
RoE 36.2 29.2 29.3 27.7<br />
RoCE 28.7 24.1 24.9 25.1<br />
Working Capital Ratios<br />
Asset Turnover (x) 1.4 1.4 1.3 1.3<br />
Fixed Asset Turnover (x) 3.6 3.6 3.3 3.3<br />
Debtor (Days) 56 55 57 59<br />
Leverage Ratio (x)<br />
Current Ratio 2.1 1.7 1.8 1.9<br />
Interest Cover Ratio 13.7 28.7 24.5 28.7<br />
Debt/Equity 0.6 0.6 0.4 0.4<br />
Gross Block 8,129 10,385 12,685 14,885<br />
Less: Accum. Deprn. 2,718 3,343 4,295 5,432<br />
Net Fixed Assets 5,411 7,041 8,390 9,452<br />
Capital WIP 1,098 1,500 1,200 1,500<br />
Investments 1,412 1,460 1,460 1,460<br />
Curr. Assets 11,607 15,346 17,990 21,490<br />
Inventory 3,236 5,048 5,794 6,676<br />
Account Receivables 2,982 3,404 4,090 4,927<br />
Cash and Bank Balance 3,883 4,788 5,856 7,105<br />
Loans & Advances 1,506 2,106 2,250 2,782<br />
Curr. Liability & Prov. 5,496 8,907 9,884 11,524<br />
Account Payables 4,216 7,479 7,839 9,140<br />
Provisions 1,280 1,427 2,045 2,384<br />
Net Current Assets 6,111 6,440 8,106 9,966<br />
Appl. of Funds 14,033 16,441 19,155 22,378<br />
E: MOSt Estimates<br />
Cash Flow Statement<br />
(INR Million)<br />
Y/E March 2010 2011 2012E 2013E<br />
Oper. P/L before Tax 4,096 4,092 5,151 6,069<br />
Interest/Dividends Recd. 127 81 109 153<br />
Direct Taxes Paid -717 -744 -745 -884<br />
(Inc)/Dec in WC 349 577 -598 -611<br />
CF from Operations 3,856 4,005 3,917 4,726<br />
EO Expense / (Income) 368 0 -21 0<br />
CF from Oper. incl EO Exp. 3,488 4,005 3,938 4,726<br />
(inc)/dec in FA -1,487 -2,657 -2,000 -2,500<br />
(Pur)/Sale of Investments -17 -48 0 0<br />
CF from Investments -1,504 -2,705 -2,000 -2,500<br />
(Inc)/Dec in Debt 398 513 -16 0<br />
Interest Paid -251 -121 -172 -172<br />
Dividend Paid -592 -787 -683 -806<br />
Others 44 -1 0 0<br />
CF from Fin. Activity -401 -395 -870 -977<br />
Inc/Dec of Cash 1,583 905 1,068 1,249<br />
Add: Beginning Balance 2,300 3,883 4,788 5,856<br />
Closing Balance 3,883 4,788 5,856 7,105<br />
August 2011 70
Domestic Formulations | <strong>New</strong> Peaks<br />
This page is<br />
left blank<br />
intentionally<br />
August 2011 71
Domestic Formulations | <strong>New</strong> Peaks<br />
MEDICINES<br />
MEDICINES CAPSULE Score<br />
64/100<br />
Of patent and parent<br />
GSK Pharma<br />
CMP: INR2,155<br />
GLXO IN<br />
TP: INR2,330 Buy<br />
M: Mix 4/10<br />
GSK derives majority of its revenue from the acute<br />
therapeutic segments and has very little presence<br />
in the chronic segments.<br />
GSK derives 95% of its revenues from acute<br />
therapeutic segments with dominant presence in<br />
Anti-infcetives, dermatology, pain management and<br />
Vitamins.<br />
It also enjoys leadership position in the<br />
Dermatology segment.<br />
E: Equity with doctors 9/10<br />
Enjoys strong brand equity in its some of the largest<br />
therapeutic segments in the industry. It ranks no.1<br />
in dermatology segment, no.3 in Pain management<br />
and Vitamins segments and no5 in AI and<br />
respiratory segments.<br />
Based on prescription ranking, GSK Pharma is the<br />
market leader in Dermatology, vitamins and pain<br />
managements segment while ranks no.4 in<br />
respiratory segment.<br />
D: Distribution & reach 7/10<br />
Derives 60% of the revenues from Metro and Tier I<br />
cities.<br />
Contribution of Tier II and rural area to total<br />
revenues has remained stagnant over the last 5<br />
years.<br />
It has field force of 3000MRs which is on a lower<br />
side compared to other Indian companies of similar<br />
size.<br />
I: Introductions 3/10<br />
GSK is among the laggards when it comes to<br />
launch of new products.<br />
GSK has launched very few new products over the<br />
last 4 years compared to its peers. It has launched<br />
5 new products (including line extensions) annually<br />
over the last 4 years.<br />
Ramp-up in domestic formulations revenues is<br />
driven largely by existing products.<br />
Stock info<br />
Equity Shares (m) 84.7<br />
52-Week Range (INR) 2,475/1,850<br />
1,6,12 Rel. Perf. (%) 5/7/22<br />
M.Cap. (INR b) 182.5<br />
M.Cap. (USD b) 4.0<br />
Financial & valuation summary<br />
Year Net Sales PAT EPS EPS P/E P/BV RoE RoCE EV/ EV/<br />
End (INR m) (INR m) (INR) Gr. (%) (x) (x) (%) (%) Sales EBITDA<br />
12/09A 18,708 5,049 59.6 12.6 - - 28.7 43.0 - -<br />
12/10A 21,116 5,814 68.6 15.2 31.4 9.5 30.1 44.8 7.6 21.9<br />
12/11E 23,740 6,567 77.5 12.9 27.8 8.7 31.3 46.3 6.8 20.2<br />
12/12E 26,921 7,586 89.6 15.5 24.1 8.0 33.4 49.5 5.9 17.2<br />
Background<br />
GSK Pharma is the 4th largest formulations company in India, with a strong presence in segments like<br />
dermatology, respiratory and vaccines. Its parent has one of the richest product and R&D pipelines among<br />
Pharma companies worldwide. The company is in the process of expanding its presence in the life-style<br />
segment led by new launches from the parent's portfolio, launch of branded generics and in-licensing.<br />
August 2011 72
GSK Pharma<br />
CEO Profile<br />
CEO<br />
GSK Pharma is a 50% subsidiary of GSK Plc (UK) and is being currently managed by Dr. Hasit Joshipura<br />
(MD). Maintaining a leading presence in India and sustaining one of the highest profitability and return<br />
ratios in the industry despite miniscule presence in the high-growth life-style segments is the key<br />
achievement.<br />
C: CAGR and scale-up 6/10<br />
GSK has significantly underperformed the industry<br />
with revenue CAGR of 8.1% over CY04-10 versus<br />
industry revenue CAGR of 14.8% over the same<br />
period. The company has gradually lost its market<br />
share and slipped through the ranking.<br />
We expect it to grow at 13-14% CAGR over CY10-<br />
12 which is slightly lower than the industry average,<br />
mainly due to high base and intensifying<br />
competition in acute segment.<br />
I: Improvement in productivity 9/10<br />
GSK enjoys one of the highest MR productivity in<br />
the industry with annual revenue per MR at<br />
INR7.7m.<br />
MR growth was at 5.9% compared to revenue<br />
growth of 8.1% for CY04-10<br />
The company has reported an improvement in<br />
workforce productivity over CY04-10. At this level<br />
the productivity is amongst the best in the industry.<br />
N: Non-domestic business NA<br />
N A<br />
E: Earnings growth 6/10<br />
Expect overall topline CAGR of 13% for CY10-12<br />
leading to EPS CAGR of 14.2%<br />
" EPS growth is higher than topline growth mainly<br />
due to expanding EBITDA margins.<br />
S: Stock Attractiveness 14/20<br />
One of the most conservative managements<br />
amongst Indian pharmaceutical companies<br />
Return ratios are amongst the best in the industry<br />
with ROCE in excess of 40% and RoEs in excess<br />
of 30%. GSK is currently valued at 27.8x CY11E<br />
and 24.1x CY12E<br />
Maintain Buy with TP of INR 2,330 (26x CY12E<br />
EPS)<br />
Stock performance (1 year)<br />
GSK Pharma Sens ex - Rebas ed<br />
2,600<br />
2,350<br />
2,100<br />
1,850<br />
1,600<br />
Aug-10 Nov-10 Feb-11 May -11 Aug-11<br />
August 2011 73
GSK Pharma<br />
India formulations<br />
snapshot<br />
Second largest Pharma MNC in<br />
India. Before Abbott took over<br />
Piramal Healthcare's domestic<br />
formulation business, GSK<br />
was the largest pharma MNC<br />
in India. We believe GSK is one<br />
of the best plays on the IPR<br />
regime in India with aggressive<br />
plans to launch new products<br />
in the high-growth lifestyle<br />
segments. These launches are<br />
expected to bring long-term<br />
benefits.<br />
EBITDA Contribution<br />
Of patent and parent<br />
Solid play on new patent regime<br />
GSK Pharma is among the best performing MNCs in the domestic formulation space with its<br />
strong parentage and brand equity among doctors. It leads the industry in profitability despite<br />
its meager presence in highly profitable chronic segments. GSK's MR productivity is the best<br />
among the leading companies. We believe GSK's growth trajectory will increase from CY13<br />
as it gets meaningful revenue from new launches.<br />
1. Mix: 4/10<br />
Acute segments account for most of GSK's sales<br />
The top seven therapeutic segments, AI, Dermatology, Pain Management, Vitamins,<br />
Respiratory, Hormones and GI, contribute ~86% to GSK's domestic formulations revenue.<br />
GSK derives 95% of its revenue from acute therapeutic segments. Over the past 10 years<br />
the contribution of Dermatology and Pain Management rose from lower single digits to<br />
double digits while that of Vitamins and Respiratory segments fell from 50% to 18.4%.<br />
DF EBITDA 100%<br />
Among the leading players<br />
in the industry<br />
GSK has maintained<br />
leadership in the industry<br />
though its ranking has slipped<br />
from No1 to No4 over the past<br />
few years. However, GSK<br />
has maintained its strong<br />
position despite few new<br />
launches. Its market share fell<br />
from 5.23% in 2006 to 4.26%<br />
in 2010 due to low growth<br />
stemming from very few new<br />
launches and stiffer<br />
competition. GSK's business<br />
posted CAGR of 8.1% over<br />
the past six years against<br />
14% CAGR for industry.<br />
GSK Pharma: Therapeutic mix<br />
GI<br />
7%<br />
Res pirat<br />
ory<br />
24%<br />
Others<br />
15%<br />
Anti-Parasitic 3%<br />
GI 7%<br />
CY 2000<br />
AI<br />
21%<br />
VMN<br />
26%<br />
Dermatol<br />
ogy/Ster<br />
oids<br />
2%<br />
Pain<br />
5%<br />
Gynaec 3% CVS 3%<br />
March 2011<br />
GI<br />
6%<br />
Respirat<br />
ory<br />
10%<br />
Others<br />
15%<br />
Others 6%<br />
VMN<br />
15%<br />
CY 2004<br />
AI 21%<br />
AI<br />
25%<br />
Pa in<br />
11%<br />
Dermatol<br />
ogy/Ster<br />
oids<br />
18%<br />
Market share and growth<br />
Mkt Share (%)<br />
Grow th (%)<br />
19.2<br />
5.2<br />
4.9<br />
4.5<br />
4.3<br />
Hormones 8%<br />
Respiratory 9%<br />
Dermatology 19%<br />
6.8<br />
2.9<br />
3.6<br />
9.3<br />
4.3<br />
VMN 10% Pain 11%<br />
Source: Company/Industry/MOSL<br />
2006 2007 2008 2009 2010<br />
August 2011 74
GSK Pharma<br />
2. Equity with doctors: 9/10<br />
GSK leads the industry in AI, Dermatology, Pain Management<br />
GSK ranks first in the Dermatology space in India with market share of 20% and ranks<br />
third in the Pain Management and Vitamins segments with market share of 6.4% and<br />
7.3% respectively. It ranks fifth in two of the industry's largest therapeutic segments, AI<br />
and Respiratory, with market share of 6% and 5.1% respectively. However over the past<br />
two years, the company lagged the industry growth rate in almost all therapeutic segments<br />
due to very few new launches.<br />
GSK Pharma: Market share in key therapies (%) GSK Pharma: Growth composition (%) (2010)<br />
20.3<br />
16.0<br />
14.6<br />
Avg Gr - Company Av g Gr - Industry<br />
16.2 16.7 16.4<br />
13.9<br />
18.4<br />
17.4<br />
9.8<br />
6<br />
5.1<br />
6.4<br />
7.3<br />
7.1<br />
AI Respiratory Pain/Analgesic VMN Dermatology<br />
AI Res piratory Pain/Analgesic VMN Dermatology<br />
* Average growth over 2009-2010 Source: Industry/MOSL<br />
GSK has strong brand equity among physicians, which is visible from its market share and<br />
prescriptions rankings. GSK ranks first in the Dermatology, Vitamins and Pain Management<br />
segments with prescription market share of 10.4%, 8.7% and 7% respectively. GSK ranks<br />
fourth in the Respiratory segment and sixth in the Gynecology segment.<br />
Prescription ranking of GSK<br />
Jan-07 Jan-08 Jan-09 Jan-10 Oct-10<br />
Derma 1 1 1 1 1<br />
Vit 1 1 1 1 1<br />
Pain Mgmt 1 1 2 2 1<br />
Respiratory 3 3 3 3 4<br />
Gynaec 1 4 6 6 6<br />
Anti-infectives 9 9 9 10 10<br />
GI 10 9 13 15 15<br />
CVS 16 18 18 19 20<br />
Source: Industry/MOSL<br />
Top 10 brands contribute 45% to GSK revenue<br />
GSK's top 10 brands contribute ~45% to its total revenue. The brand concentration is<br />
among the highest in the industry. It shows GSK's brand building ability and its strong<br />
brand recall among physicians. GSK's top 10 brands feature among the industry's top 100<br />
brands. Its No1 brand, Augmentin (Amoxycillin, AI), ranks fifth in the industry and posted<br />
18% growth over the past four years. Eight of the 10 brands posted double-digit CAGR<br />
over the past four years.<br />
August 2011 75
GSK Pharma<br />
Top 10 brands<br />
Brand Drug Product Launch Sales (INR m) YoY Gr (%) CAGR (%)<br />
Zinetac Ranitidine 1986 1,032 12.5 12.6<br />
Augmentin Amoxy. & Clav. 1994 1,704 27.7 18.0<br />
Ceftum Cefuroxime 1991 798 23.8 14.0<br />
Calpol Paracetamol 1995 1,101 16.6 15.5<br />
Phexin Cephalexin 1989 813 10.2 6.4<br />
Eltroxin Levothyroxine 2000 638 19.2 17.0<br />
Betnovate-c Betameth.+Chinoform. 1996 633 31.7 13.7<br />
Betnovate-n Betameth.+Neom. 1996 631 29.3 10.9<br />
Neosporin Antibio. Comb. 1996 630 18.8 15.5<br />
Betnesol Betamethasone injectables 1971 822 11.3 7.2<br />
CAGR through 2006-10<br />
Source: Industry/MOSL<br />
3. Distribution and reach: 7/10<br />
GSK derives 60% of its revenue from metros and Class-I towns compared with an industry<br />
average of 63%. Over the past four years revenue CAGR for all geographies has lagged<br />
the industry average. However, GSK's CY10 growth in all geographies was in higher<br />
double digits.<br />
GSK: Geographical distribution of revenues (%) Geographical distribution of revenues: Industry (%)<br />
METROS CLASS I TOWNS CLASS II TO VI RURAL<br />
21.9 22.9 22.4 20.7 19.7<br />
19.0 19.4 20.6 20.4 20.1<br />
31.7 30.7 31.4 32.3 32.0<br />
METROS CLASS I TOWNS CLASS II TO VI RURA L<br />
20.6 20.9 20.0 18.1 17.3<br />
19.2 19.0 19.5 19.4 19.6<br />
32.6 31.3 31.6 32.5 32.0<br />
27.4 27.0 25.6 26.6 28.2<br />
27.6 28.9 28.9 30.0 31.0<br />
CY06 CY07 CY08 CY09 CY10<br />
CY 06 CY 07 CY 08 CY 09 CY 10<br />
GSK: Geography-wise growth rates (%) Industry: Geography-wise growth rates (%)<br />
METROS<br />
CLASS I TOWNS<br />
CLASS II TO VI RURAL<br />
26.7<br />
17.7<br />
17.7<br />
13.3<br />
9.7<br />
12.7<br />
13.3<br />
7.5<br />
6.0<br />
5.2<br />
8.3<br />
1.3<br />
1.6<br />
0.8<br />
-0.5<br />
CY07 CY08-1.8<br />
CY09 CY10<br />
METROS<br />
CLASS I TOWNS<br />
CLASS II TO VI<br />
RURA L<br />
26.2<br />
23.5<br />
17.6<br />
17.5<br />
17.7<br />
20.7<br />
15.6<br />
17.5<br />
14.0<br />
16.4<br />
11.1<br />
14.7<br />
13.0<br />
7. 9<br />
9.5<br />
2.5<br />
CY 07 CY 08 CY 09 CY 10<br />
Source: Industry/MOSL<br />
August 2011 76
GSK Pharma<br />
4. Introductions: 3/10<br />
Existing products lead revenue growth over the past four years<br />
Over the past four years, GSK launched very few new products-22 new products including<br />
line extensions-compared with its peers. The average revenue per new launch has improved<br />
marginaly from been virtually stagnant from INR71m in CY07 to INR81m in CY10. Topline<br />
growth over the past four years has been almost entirely driven by existing products,<br />
which reflects GSK's ability to leverage existing brands.<br />
GSK Pharma: <strong>New</strong> launches GSK Pharma: Growth composition (%)<br />
No. Of launches in last 2 yrs<br />
Avg sales per launch (INR m)<br />
124.5<br />
<strong>New</strong> Launches<br />
Ex is ting Brands<br />
71.4<br />
81.6<br />
81.3<br />
17.4<br />
7.4<br />
13 15 23 36<br />
CY07 CY08 CY09 CY10<br />
2.2 2.8<br />
0.7 0.8 1.9 1.8<br />
CY07 CY08 CY09 CY10<br />
Source: Industry/MOSL<br />
5. CAGR and scale up: 6/10<br />
We expect 13-14% CAGR for GSK's domestic formulations business over the next few<br />
years. GSK's top-line growth will be led by a focus on priority products, which will sustain<br />
double-digit growth. This will be driven by expanding therapeutic and geographic coverage<br />
and with incremental contribution from new launches. We believe the growth trajectory<br />
will improve in the long term as new launches contribute meaningfully to the top-line.<br />
6. Improvement in MR productivity: 9/10<br />
GSK's sales force productivity increases<br />
GSK's revenue posted CAGR of 8.7% over CY04-10 and its sales force posted CAGR of<br />
5.9% over CY04-10, implying improvement in salesforce productivity. In 2004, GSK derived<br />
INR6.5m revenue per MR, which rose to INR7.7m in CY10. GSK's current MR productivity<br />
is arguably one of the best in the industry.<br />
August 2011 77
GSK Pharma<br />
GSK Pharma: Salesforce productivity<br />
No. of MRs Revenue per MR (INR m)<br />
7.7<br />
Sales force addition CAGR (%)<br />
Produc tivity Improv ement CAGR (%)<br />
6.5<br />
11.5<br />
5.9<br />
1,775 2,500<br />
1.5 1.9<br />
2004 2010<br />
GSK<br />
Indus try<br />
Source: Company/Industry/MOSL<br />
8-9. Earnings growth and stock attractiveness: 20/30<br />
We believe GSK is one of the best plays on the IPR regime in India with aggressive plans<br />
to launch new products in the high growth lifestyle segments. These launches are expected<br />
to bring it long-term benefits. We believe GSK is likely to sustain double-digit topline<br />
growth over the next few years. We believe this growth trajectory will improve after<br />
CY13, as new launches contribute meaningfully to the top-line. Given the high profitability<br />
of operations, we expect this growth to lead to sustainable double-digit earnings growth<br />
and RoE of ~30%. This growth is likely to be funded through miniscule capex and negative<br />
net working capital. GSK deserves premium valuations due to strong parentage (giving<br />
access to a large product pipeline), brand-building ability and likely positioning in the post<br />
patent era. GSK is one of the very few companies with the ability to drive reasonable<br />
growth without major capital requirement, leading to high RoCE of over 45%. We expect<br />
GSK to record CY11E EPS of INR77.5 (up 12.9%) and CY12E EPS of INR89.6 (up<br />
15.5%). The stock is valued at 27.8x CY11E and 24.1x CY12E earnings. Maintain Buy<br />
with a target price of INR2,330 (26x CY11E).<br />
GSK RoE & RoCE (%)<br />
GSK one year forward P/E<br />
RoE<br />
44.0 44.8<br />
43.0<br />
RoCE<br />
46.3<br />
49.5<br />
34<br />
28<br />
P/ E (x ) Avg(x) Peak(x) Min(x)<br />
30.2<br />
29.1 28.7<br />
30.1 31.3<br />
33.4<br />
22<br />
23.1<br />
24.6<br />
16<br />
14.8<br />
10<br />
2008 2009 2010 2011E 2012E<br />
Aug-06<br />
Mar-07<br />
Aug-07<br />
Feb-08<br />
Aug-08<br />
Feb-09<br />
Aug-09<br />
Feb-10<br />
Aug-10<br />
Feb-11<br />
Aug-11<br />
August 2011 78
GSK Pharma<br />
Financials and valuations: GSK Pharma<br />
Income Statement<br />
(INR Million)<br />
Y/E December 2009 2010 2011E 2012E<br />
Net Sales 18,708 21,116 23,740 26,921<br />
Change (%) 12.7 12.9 12.4 13.4<br />
Materials Consumed 6,922 7,770 8,784 9,961<br />
Personnel Expenses 2,094 2,409 2,842 3,212<br />
Other Expenses 3,146 3,560 4,163 4,525<br />
Total Expenditure 12,162 13,739 15,789 17,698<br />
EBITDA 6,546 7,378 7,951 9,223<br />
Change (%) 13.3 12.7 7.8 16.0<br />
Margin (%) 35.0 34.9 33.5 34.3<br />
Depreciation 164 176 202 231<br />
Int. and Finance Charges 4 6 0 0<br />
Other Income - Rec. 1,206 1,477 1,969 2,234<br />
PBT & EO Expense 7,585 8,673 9,718 11,226<br />
Tax 2,536 2,859 3,152 3,641<br />
Tax Rate (%) 33.4 33.0 32.4 32.4<br />
Adj PAT 5,049 5,814 6,567 7,586<br />
EO Expense (net of tax) -74 177 1,859 0<br />
Reported PAT 5,123 5,637 4,708 7,586<br />
Change (%) 12.6 15.2 12.9 15.5<br />
Margin (%) 27.4 26.7 19.8 28.2<br />
Balance Sheet<br />
(INR Million)<br />
Y/E December 2009 2010 2011E 2012E<br />
Equity Share Capital 847 847 847 847<br />
Reserves 16,728 18,445 20,115 21,826<br />
Capital Reserve 17 17 17 17<br />
Net Worth 17,591 19,308 20,979 22,689<br />
Loans 54 52 0 0<br />
Capital Employed 17,646 19,360 20,979 22,689<br />
Gross Block 2,892 3,184 3,784 4,184<br />
Less: Accum. Deprn. 1,964 2,095 2,297 2,528<br />
Net Fixed Assets 928 1,089 1,487 1,656<br />
Capital WIP 214 87 214 214<br />
Investments 1,909 1,604 20,566 22,194<br />
Curr. Assets 21,144 24,483 6,932 7,834<br />
Inventory 2,530 2,815 3,157 3,580<br />
Account Receivables 537 470 665 727<br />
Cash and Bank Balance 16,726 19,481 1,187 1,346<br />
Others 1,351 1,717 1,923 2,181<br />
Curr. Liability & Prov. 6,996 8,468 8,784 9,772<br />
Account Payables 3,167 3,567 4,036 4,523<br />
Provisions 3,830 4,900 4,748 5,250<br />
Net Current Assets 14,148 16,016 -1,852 -1,938<br />
Ratios<br />
Y/E December 2009 2010 2011E 2012E<br />
Basic (INR)<br />
EPS 59.6 68.6 77.5 89.6<br />
Cash EPS 61.5 70.7 79.9 92.3<br />
BV/Share 207.7 228.0 247.7 267.9<br />
DPS 30.0 40.0 50.0 60.0<br />
Payout (%) 58.9 66.5 73.5 76.4<br />
Valuation<br />
P/E 31.4 27.8 24.1<br />
Cash P/E 30.5 27.0 23.4<br />
P/BV 9.5 8.7 8.0<br />
EV/Sales 7.6 6.8 5.9<br />
EV/EBITDA 21.9 20.2 17.2<br />
Dividend Yield (%) 1.9 2.3 2.8<br />
Return Ratios (%)<br />
RoE 28.7 30.1 31.3 33.4<br />
RoCE 43.0 44.8 46.3 49.5<br />
Working Capital Ratios<br />
Fixed Asset Turnover (x) 20.4 20.9 18.4 17.1<br />
Debtor (Days) 10 8 10 10<br />
Inventory (Days) 49 49 49 49<br />
Working Capital (Days) -50 -60 -47 -45<br />
Leverage Ratio<br />
Debt/Equity 0.0 0.0 0.0 0.0<br />
Cash Flow Statement<br />
(INR Million)<br />
Y/E December 2009 2010 2011E 2012E<br />
Oper. Profit/(Loss) bef. Tax 6,546 7,378 7,951 9,223<br />
Interest/Dividends Recd. 1,206 1,477 1,969 2,234<br />
Direct Taxes Paid -2,687 -2,976 -3,152 -3,641<br />
(Inc)/Dec in WC 1,153 -3 -1,392 -720<br />
CF from Operations 6,218 5,876 5,376 7,096<br />
EO expense -74 177 1,859 0<br />
CF frm Op. incl EO exp. 6,292 5,699 3,518 7,096<br />
(inc)/dec in FA -184 -166 -726 -400<br />
(Pur)/Sale of Investments 5,535 216 -17,204 -1,729<br />
CF from investments 5,350 50 -17,931 -2,129<br />
Change in Net Worth 0 0 53 21<br />
Inc/(Dec) in Debt -2 -3 -52 0<br />
Interest Paid -4 -6 0 0<br />
Dividend Paid -3,976 -2,985 -3,863 -4,829<br />
CF from Fin. Activity -3,982 -2,994 -3,862 -4,808<br />
Deferred Tax Assets 447 564 564 564<br />
Appl. of Funds 17,646 19,360 20,979 22,689<br />
E: MOSL Estimates; ^Standalone results<br />
Inc/Dec of Cash 7,660 2,755 -18,274 159<br />
Add: Beginning Balance 9,065 16,726 19,481 1,187<br />
Closing Balance 16,726 19,481 1,187 1,346<br />
E: MOSL Estimates ^ - Standalone results<br />
August 2011 79
Domestic Formulations | <strong>New</strong> Peaks<br />
MEDICINES<br />
MEDICINES CAPSULE Score<br />
77/100<br />
The Sun shines bright !<br />
Sun Pharma<br />
CMP: INR464<br />
SUNP IN<br />
TP: INR524 Neutral<br />
M: Mix 7/10 E: Equity with doctors 9/10<br />
Sun is the best play on the high-growth life-style<br />
segments of CNS, CVS and Diabetes. It derives 61%<br />
of its revenues from lifestyle chronic segments<br />
Sun is one of the very few companies which has<br />
focussed on the life-style from its inception.<br />
Sun pharma enjoys strong brand equity in CNS,<br />
Gynaecology, CVS and Anti-diabetic segments.<br />
In CNS and Gynaecology segments, Sun Pharma<br />
ranks No.1 with prescription market share of 12%<br />
and 4.2% respectively while in CVS and Antidiabetics<br />
segment it ranks no 2 with prescription<br />
market share of 6.8% and 7.8% respectively.<br />
Further, it has either maintained or improved its<br />
prescription ranking in the therapeutic areas where<br />
it is present.<br />
D: Distribution & reach 8/10 I: Introductions 6/10<br />
Derives 73% of the revenues from Metro and Tier<br />
I cities.<br />
The contribution of rural areas to revenues has<br />
come down over the last 5 years.<br />
Further, in last 4 year, revenue CAGR for all<br />
geographies has been in-line or better than industry<br />
average<br />
Sun Pharma's new product launch rate has been<br />
moderate compared to its peers in the industry. It<br />
has launched 31 new products annually (including<br />
line extensions) over the last 4 years.<br />
The revenue growth is driven by both existing<br />
products as well as new launches.<br />
It has field force strength of 2,600<br />
Stock info<br />
Equity Shares (m) 1,035.6<br />
52-Week Range (INR) 538/341<br />
1,6,12 Rel. Perf. (%) 2/22/41<br />
M.Cap. (INR b) 480.5<br />
M.Cap. (USD b) 10.4<br />
Background<br />
Financial & valuation summary<br />
Year Net Sales PAT EPS EPS P/E P/BV RoE RoCE EV/ EV/<br />
End (INR m) (INR m) (INR) Gr. (%) (x) (x) (%) (%) Sales EBITDA<br />
03/11A 52,066 14,041 13.6 47.8 34.2 5.1 16.2 22.9 7.7 22.4<br />
03/11A* 57,214 18,161 17.5 34.4 26.5<br />
03/12E 65,601 17,952 17.3 27.9 26.8 4.4 17.7 20.5 6.6 20.8<br />
03/13E 75,976 21,626 20.9 20.5 22.2 3.9 18.5 22.2 5.5 16.7<br />
* Including Para-IV/one-off upsides<br />
Sun Pharma is one of the largest Indian companies in the domestic formulation space with significant<br />
presence and leadership in fast growing chronic therapeutic areas like CVS, Diabetes, CNS etc. It offers<br />
the best play on fast growing and most lucrative lifestyle therapeutic segments in India. Over the past<br />
decade it has also expanded its presence to US and 40 other markets. Key markets include India and US.<br />
August 2011 80
Sun Pharma<br />
CEO Profile<br />
CEO<br />
Dilip S. Shanghvi is a graduate in commerce from Kolkata University. He founded Sun Pharma in 1982<br />
and has extensive experience in the pharmaceutical industry. Focused approach to business and sustaining<br />
superior profitability and growth on higher base are his key achievements.<br />
C: CAGR and scale-up 9/10 I: Improvement in productivity 9/10<br />
Sun Pharma has significantly outperformed the<br />
industry with revenue CAGR of 23% over FY05-11.<br />
The company has scaled up the business rapidly<br />
albeit on a low base. The growth is achieved largely<br />
because of favorable therapeutic mix, improvement<br />
in brand equity and increase in field force<br />
productivity.<br />
Sun ranks the best in the industry in terms of MR<br />
productivity. Revenue per MR has improved<br />
significantly from INR3.2m in 2004 to INR7.8m in<br />
2010.<br />
The current field force productivity is one of the<br />
best in the industry.<br />
We expect it to grow domestic formulations at<br />
18.5% CAGR over FY11-13 outperforming the<br />
industry led by strong presence in fast growing<br />
chronic therapeutic areas like CVS, CNS and Antidiabetics,<br />
and improvement in brand equity.<br />
N: Non-domestic business 7/10 E: Earnings growth 9/10<br />
Remain positive on Sun's US business given its<br />
strong chemistry skills, strong generic pipeline and<br />
monetization of some of the niche, low-competition<br />
opportunities<br />
Expect international business to record 15.2% CAGR<br />
for FY11-13 mainly led by the Taro acquisition. Core<br />
international business (excluding one-offs in US)<br />
to record 34% CAGR<br />
Expect overall topline CAGR of 15.2% for FY11-13<br />
leading to EPS CAGR of 24%<br />
Earnings growth will be driven by the Taro<br />
acquisition, sustained momentum in the India<br />
formulations business and gradual improvement in<br />
Caraco<br />
Option values includes upsides from one-off<br />
opportunities in US.<br />
S: Stock Attractiveness 13/20<br />
Focused and cautious approach to international<br />
expansion coupled with highly profitable domestic<br />
business has ensured good return ratios which,<br />
partly muted due to significant cash of USD1b.<br />
Stock performance (1 year)<br />
Sun Pharma<br />
540<br />
480<br />
Sensex - Rebased<br />
Sun is currently valued at 26.8x FY12E and 22.2x<br />
FY13E consolidated earnings<br />
We maintain Neutral with TP of INR524 (25x FY13E<br />
EPS) excluding Para-IV upsides<br />
420<br />
360<br />
300<br />
Aug-10 Nov-10 Feb-11 May-11 Aug-11<br />
August 2011 81
Sun Pharma<br />
India formulations<br />
snapshot<br />
Domestic formulations -<br />
major contributor to<br />
revenue, profits<br />
The domestic formulations<br />
business contributes 42% to<br />
Sun Pharma's revenue, a<br />
contribution that is the highest<br />
among leading Indian generic<br />
companies. The segment is the<br />
most profitable for Sun Pharma<br />
and contributed almost 72% to<br />
EBITDA in FY11.<br />
EBITDA Contribution<br />
Sun Pharma<br />
Non-DF EBITDA 28%<br />
The Sun shines bright !<br />
But dazzling valuation merits caution<br />
Sun Pharma is one of the largest Indian companies in the domestic formulations space with<br />
a significant presence and leadership in fast growing chronic therapeutic areas like CVS,<br />
diabetes and CNS. Over the years, Sun Pharma out-performed industry growth and increased<br />
its market share and brand equity in its major segments. Sun Pharma is arguably the best<br />
company in the industry in terms of improvement in workforce productivity and the best play<br />
on fast growing and the lucrative lifestyle therapeutic segments.<br />
1. Mix: 7/10<br />
Lifestyle segments like CVS, CNS, anti-diabetes dominate sales<br />
Sun Pharma derives 61% of its revenue from lifestyle therapeutic segments, which dominate<br />
the company's revenue mix. The top four therapeutic segments including CNS, CVS, GI<br />
and anti-diabetes contribute ~70% to Sun Pharma's domestic formulations revenue. It is<br />
the market leader in two of the fastest growing therapy segments, CNS and CVS. Sun<br />
Pharma's sizable presence on the chronic therapy segments makes it the most attractive<br />
play in the domestic formulations business.<br />
The largest player in the<br />
chronic therapeutic<br />
segment<br />
Sun Pharma is one of the<br />
largest players in the industry<br />
and has grown its market<br />
share over the years due to<br />
significant presence in fast<br />
growing chronic therapeutic<br />
areas. Sun Pharma is the<br />
largest company in the chronic<br />
segments, in which it<br />
commands 3.66% market<br />
share, which grew from<br />
3.21% in 2006. The company<br />
posted 23.2% CAGR over the<br />
past six years against 14%<br />
CAGR for the industry.<br />
Sun Pharma<br />
17.5<br />
3.21<br />
DF EBITDA 72%<br />
13.7<br />
3.3<br />
Mkt Share (%)<br />
Grow th (%)<br />
17.5 18.2<br />
3.4<br />
3.58<br />
23.9<br />
3.66<br />
CNS, CVS, Diabetes dominates the therapy mix<br />
Respirat<br />
ory<br />
6%<br />
Pain<br />
10%<br />
Others<br />
23%<br />
Gynaeco<br />
GI<br />
logy<br />
6%<br />
2%<br />
FY01<br />
CVS<br />
21%<br />
CNS<br />
32%<br />
Ophthalm<br />
ology 5%<br />
Pain 6%<br />
Gynaec<br />
7%<br />
Diabetes<br />
10%<br />
Respirat<br />
ory 4%<br />
FY11<br />
Others<br />
8%<br />
GI 12%<br />
CNS<br />
27%<br />
CVS<br />
21%<br />
Source: Company/Industry/MOSL<br />
2. Equity with doctors: 9/10<br />
Strong brand equity among specialists, leader in the CVS, CNS, GI and<br />
anti-diabetes segments<br />
Sun Pharma has been a dominant player in three of the industry's fastest growing therapeutic<br />
segments, CNS, CVS and anti-diabetes. Sun Pharma ranks No1 in the CNS and CVS<br />
segments with a value market share of 20.7% and 7.1% respectively. It ranks fourth in<br />
the anti-diabetes segment with market share of 7.8% and sixth in the GI and gynecology<br />
segments with market share of 4.7% and 5.5% respectively. Except in the anti-diabetes<br />
segment, in all other segments the average growth rate over the past two years has been<br />
higher than the industry's.<br />
2006 2007 2008 2009 2010<br />
August 2011 82
Sun Pharma<br />
Market share in key therapies (%) Growth comparison (%) (2010)<br />
20.7<br />
Avg Gr - Company<br />
Avg Gr - Industry<br />
7.1<br />
4.7<br />
5.5<br />
7.8<br />
20.7<br />
25.8<br />
20.2 18.8<br />
21.2<br />
17.9 17.1 18.1 18.7 23.3<br />
CVS GI Gynaecology CNS Anti Diabetic<br />
CVS GI Gynaecology CNS Anti Diabetic<br />
* Average growth over 2009-2010 Source: Industry/MOSL<br />
Sun Pharma has strong brand equity in the CNS, gynaecology, CVS and anti-diabetes<br />
segments, in terms of the number of prescriptions written in the segments. In the CNS and<br />
gynaecology segments, Sun Pharma ranks No1 with a prescription market share of 12%<br />
and 4.2 respectively while in the CVS and anti-diabetes segments it ranks second and its<br />
prescription market share is 6.8% and 7.8% respectively. Over the past few years Sun<br />
Pharma has either maintained or improved its prescription ranking in the therapeutic areas<br />
in which it is present.<br />
Sun Pharma's prescription ranking<br />
Jan-07 Jan-08 Jan-09 Jan-10 Oct-10<br />
CNS 1 1 1 1 1<br />
Gynaec 5 2 2 1 1<br />
CVS 2 2 2 2 2<br />
Anti-diabetic 2 2 2 2 2<br />
GI 15 14 15 12 12<br />
Respiratory 23 25 23 22 22<br />
Source: Industry/MOSL<br />
Top 10 brands contribute 20% of the revenues<br />
Sun Pharma's top 10 brands contribute ~20% to total revenue, which shows low brand<br />
concentration compared with other leading companies. Seven of its brands feature among<br />
the top 300 brands of the industry. Sun Pharma's No1 brand, Pantocid, (Pantoprazole, GI)<br />
ranks 87th in the industry and has posted revenue CAGR of 19% over the past four years.<br />
This is the only company among the companies covered in this report to post double-digit<br />
revenue CAGR in all its top 10 brands.<br />
Top 10 brands of the company<br />
Brand Drug Product Product Sales YoY Gr. CAGR<br />
Category Launch (INR m) (%) (%)<br />
Pantocid Pantoprazole Solids Gastro-intestinal 1999 479 20.2 19.5<br />
Glucored Glibenclamide + Metformin Anti-diabetics 2000 457 11.2 11.3<br />
Susten Progesterone Gynaecology 2000 430 16.9 14.3<br />
Aztor Atorvastatin CVS 2000 400 11.6 24.1<br />
Pantocid-D Pantopr.+ Domperidone Gastro-intestinal 2003 355 22.4 28.2<br />
Gemer Glimepiride+Metformin Anti-diabetics 2002 287 20.3 32.6<br />
Strocit Citocholine - 2004 253 2.7 17.7<br />
Repace Losartan CVS 1998 243 8.9 12.3<br />
Encorate Chrono Sodium Valproate CNS 1999 234 10.3 13.9<br />
Clopilet Clopidogrel CVS 2001 230 17.7 25.0<br />
Source: Industry/MOSL<br />
August 2011 83
Sun Pharma<br />
3. Distribution and reach: 8/10<br />
Sun Pharma derives 73% of its revenue from metros and class-I towns, compared with<br />
63% of the industry average, suggesting a focus on these geographies. In the past four<br />
years, revenue CAGR for all geographies has been in line/better than the than that of the<br />
industry average. The contribution of rural areas to revenue has fallen over the past five<br />
years.<br />
Geographical distribution of revenues - Sun Pharma (%) Geographical distribution of revenues - Industry (%)<br />
Metros Class I Tow ns Class II TO VI Rural<br />
14.6 14.1 13.6 12.2 11.0<br />
14.3 14.5 14.2 15.2 16.3<br />
34.0 32.6 34.1 32.8 33.2<br />
37.1 38.8 38.2 39.9 39.5<br />
CY06 CY07 CY08 CY09 CY10<br />
Geography-wise growth rates - Sun Pharma (%) Geography-wise growth rates - Industry (%)<br />
Metros Class I Tow ns Class II To VI Rural<br />
32.9<br />
19.0<br />
14.9<br />
9.2<br />
9.5<br />
22.7<br />
14.9<br />
15.7<br />
13.1<br />
26.4<br />
25.8<br />
23.4 22.6<br />
13.6<br />
12.2<br />
6.2<br />
CY07 CY08 CY09 CY10<br />
Source: Industry/MOSL<br />
4. Introductions: 6/10<br />
Sun Pharma's new product launches have been moderate compared with<br />
its peers in the industry. There has been significant improvement in revenue<br />
per new product launched<br />
Sun Pharma's new launch rate has been moderate compared with its peers in the industry.<br />
It launched 31 new products each year (including line extensions) over the past four<br />
years. The average revenue per new launch has risen substantially in the past four years<br />
from INR112m in 2006 to INR163m in 2010, suggesting better penetration of launched<br />
brands. Revenue growth was driven by existing products and new launches.<br />
August 2011 84
Sun Pharma<br />
Sun Pharma's - new launches Sun Pharma's growth compositions (%) (2010)<br />
No. Of launches in last 2 yrs<br />
Avg sales per launch (INR m)<br />
163.2<br />
<strong>New</strong> Launches<br />
Ex is ting Brands<br />
112.3<br />
103.5<br />
95.8<br />
1.5 8.4<br />
6.9<br />
15.6<br />
86 64 64 60<br />
12.2<br />
9.1<br />
11.3<br />
8.3<br />
CY07 CY08 CY09 CY10<br />
CY07 CY08 CY09 CY10<br />
* Average growth over 2009-2010 Source: Industry/MOSL<br />
5. CAGR and scale up: 9/10<br />
We expect 18.5% CAGR from Sun Pharma's domestic formulations business led by a<br />
strong presence in the fastest growing chronic therapeutic segments. We believe that the<br />
company will continue to outperform the industry and its peers over the foreseeable future<br />
despite a sizable revenue base. We believe that, Sun is likely to strengthen its presence in<br />
key therapeutic areas, improving its ranking in the industry.<br />
Sun Pharma: Domestic formulations revenue ramp-up<br />
Revenue (INR m) Grow th (%)<br />
17.7<br />
6,800<br />
23.1<br />
11,810<br />
25.0<br />
14,762<br />
32.7<br />
19,597<br />
18,301<br />
-6.6<br />
30.1<br />
23,801<br />
26,383<br />
10.9<br />
31,132<br />
18.0<br />
FY05 FY07 FY08 FY09 FY10 FY11 FY12E FY13E<br />
Source: Company/MOSL<br />
6. Improvement in MR productivity: 9/10<br />
Unlike other leading companies covered in this report, Sun Pharma's topline<br />
growth was driven by a significant improvement in MR productivity.<br />
The company leads the pack in productivity improvement<br />
Sun Pharma has done a stellar job over the past six years with a significant improvement<br />
in workforce productivity. Over FY04-10, Sun Pharma's domestic formulations revenues<br />
posted 23.3% CAGR and its sales force expanded by just 6.3% CAGR, implying significant<br />
productivity improvement of the workforce. In 2004, Sun Pharma derived revenue of<br />
INR3.2m per MR, which rose to INR7.8m in 2010. The productivity was among the best<br />
in the industry.<br />
August 2011 85
Sun Pharma<br />
Sun Pharma: Sales force productivity<br />
No. of MRs Revenue per MR (INR m)<br />
7.8<br />
Sales force addition CAGR (%)<br />
Productivity Improvement CAGR (%)<br />
6.3<br />
3.2<br />
16.0<br />
11.5<br />
1,799 2,600<br />
2004 2010<br />
Sun Pharma<br />
1.9<br />
Industry<br />
Source: Company/Industry/MOSL<br />
7. Non-domestic business: 7/10<br />
Positives<br />
• Strong presence in the US through its own supplies, Taro and Caraco.<br />
• Strong chemistry skills and backward integrated low-cost operations.<br />
• Pragmatic mix of low-competition, Para-IV and normal products for the US market.<br />
• Targets niche opportunities in the US market.<br />
• One of the most profitable domestic business with strong presence in high growth<br />
segments<br />
Risks & concerns<br />
• Slow progress in resolving cGMP issues at Caraco<br />
• Potential damages for "at-risk" launch of generic Protonix in the US.<br />
• Integration of Taro and sustaining the improvement in its profitability will be a key<br />
challenge.<br />
• Gradual ramp-up in emerging market portfolio.<br />
• Astute tax planning results in very low taxes - tax can increase significantly if tax laws<br />
are changed.<br />
Key news flows/triggers<br />
• Update on generic Eloxatin.<br />
• Launch of generic Prandin in US under exclusivity.<br />
• US Federal Circuit Court ruling on Protonix patent litigation.<br />
• Ramp-up in generic Effexor XR sales.<br />
• Steps to sustain profitability of Taro and to improve its R&D productivity.<br />
Impact assessment<br />
• Positive on Sun Pharma's US business given its strong chemistry skills, generic pipeline<br />
and monetization of some niche, low-competition opportunities.<br />
• Expect the international business to post 15.2% CAGR over FY11-13 led mainly by<br />
the Taro acquisition. Core international business (excluding one-offs in the US) will<br />
post 34% CAGR over FY11-13.<br />
• Option values include upsides from future inorganic initiatives - the company has cash<br />
of ~USD1b.<br />
August 2011 86
Sun Pharma<br />
Sales mix (INR m)<br />
FY09 FY10 FY11 FY12E FY13E FY11-13<br />
CAGR (%)<br />
Domestic Sales<br />
Formulations 19,597 18,301 23,801 26,383 31,132 14.4<br />
API 1,042 1,021 1,130 1,186 1,234 4.5<br />
Others 11 11 17 17 17 14.4<br />
Total Domestic Sales 20,650 19,334 24,948 27,586 32,383 13.9<br />
% of total sales 47.2 47.4 43.0 41.4 41.9<br />
International sales<br />
Formulations 19,256 16,892 28,982 34,607 39,922 17.4<br />
Taro 0 0 9,962 17,357 19,008<br />
Caraco-Generics15,409 11,076 13,042 4,882 6,072 -31.8<br />
Branded 3,847 5,816 5,978 12,368 14,842 57.6<br />
API 3,804 4,470 4,083 4,409 4,850 2.8<br />
Others 41 66 54 60 66 11.0<br />
Total International sales 23,101 21,428 33,119 39,076 44,839 16.4<br />
% of total sales 52.8 52.6 57.0 58.6 58.1<br />
Gross Sales 43,751 40,761 58,066 66,662 77,221 15.3<br />
Less: Indirect Taxes 1,917 1,728 852 1,061 1,245<br />
Net Sales 41,833 39,033 57,214 65,601 75,976 15.2<br />
Source: Company/MOSL<br />
EBITDA Contribution<br />
Sun Pharma<br />
Non-DF<br />
EBITDA<br />
28%<br />
DF EBITDA<br />
72%<br />
8-9. Earnings growth and stock attractiveness: 21/30<br />
We expect overall top-line CAGR of 15% over FY11-13, leading to EPS CAGR of 24%.<br />
Earnings growth will be driven by the Taro acquisition, sustained momentum in the India<br />
formulations business and gradual improvement in Caraco.<br />
Sun Pharma has been one of the most consistent performers among Indian pharmaceutical<br />
companies over the past decade. Its profitability is one of the highest among its peers. It<br />
has been able to achieve this despite being a late entrant in the domestic formulations and<br />
the US generic markets, compared with peers like Ranbaxy, Dr Reddy's Labs and Cipla.<br />
Key USPs of the company include:<br />
1. Ability to scale up its operations in India and the US without sacrificing profitability,<br />
i.e., ability to strike an optimum balance between growth and profitability.<br />
2. Has established a very strong and profitable domestic formulations business which,<br />
given its predictable nature, offers a strong foundation to scale-up its international<br />
initiatives.<br />
3. A focused approach by the management - Unlike some of its peers it has not spread<br />
itself very thin by expanding across the globe. Its key markets continue to be India and<br />
the US with expanding presence in some of the emerging markets. It has been able to<br />
avoid the temptation to expand in regulated European markets wherein most of its<br />
peers have got adversely impacted over the past few years due to regulatory changes.<br />
August 2011 87
Sun Pharma<br />
An expanding generic portfolio coupled with sustained double-digit growth in high-margin<br />
life-style segments in India is likely to bring in long-term benefits for Sun Pharma. Its<br />
ability to sustain superior margins even on a high base is a clear positive.<br />
Key drivers for future include:<br />
1. Ramp-up in US business and resolution of Caraco's cGMP issues<br />
2. Monetization of the Para-IV pipeline in the US<br />
3. Taro integration with potential for improvement in its profitability<br />
4. Launch of controlled substances in the US.<br />
While we are positive about SUNP's business outlook, rich valuations have tempered our<br />
bullishness. We maintain Neutral with a target price of INR524 (25x FY13E EPS).<br />
Inorganic initiatives (Sun has cash of ~USD1b) are a key risk to our rating. However, we<br />
believe that given the recent acquisition of Taro, Sun is unlikely to make a large<br />
acquisition.<br />
Sun Pharma RoE & RoCE (%)<br />
Sun Pharma one year forward PE<br />
34<br />
P/E (x) Avg(x) Peak(x) Min(x)<br />
27<br />
29.6<br />
25.0<br />
20<br />
20.2<br />
13<br />
11.9<br />
6<br />
Aug-06<br />
Mar-07<br />
Aug-07<br />
Feb-08<br />
Aug-08<br />
Feb-09<br />
Aug-09<br />
Feb-10<br />
Aug-10<br />
Feb-11<br />
Aug-11<br />
Sun Pharma non-domestic business: key trends, triggers & risk<br />
Building a strong and focused US business<br />
Sun has been able to establish itself as a key Indian player in the US generics market<br />
through a combination of:<br />
1. Strong chemistry skills which has enabled it to develop a strong generic pipeline for<br />
the US market.<br />
2. Good product selection in building presence in the US market - Rather than<br />
targeting all the large products, Sun has focused on building a pragmatic mix of niche,<br />
low-competition products along with other normal products.<br />
3. Identifying key opportunities - This capability is clearly visible in the Taro acquisition<br />
wherein, despite a 3-year delay, Sun has been able to acquire the company and<br />
consequently a profitable portfolio of dermatology and paediatric products.<br />
Over the past few years, Sun has been able to build a very strong pipeline of generic<br />
products for the US market. It currently has 149 ANDAs pending US FDA approval - one<br />
of the strongest pipelines amongst Indian companies.<br />
August 2011 88
Sun Pharma<br />
Key Indian companies - ANDA pipeline<br />
Filed Approved Pending Approval<br />
383<br />
215<br />
204<br />
180<br />
138<br />
138<br />
104<br />
77 76 66<br />
232<br />
151<br />
109<br />
69<br />
40<br />
152<br />
101<br />
51<br />
Aurobindo Dr. Reddy's Ranbaxy Sun Glenmark Lupin<br />
Source: Company/MOSL<br />
Taro acquisition - fills a key gap and complements Sun's US presence<br />
About 90% of Taro's sales come from the US markets. It has expertise in the dermatology<br />
and paediatric segments and has about 170 scientists involved in product development.<br />
One of the key attractions is Taro's capabilities of developing and manufacturing of<br />
ointments, creams, lotions in the semi-solids category. The acquisition fills-in a key gap in<br />
Sun's US portfolio and complements its existing presence in this important market.<br />
Taro enjoys relatively high profitability compared to peers<br />
Given its strengths in the low-competition therapeutic segment, Taro has traditionally enjoyed<br />
relatively higher profitability in the US generics market. We believe that this is sustainable<br />
and in fact, under the control of a capable management like Sun, the profitability is likely to<br />
improve in the future, albeit gradually.<br />
TARO - Key financials<br />
(USD M) CY08 CY09 CY10 2QCY10 2QCY11 1HCY10 1HCY11<br />
Sales 337 359 393 98 112 187 219<br />
Growth (%) 6.6 9.4 14.2 17.4<br />
EBITDA 55 67 85 19 34 39 68<br />
EBITDA Margins (%) 16.4 18.8 21.7 19.9 30.6 20.8 30.8<br />
PBT 56 51 71 20 38 31 71<br />
Tax 12 (70) 18 4 2 6 8<br />
PAT 44 121 52 17 36 25 62<br />
Growth (%) 173.2 (56.8) 119.6 147.9<br />
Source: Company/MOSL<br />
Taro - Good acquisition at reasonable valuations<br />
Unlike some of its other Indian peers, Sun has been extremely cautious in paying for<br />
inorganic growth. The Taro acquisition is a case in point. It has paid ~USD280m for a<br />
66% economic interest in Taro valuing the company at 1x EV/Sales and 4.6x EV/EBITDA<br />
which, we believe is a reasonable valuation compared to some of the other acquisitions<br />
made by a few Indian players.<br />
August 2011 89
Sun Pharma<br />
Caraco - US FDA resolution is likely to be long-drawn<br />
While there is no fresh update on the US FDA resolution at Caraco, the company has, in<br />
the past, indicated that the process will be very gradual. We estimate part-recovery in<br />
Caraco's core US revenue from FY13, based on the assumption that the US FDA issues<br />
will get resolved in FY12. The ongoing US FDA issues have adversely impacted Caraco's<br />
core revenue (excluding distributed products revenue) for the past two years.<br />
Caraco - revenue trend (USD m)<br />
Caraco Revenue - Total<br />
Caraco Revenue - Mfgd Products<br />
350<br />
337<br />
288<br />
234<br />
117 112 125 112<br />
108<br />
22 23<br />
45<br />
138<br />
65<br />
FY07 FY08 FY09 FY10 FY11E FY12E FY13E<br />
Note: Caraco's FY11 financials not given separately; hence, our estimates<br />
Source: Company / MOSL<br />
Guidance - topline growth of 28-30% for FY12<br />
Sun Pharma management has guided 28-30% topline growth for FY12. The strong growth<br />
will be partly driven by full-year consolidation of Taro financials as compared to a little<br />
over two quarters for FY11. Sun had recorded significant one-off upsides, which we<br />
estimate at INR8.4b for FY11 (the company has not disclosed these numbers separately)<br />
and at INR5b for FY12. The guidance includes one-offs for both these years. Based on<br />
these upsides for one-offs, the implied growth guidance for core revenue (ex-Taro) is 18-<br />
19% for FY12. The company intends to file ~25 ANDAs for FY12, R&D expenses are<br />
estimated at 6% of sales, and capex is estimated at INR4.5b.<br />
One-offs to continue in FY12 as well albeit with lower magnitude<br />
We believe SUNP will try to capitalize on some of the Para-IV/low-competition opportunities<br />
in the US in FY12. This will be in line with its past trend of exploiting a few such opportunities<br />
every year. However, we also believe that one-off upsides are likely to decline YoY in<br />
FY12 due to the absence of large opportunities like generic Eloxatin which was a key<br />
contributor in FY11.<br />
FTF/low-competition Upsides in US (INR m)<br />
FY11<br />
FY12E<br />
Eloxatin 4,530 -<br />
Exelon 1,076 1,404<br />
Keppra Inj 704 918<br />
Effexor-XR 1,342 -<br />
Protonix 760 -<br />
Taxotere - 1,181<br />
Prandin - 1,553<br />
Total one-off revenues 8,412 5,056<br />
Total one-off PAT 4,119 2,378<br />
Source: Company / MOSL<br />
August 2011 90
Sun Pharma<br />
Financials and valuations: Sun Pharma<br />
Consolidated Income Statement<br />
(INR Million)<br />
Y/E March 2010 2011 2012E 2013E<br />
Net Sales 41,028 57,214 65,601 75,976<br />
Change (%) -1.9 39.5 14.7 15.8<br />
Total Expenditure 27,394 37,543 44,811 51,008<br />
% of Sales 66.8 65.6 68.3 67.1<br />
EBITDA 13,633 19,672 20,791 24,968<br />
Margin (%) 33.2 34.4 31.7 32.9<br />
Depreciation 1,533 2,041 2,716 3,031<br />
EBIT 12,100 17,631 18,075 21,938<br />
Int. and Finance Charges 62 149 56 60<br />
Other Income - Rec. 2,111 2,876 3,351 4,333<br />
PBT 14,149 20,358 21,370 26,211<br />
Tax 679 1,284 1,069 1,835<br />
Tax Rate (%) 4.8 6.3 5.0 7.0<br />
Profit After Tax 13,471 19,074 20,302 24,376<br />
Change (%) -28.3 41.6 6.4 20.1<br />
Margin (%) 33 33 31 32<br />
Less: Mionrity Interest -40 913 2350 2750<br />
Net Profit 13,511 18,161 20,330 21,626<br />
Adj. PAT 9,501 14,041 17,952 21,626<br />
Ratios<br />
Y/E March 2010 2011 2012E 2013E<br />
Basic (INR)<br />
EPS 13.0 17.5 19.6 20.9<br />
Fully Diluted EPS 13.0 13.6 17.3 20.9<br />
Cash EPS 14.5 19.5 22.3 23.8<br />
BV/Share 75.6 91.6 104.7 120.4<br />
DPS 2.8 3.5 3.6 4.5<br />
Payout (%) 24.7 22.2 21.2 22.2<br />
Valuation (x)<br />
P/E 35.6 34.2 26.8 22.2<br />
Cash P/E 31.9 23.8 20.9 19.5<br />
P/BV 6.1 5.1 4.4 3.9<br />
EV/Sales 10.9 7.7 6.6 5.5<br />
EV/EBITDA 32.7 22.4 20.8 16.7<br />
Dividend Yield (%) 0.6 0.8 0.8 1.0<br />
Return Ratios (%)<br />
RoE 12.8 16.2 17.7 18.5<br />
RoCE 18.7 22.9 20.5 22.2<br />
Consolidated Balance Sheet<br />
(INR Million)<br />
Y/E March 2010 2011 2012E 2013E<br />
Equity Share Capital 1,036 1,036 1,036 1,036<br />
Total Reserves 77,254 93,798 107,441 123,661<br />
Net Worth 78,289 94,833 108,477 124,696<br />
Working Capital Ratios<br />
Fixed Asset Turnover (x) 2.7 2.7 2.4 2.6<br />
Debtor (Days) 105 75 75 75<br />
Inventory (Days) 96 94 93 90<br />
Working Capital T/O (Days) 263 293 319 360<br />
Minority Interest 1,932 8,472 10,822 13,571<br />
Deferred Liabilities -890 -3652 -3652 -3652<br />
Secured Loan 1,003 0 0 0<br />
Unsecured Laon 708 4,256 1,500 1,500<br />
Total Loans 1,711 4,256 1,500 1,500<br />
Capital Employed 81,042 103,908 117,146 136,115<br />
Gross Block 23,340 36,545 41,045 45,545<br />
Less: Accum. Deprn. 8,013 10,053 12,769 15,799<br />
Net Fixed Assets 15,328 26,492 28,276 29,746<br />
Capital WIP 1,448 1,448 1,448 1,448<br />
Goodwill 4,060 7,720 7,720 7,720<br />
Investments 30,664 22,310 22,310 22,310<br />
Curr. Assets 37,121 60,172 71,981 93,114<br />
Inventory 10,739 14,794 16,728 18,734<br />
Account Receivables 11,748 11,716 13,480 15,612<br />
Cash and Bank Balance 6,072 21,936 28,293 43,157<br />
L & A and Others 8,562 11,726 13,480 15,612<br />
Curr. Liability & Prov. 7,579 14,234 14,589 18,221<br />
Account Payables 4,095 9,203 9,212 10,980<br />
Provisions 3,484 5,030 5,377 7,241<br />
Net Current Assets 29,542 45,939 57,392 74,892<br />
Appl. of Funds 81,042 103,908 117,146 136,116<br />
E: MOSL Estimates<br />
Leverage Ratio<br />
Debt/Equity (x) 0.0 0.0 0.0 0.0<br />
Cash Flow Statement<br />
(INR Million)<br />
Y/E March 2010 2011 2012E 2013E<br />
Oper. Profit/(Loss) bef. Tax 13,633 19,672 20,791 24,968<br />
Interest/Dividends Recd. 2,111 2,876 3,351 4,333<br />
Direct Taxes Paid -890 -4,046 -1,069 -1,835<br />
(Inc)/Dec in WC -4,675 -533 -5,097 -2,637<br />
CF from Operations 10,179 17,968 17,977 24,830<br />
(inc)/dec in FA -2,920 -16,864 -4,500 -4,500<br />
(Pur)/Sale of Investments -12,069 8,354 0 0<br />
CF from investments -14,989 -8,510 -4,500 -4,500<br />
Change in networth -2,348 8,251 0 0<br />
(Inc)/Dec in Debt -78 2,545 -2,756 0<br />
Interest Paid -62 -149 -56 -60<br />
Dividend Paid -3,321 -4,241 -4,308 -5,407<br />
CF from Fin. Activity -5,809 6,406 -7,121 -5,467<br />
Inc/Dec of Cash -10,618 15,864 6,357 14,864<br />
Add: Beginning Balance 16,690 6,072 21,936 28,293<br />
Closing Balance 6,072 21,936 28,293 43,157<br />
Note: Cashflows do not tally due to acquisition<br />
August 2011 91
Domestic Formulations | <strong>New</strong> Peaks<br />
MEDICINES<br />
MEDICINES CAPSULE Score<br />
60/100<br />
Guts and glory!<br />
Cadila Healthcare<br />
CMP: INR824<br />
CDH IN<br />
TP: INR907 Neutral<br />
M: Mix 6/10<br />
Cadila's relatively small presence in the fast growing<br />
segments of Diabetes, CNS & CVS (contributes<br />
~24% to sales) will make it difficult for the company<br />
to outpace the market growth.<br />
The CVS and GI segments' contribution to revenue<br />
has risen over the past 10 years from 24% to 37%<br />
while that of respiratory and anti-infectives has fallen<br />
from 32% to 21%.<br />
E: Equity with doctors 7/10<br />
Enjoys good brand equity in a couple of therapeutic<br />
segments.<br />
Cadila is among the top three players in two of the<br />
largest therapeutic segments, CVS and GI. The<br />
company ranks first in the fast growing gynecology<br />
segment.<br />
Cadila has a good prescription market share in the<br />
GI, respiratory and CVS segments.<br />
D: Distribution & reach 7/10<br />
Cadila derives 65% of its revenue from metro and<br />
tier-I cities and is expanding its presence in tier-II<br />
to tier-VI towns.<br />
The company's growth rate in all geographies has<br />
accelerated from CY09.<br />
I: Introductions 5/10<br />
Cadila has few new introductions compared with<br />
its peers and this is one reason why it has not<br />
been able to outperform the market in the past.<br />
Revenue growth has been driven largely by its<br />
existing products over the past four years.<br />
It employs one of the larger field forces in the<br />
industry with MR strength of 4,000.<br />
Stock info<br />
Equity Shares (m) 204.7<br />
52-Week Range (INR) 984/599<br />
1,6,12 Rel. Perf. (%) 5/18/44<br />
M.Cap. (INR b) 168.7<br />
M.Cap. (USD b) 3.7<br />
Financial & valuation summary<br />
Year Net Sales PAT EPS EPS P/E P/BV RoE RoCE EV/ EV/<br />
End (INR M) (INR M) (INR) GR. (%) (X) (X) (%) (%) sales EBITDA<br />
03/10A 36,868 5,011 24.5 55.2 33.7 10.4 35.4 26.4 4.8 22.1<br />
03/11A 46,302 6,334 30.9 26.4 26.6 7.8 37.5 30.5 3.8 17.2<br />
03/12E 51,717 5,801 28.3 -8.4 29.1 6.2 27.3 25.4 3.4 17.2<br />
03/13E 59,983 8,419 41.1 45.1 20.0 5.0 27.6 27.2 2.9 14.0<br />
Background<br />
Cadila is amongst one of the largest domestic pharma companies in India with a strong focus on the<br />
global generics opportunity. The company is gradually building its presence in the regulated generic<br />
markets beginning with the US and France. It also plans to tap some unique opportunities through its JVs<br />
with Nycomed, Hospira. Bayer and Bharat Serums.<br />
August 2011 92
Cadila<br />
Chairman Profile<br />
Chairman<br />
Cadila is one of the most consistent performers amongst the Indian pharmaceutical companies. It is<br />
promoted by Mr. Pankaj Patel. Sustaining strong growth and return ratios coupled with a very conservative,<br />
low-risk management style is his key achievement.<br />
C: CAGR and scale-up 6/10<br />
Cadila's domestic formulations business posted<br />
revenue CAGR of 12.4% over FY05-11, which is<br />
slightly below market growth during the same<br />
period.<br />
We expect Cadila to post revenue CAGR of 13-<br />
14% over FY11-13, which is slightly below<br />
compared to 15-16% CAGR for the industry.<br />
Rapid scale-up in revenue would be difficult given<br />
Cadila's high base and small presence in fastgrowing<br />
chronic segments.<br />
I: Improvement in productivity 5/10<br />
Cadila's is MR productivity has declined at 2%<br />
CAGR over 2004-10.<br />
MR growth was 11.3% and revenue growth was<br />
9.2%, indicating a fall in sales force productivity.<br />
Revenue per MR declined from INR4.1m in 2004 to<br />
INR3.6m in 2010, which however, is in line with the<br />
industry average.<br />
N: Non-domestic business 6/10<br />
We are positive on Cadila's international business,<br />
given its strong chemistry skills and pragmatic mix<br />
of its geographic presence and partnerships.<br />
A cautious approach to establishing international<br />
presence has ensured sustained higher return<br />
ratios for investors.<br />
Cadila has a good track record of forging<br />
partnerships with global players.<br />
E: Earnings growth 6/10<br />
Cadila is one of the most consistently performing<br />
Indian pharmaceutical companies.<br />
We expect overall top-line CAGR of 14% over FY11-<br />
13 leading to EPS CAGR of 15%.<br />
Earnings growth will be led by traction in the<br />
international business and steady growth in the<br />
domestic portfolio.<br />
We expect Cadila's international business to post<br />
revenue CAGR of 16% over FY11-13, led by 18%<br />
CAGR for formulation exports.<br />
S: Stock Attractiveness 12/20<br />
We expect RoE of 25-30% over the next two years,<br />
driven by a cautious approach towards international<br />
expansion and a profitable domestic business.<br />
Cadila is valued at 29.1x FY12E and 20.0x FY13E<br />
consolidated earnings.<br />
Reiterate Neutral with a target price of INR907(22x<br />
FY13E EPS plus INR3 upside from Taxotere).<br />
Stock performance (1 year)<br />
Cadila Health Sensex - Rebased<br />
1,000<br />
850<br />
700<br />
550<br />
400<br />
Aug-10 Nov-10 Feb-11 May -11 Aug-11<br />
August 2011 93
Cadila<br />
India formulations<br />
snapshot<br />
Domestic formulations<br />
contribute most to revenue<br />
The domestic formulations<br />
business is a major contributor<br />
to Cadila's revenue and<br />
EBITDA. In FY11 the segment<br />
contributed 40% to Cadila's<br />
revenue and we estimate<br />
EBITDA contribution was<br />
~45%, since it is one of<br />
Cadila's most profitable<br />
businesses. We believe<br />
despite strong contribution to<br />
profitability, capital employed in<br />
the business is proportionately<br />
lower.<br />
EBITDA Contribution<br />
Non-DF<br />
EBITDA 55%<br />
DF EBITDA<br />
45%<br />
Guts and glory!<br />
Strong in GI, CVS; maintains market share amidst rising competition<br />
Cadila is among the leading companies in the domestic formulations business and has<br />
maintained its market share over the years despite growing competition. Some of Cadila's<br />
brands lead in their segments and the company has strong brand equity in therapeutic<br />
segments like CVS and GI. Besides, Cadila is the largest player in the gynecology segment.<br />
The company has been expanding its presence in all geographies, which is visible from its<br />
growth in 2009 and 2010. We believe Cadila is likely to post a top-line of 13-14% CAGR over<br />
FY11-13, which is slightly below compared to the industry growth.<br />
1. Mix: 6/10<br />
CVS, GI, gynecology dominate sales<br />
The top 3 therapeutic segments, CVS, GI and gynecology, contribute about half of Cadila's<br />
domestic formulations revenue. Other large segments, such as respiratory and anti-infective,<br />
contribute 11% and 10% respectively to total revenue. Over the past 10 years, the<br />
contribution of CVS and GI segments to revenue rose from 24% to 37% while that of<br />
respiratory and anti-infective segments fell from over 32% in FY01 to less than 21% in<br />
FY10.<br />
CVS, GI and Gynaecology dominates the therapy mix<br />
Among the leading players<br />
in the industry<br />
Cadila leads in the highly<br />
CNS<br />
2%<br />
VMN<br />
9%<br />
Others<br />
13%<br />
FY01<br />
CVS<br />
13%<br />
GI<br />
11%<br />
CNS<br />
2%<br />
Others<br />
20%<br />
FY05<br />
CVS<br />
22%<br />
competitive domestic<br />
formulations market and is<br />
among the top five companies<br />
in the industry with market<br />
share of 3.7%. Cadila's market<br />
share rose to 3.74% in 2010<br />
from 3.46% in 2006. Cadila's<br />
Pain<br />
Mgmt<br />
9%<br />
AI<br />
16%<br />
Respira<br />
tory<br />
15%<br />
Gynae<br />
cology<br />
12%<br />
Pa in<br />
Mgmt<br />
9%<br />
AI<br />
11%<br />
Respira<br />
tory<br />
10%<br />
Gynae<br />
cology<br />
10%<br />
GI<br />
16%<br />
domestic formulations<br />
business grew at 12.4%<br />
CVS, GI and Gynaecology dominates the therapy mix<br />
CAGR over the last 6 years<br />
versus 14% CAGR for<br />
industry.<br />
Cadila has maintained it<br />
market share over the<br />
years despite growing<br />
competition<br />
13.6<br />
3.5<br />
Mkt Share (%)<br />
Gr. (%)<br />
16.9<br />
3.7<br />
8.6<br />
3.6<br />
14.8<br />
3.7<br />
24.2<br />
3.7<br />
Anti-Malaria<br />
0%<br />
VMN<br />
2%<br />
Dermatology<br />
3%<br />
Pain Mgmt<br />
AI<br />
7%<br />
10%<br />
CNS Others<br />
3%<br />
16%<br />
Res pira<br />
tory<br />
11%<br />
FY11<br />
CVS<br />
21%<br />
Gy naec ology<br />
10%<br />
GI<br />
17%<br />
2006 2007 2008 2009 2010<br />
Source: Industry/MOSL<br />
August 2011 94
Cadila<br />
2. Equity with doctors: 7/10<br />
Good brand equity; among leaders in CVS, GI, gynecology segments<br />
Cadila has been a dominant player in two of the largest therapeutic segments of the<br />
industry, CVS and GI. Cadila ranks first in the gynecology segment with value market<br />
share of 10.4%. It ranks second in the GI segment with value market share of 6.5% and<br />
it ranks third in the fast growing and second largest, CVS segment with value market<br />
share of 6.5%. Cadila has either grown in line with or above the industry average in its top<br />
4-5 therapeutic segments. In the pain management and dermatology segments, Cadila's<br />
has outperformed the respective segment growth.<br />
Value market share in key therapies (%) (2010) Value growth comparison (%) (2010)<br />
10.4<br />
Avg Gr - Company<br />
Av g Gr - Industry<br />
66.2<br />
6.5 6.5<br />
5.4<br />
4.0<br />
3.7<br />
24.8<br />
15.8 17.9 18.9 17.1 18.4<br />
16.2 16.7 16.7 18.1 18.4<br />
CVS<br />
GI<br />
Respiratory<br />
Pain/Analgesic<br />
Gynaecology<br />
Dermatology<br />
CVS<br />
GI<br />
Respiratory<br />
Pain/Analgesic<br />
Gynaecology<br />
Dermatology<br />
* Average growth over 2009-2010 Source: Industry/MOSL<br />
In terms of the number of prescriptions written, Cadila ranks second in the GI segment<br />
with a prescription market share of 4.5%. It ranks third in the respiratory segment with<br />
market share of 4.9% and seventh in the CVS segment with a prescription market share<br />
of 4.5%. Cadila has improved its ranking in the gynecology and respiratory segments and<br />
its ranking in CVS deteriorated a bit.<br />
Cadila's prescription ranking<br />
Jan-07 Jan-08 Jan-09 Jan-10 Oct-10<br />
GI 1.0 2.0 2.0 2.0 2.0<br />
Gynaec 3.0 3.0 1.0 2.0 2.0<br />
Respiratory 2.0 2.0 1.0 2.0 2.0<br />
CVS 3.0 3.0 5.0 7.0 6.0<br />
Pain Mgmt - - 24.0 24.0 20.0<br />
Source: Industry/MOSL<br />
Top 10 brands contribute 30% of revenue<br />
Cadila's top 10 brands contribute ~30% to total revenue, indicating lower brand<br />
concentration. Its No1 brand, Aten (Atnolol, CVS), ranks thirty-seventh in the industry<br />
and it reported 12.5% CAGR over the past four years. Six of the top 10 brands posted<br />
CAGR in double digits over the past four years.<br />
August 2011 95
Cadila<br />
Cadila's top 10 brands<br />
Brand Drug Product Launch Sales (INR m) YoY Gr (%) CAGR (%)<br />
Aten Atenolol 1993 865 19.2 12.5<br />
Atorva Atorvastatin 2000 585 16.2 19.5<br />
Ocid Omeprazole 1991 517 6.6 10.2<br />
Falcigo Artesunate 1996 484 10.7 30.6<br />
Deriphyllin Etophylline+Theophylline 1981 637 8.4 2.9<br />
Primolut-n Norethisterone 1969 432 5.3 4.1<br />
Amlodac Amlodipine 1995 379 16.1 8.4<br />
Dulcolax Bisacodyl 1983 352 18.7 11.5<br />
Mifegest Mifepriston 2002 346 -5.7 1.6<br />
Pantodac Pantoprazole 1999 456 13.0 11.3<br />
CAGR through 2006-10<br />
Source: Industry/MOSL<br />
3. Distribution and reach: 7/10<br />
Cadila derives 65% of its revenue from metros and class-I towns compared with 63% of<br />
the industry average. In the past four years, revenue CAGR for all geographies except<br />
metros were in line or marginally better than that of the industry average.<br />
Cadila: Geographical distribution of revenues (%) Industry: Geographical distribution of revenues (%)<br />
METROS CLASS I TOWNS CLASS II TO VI RURA L<br />
18.3 18.5 18.1 16.5 15.9<br />
18.7 18.5 18.9 18.8 19.1<br />
32.5 30.5 31.3 32.4 32.4<br />
METROS CLASS I TOWNS CLASS II TO VI RURAL<br />
20.6 20.9 20.0 18.1 17.3<br />
19.2 19.0 19.5 19.4 19.6<br />
32.6 31.3 31.6 32.5 32.0<br />
30.5 32.4 31.8 32.2 32.7<br />
27.6 28.9 28.9 30.0 31.0<br />
CY 06 CY07 CY08 CY09 CY10<br />
CY06 CY07 CY08 CY09 CY10<br />
Cadila: geography-wise growth rates (%) Industry: geography-wise growth rates (%)<br />
Metros Clas s I Tow ns Class II to VI Rural<br />
25.9<br />
24.4<br />
18.2<br />
19.0<br />
25.9<br />
24.0<br />
19.3<br />
15.6<br />
11.3<br />
16.3<br />
10.0<br />
10.8<br />
14.5<br />
6.5<br />
5.8<br />
5.0<br />
CY07 CY08 CY09 CY10<br />
Metros Class I Tow ns Clas s II to VI Rural<br />
26.2<br />
23.5<br />
17.6<br />
20.7<br />
17.5<br />
17.7<br />
15.6<br />
17.5<br />
14.0<br />
16.4<br />
11.1<br />
14.7<br />
13.0<br />
7.9<br />
9.5<br />
2.5<br />
CY07 CY08 CY09 CY10<br />
Source: Industry/MOSL<br />
August 2011 96
Cadila<br />
4. Introductions: 5/10<br />
Cadila's growth over the past four years has been led by existing products<br />
and new launches<br />
Over the past four years Cadila launched 49 new products (including line extensions)<br />
annually which is in line with its peers. Average revenue per new launches has grown<br />
from INR42m in CY07 to INR94m in CY10. Cadila's revenue growth is driven by existing<br />
products and new launches.<br />
Cadila - new launches Cadila growth compositions (%)<br />
No. Of launches in last 2 yrs<br />
Avg sales per launch (INR m)<br />
94.4<br />
<strong>New</strong> Launches<br />
Existing Brands<br />
75.6<br />
74.4<br />
41.7<br />
90 84 101 113<br />
13.0<br />
4.0<br />
16.5<br />
8.5<br />
2.9<br />
5.7 6.2 7.7<br />
CY07 CY08 CY09 CY10<br />
CY07 CY08 CY09 CY10<br />
Source: Industry/MOSL<br />
5. CAGR and scale up: 6/10<br />
We expect 13-14% CAGR for Cadila's domestic formulations business led by existing<br />
products, increasing geographical penetration and incremental contribution from new<br />
launches. This is below our estimated forecast of 15-16% CAGR for the industry. Outperformance<br />
of the industry seems difficult due to a lower prescription share in highgrowth<br />
lifestyle segments and the anti-infective segment. It's absence in fast growing<br />
lifestyle segments except CVS, will make it difficult for it to outpace industry growth. Its<br />
focus on improving workforce productivity needs to be enhanced for it to grow its business<br />
more profitably.<br />
Cadila - domestic formulations performance<br />
DF Revenues (INR m) YoY Growth (%)<br />
18.6<br />
15.4<br />
8.3<br />
10.9<br />
9.6<br />
12.2<br />
12.8<br />
14.7<br />
9,793<br />
10,603<br />
11,763<br />
12,889<br />
14,458<br />
17,146<br />
19,347<br />
22,197<br />
FY06 FY07 FY08 FY09 FY10 FY11 FY12E FY13E<br />
Source: Company/MOSL<br />
August 2011 97
Cadila<br />
6. Improvement in MR productivity: 5/10<br />
Cadila's top-line growth is driven by sales force additions; fares poorly<br />
when compared with the industry productivity<br />
Cadila's domestic formulations business revenue posted 9.2% CAGR over FY04-10 and<br />
its sales force posted 11.3% CAGR, implying negative productivity of the workforce. In<br />
2004, Cadila derived sales of INR4.1m per MR, which fell to INR3.6m in FY10. Cadila's<br />
performance was below average, compared with the average of performances covered<br />
in the report.<br />
Cadila - Sales force productivity (2004-10)<br />
No. of MRs Rev enue per MR (INR m)<br />
4.1<br />
Sales force addition CAGR (%)<br />
Productivity Improv ement CAGR (%)<br />
4,000<br />
11.3<br />
11.5<br />
2,100<br />
3.6<br />
-1.9<br />
1.9<br />
2004 2010<br />
Cadila<br />
Indus try<br />
Source: Industry/Company/MOSL<br />
7. Non-domestic business — Snapshot: 6/10<br />
Non-domestic business: Snapshot<br />
Positives<br />
• Expanding presence in emerging and regulated markets through a mix of its own<br />
presence and front-end acquisitions.<br />
• Strong chemistry skills and fully backward integrated low-cost operations help in making<br />
the US business viable despite being a late entrant.<br />
• Low-risk strategy to access international markets through its own presence and<br />
partnerships.<br />
• Supplies of injectables to Hospira to ramp-up in the next 1-2 years while the Abbott<br />
tie-up for emerging markets is likely to contribute from FY13 onwards.<br />
Risks and concerns<br />
• Needs to build a differentiated portfolio in the US to access low-competition<br />
opportunities. The company has initiated steps in this directions.<br />
• NCE research yet to deliver desired returns for investors.<br />
• Slow progress in accessing the Japanese generic opportunity.<br />
<strong>New</strong>s flow/triggers<br />
• Ramp-up in supplies to Hospira and Abbott.<br />
• Signing of supply agreements with MNCs.<br />
August 2011 98
Cadila<br />
Impact assessment<br />
• We are positive on Cadila's international business given its strong chemistry skills and<br />
pragmatic mix of own presence and partnerships.<br />
• Cautious approach to establishing an international presence has ensured sustained<br />
higher return ratios for investors.<br />
• Has a good track record of forging partnerships with global players.<br />
• Expect 16% CAGR for the international business over FY11-13 led by 18.3% CAGR<br />
for formulation exports.<br />
Sales mix (INR M)<br />
FY09 FY10 FY11 FY12E FY13E FY11-13<br />
CAGR (%)<br />
Domestic Sales<br />
Formulations 12,889 14,458 17,146 19,347 22,197 13.8<br />
APIs 426 318 352 317 348 -0.5<br />
Consumer & Others 3,120 3,948 4,827 5,458 6,372 14.9<br />
Gross Domestic sales16,435 18,724 22,325 25,121 28,917 13.8<br />
% to sales 56.3 51.8 49.4 49.5 48.6<br />
Export Formulations 9,676 14,018 19,214 22,170 26,838 18.2<br />
Export APIs 3,060 3,400 3,672 3,472 3,712 0.5<br />
Total Exports 12,736 17,418 22,886 25,642 30,550 15.5<br />
% to sales 43.7 48.2 50.6 50.5 51.4<br />
Gross Sales 29,172 36,142 45,211 50,763 59,467 14.7<br />
Note:Estimates exclude Nesher acquisition pending availability of more details from<br />
Cadila management.<br />
EBITDA Contribution<br />
Non-DF<br />
EBITDA<br />
55%<br />
DF<br />
EBITDA<br />
45%<br />
Source: Company/MOSL<br />
8-9. Earnings growth and stock attractiveness: 18/30<br />
Cadila's growth will be led by increased traction in its international businesses, ramp-up in<br />
supplies to Hospira and sustained double-digit growth in domestic formulations and consumer<br />
businesses. We estimate 15% revenue and EPS CAGR for FY11-13 for core operations<br />
excluding one-offs and RoE of 27-28% over the next two years. Sustaining double-digit<br />
growth without diluting return ratios has been the company's USP and has led to a significant<br />
re-rating of the stock.<br />
We believe that this track record would be subjected to many challenges, as Cadila tries to<br />
aggressively scale-up to achieve its revenue target of USD3b by FY16. This target implies<br />
a topline CAGR of 25% for FY11-16, which we believe is very aggressive. The company<br />
will have to invest significant resources to achieve this target, which can raise its risk<br />
profile.<br />
Given the disappointing core performance for the last two quarters and likely impact of<br />
the Nesher acquisition, the strong earnings upgrade cycle of the past two years could<br />
break. Cadila trades at 29.1x FY12E and 20.0x FY13E consolidated EPS. We believe that<br />
valuations are rich and leave little scope for further re-rating. We maintain Neutral. Our<br />
target price is INR907 (22x FY13E EPS + INR3/share DCF value of earnings from<br />
Taxotere).<br />
August 2011 99
Cadila<br />
Cadila RoE & RoCE (%)<br />
Cadila one year forward P/E<br />
35.4<br />
RoE<br />
37.5<br />
RoCE<br />
35<br />
28<br />
P/E (x) Avg(x) Peak(x ) Min(x )<br />
30.2<br />
26.7 26.9<br />
23.1 23.6<br />
26.4<br />
30.5<br />
27.3 27.6<br />
25.4<br />
27.2<br />
22<br />
15<br />
9<br />
2<br />
15.8<br />
6.5<br />
24.6<br />
2008 2009 2010 2011 2012E 2013E<br />
Aug-06<br />
Mar-07<br />
Aug-07<br />
Feb-08<br />
Aug-08<br />
Feb-09<br />
Aug-09<br />
Feb-10<br />
Aug-10<br />
Feb-11<br />
Aug-11<br />
Annexure: Cadila non-domestic business<br />
<strong>New</strong> launches to drive growth in the US<br />
Cadila has a pipeline of 65 ANDAs pending approval and has received 65 ANDA approvals<br />
so far (including tentative approvals). The company filed 24 ANDAs in FY11 and launched<br />
11 products in the US. It expects to file 15-20 ANDAs with the US FDA every year and<br />
get about 8-10 approvals a year. Cadila's US business is witnessing increased traction due<br />
to the absence of some of the competitors (due to US FDA issues) and new product<br />
launches. The company is also improving its market share in already launched products.<br />
We expect Cadila to post sales of INR11.9b in FY12 against INR9.7b in FY11. We expect<br />
this business to grow by 20% CAGR over FY11-13. Cadila has also commenced development<br />
and filing of potential low-competition products with delivery advantages (trans-dermal<br />
patches and respiratory products) and is focusing on developing a pipeline of such niche<br />
products (likely to be commercialized after FY12).<br />
Nesher acquisition - long-term positive, but may pressurize P&L in short<br />
term<br />
Cadila recently entered into an agreement to acquire certain assets and liabilities of Nesher<br />
Pharma in the US (a subsidiary of KV Pharma) for ~USD60m. It has acquired Nesher's<br />
existing and future product pipeline, its manufacturing facility and R&D lab. Cadila will<br />
also take over certain liabilities. The transaction is likely to close by August/September<br />
2011 and Cadila will be consolidating Nesher's financials with effect from August/<br />
September.<br />
With this acquisition, Cadila gets access to Nesher's controlled substances pipeline (besides<br />
other products) as well as access to its manufacturing facility for these controlled substances.<br />
Nesher's ANDA pipeline includes 8 filings and another 5 products under development,<br />
which address a potential on-patent market of USD2.1b. We note that given the possibility<br />
of controlled substances being abused as drugs, the US government has put stringent rules<br />
in place for monitoring the manufacturing and sale of such products. This includes a prerequirement<br />
of a local manufacturing facility with DEA license to manufacture and supply<br />
such products in the US. Through the Nesher acquisition, Cadila gets access to a DEAlicensed<br />
facility.<br />
August 2011 100
Cadila<br />
Given the entry barriers, we believe that the controlled substances market will be a lowcompetition<br />
market for generics players. Currently, Nesher is making net losses, which<br />
may pressurize Cadila's P&L till it is able to turn around Nesher's operations. Cadila<br />
management has guided that Nesher is likely to contribute ~USD15m in revenue for<br />
FY12. It expects Nesher to report a minor net loss for FY12 and a positive bottomline for<br />
FY13. We are awaiting further clarity from Cadila on the plans for achieving this turnaround.<br />
We also note that Cadila management has a track record of being conservative in its<br />
inorganic initiatives and has not made any acquisitions in the past which have diluted the<br />
return ratios for investors.<br />
Hospira supplies to ramp up in FY12 led by Taxotere, new launches<br />
Cadila's supplies to Hospira commenced in FY10, recording INR839m in revenues for<br />
supplies to Europe. It posted FY11 revenue of INR2.15b led by the launch of exclusivity<br />
product generic Taxotere in the US. We expect a ramp-up in this business in FY11 led by<br />
commercialization of more products and revenue from limited competition product Taxotere<br />
for some more time. We expect FY12 revenue of INR803m to Cadila from Taxotere.<br />
However we have not included it in our FY12 estimates. We are valuing the upside based<br />
on the DCF method (INR3/share) since this is a limited period opportunity.<br />
French operations to record 14% CAGR<br />
While Cadila's French operations are completely aligned to a low-cost generic market, we<br />
expect only 14% CAGR for this business over FY11-13 driven mainly by the slow market<br />
growth.<br />
Emerging market revenue to grow by double-digits<br />
Among emerging markets, Cadila is present mainly in Latin America. We expect Cadila's<br />
emerging market revenue to record 17% CAGR over FY11-13 driven by new launches<br />
and favorable demographics.<br />
Abbott tie-up: Supplies to start from FY13<br />
In FY10, Cadila entered into a supply agreement with Abbott to supply 24 branded generic<br />
products to meet Abbott's requirements in 15 emerging markets (names not disclosed).<br />
The agreement also includes an option for 40 additional products to be included over the<br />
term of the collaboration.<br />
Cadila will make the products at its facilities in India. The products selected fall in categories<br />
of pain, cancer, CVS, neurology and respiratory illnesses. Product names have not been<br />
disclosed.<br />
The supplies will enable Cadila to capture a part of the upsides in some emerging markets<br />
where it does not have a presence. We believe this is a long-term positive for Cadila, given<br />
the possibility that such arrangements tend to include a larger product basket over time.<br />
We expect the supplies to start from FY13.<br />
August 2011 101
Cadila<br />
Financials and valuations : Cadila<br />
Income Statement<br />
(INR Million)<br />
Y/E March 2010 2011 2012E 2013E<br />
Net Sales 36,868 46,302 51,717 59,983<br />
Change (%) 25.9 25.6 11.7 16.0<br />
Total Expenditure 28,863 36,040 41,427 47,500<br />
EBITDA 8,006 10,262 10,291 12,483<br />
Margin (%) 21.7 22.2 19.9 20.8<br />
Depreciation 1,339 1,269 1,569 1,779<br />
EBIT 6,667 8,993 8,721 10,704<br />
Int. and Finance Charges 821 699 731 650<br />
Other Income - Rec. 159 131 207 272<br />
PBT before EO Expense 6,004 8,425 8,197 10,326<br />
Extra Ordinary Exp./(Inc.) 46 0 0 0<br />
PBT after EO Expense 5,958 8,425 8,197 10,326<br />
Current Tax 741 1,064 1,230 1,549<br />
Tax 741 1,064 1,230 1,549<br />
Tax Rate (%) 12.4 12.6 15.0 15.0<br />
Reported PAT 5,217 7,361 6,968 8,777<br />
Less: Mionrity Interest 247 251 301 358<br />
Net Profit 4,970 7,110 6,667 8,419<br />
PAT Adj for EO Items 5,011 6,334 5,801 8,419<br />
Balance Sheet<br />
(INR Million)<br />
Y/E March 2010 2011 2012E 2013E<br />
Equity Share Capital 682 1,024 1,024 1,024<br />
Total Reserves 15,501 20,691 26,154 32,841<br />
Net Worth 16,183 21,715 27,178 33,865<br />
Minority Interest 392 669 0 0<br />
Deferred liabilities 1141 1127 1127 1127<br />
Total Loans 10,905 10,973 10,442 9,286<br />
Capital Employed 28,621 34,484 38,748 44,290<br />
Gross Block 25,578 28,320 33,320 36,320<br />
Less: Accum. Deprn. 8,734 9,994 11,563 13,342<br />
Net Fixed Assets 16,844 18,326 21,757 22,978<br />
Capital WIP 2,482 4,310 4,310 4,310<br />
Investments 207 207 207 207<br />
Curr. Assets 17,749 22,829 26,084 33,719<br />
Inventory 7,504 8,119 10,025 12,924<br />
Account Receivables 4,668 7,652 9,524 12,337<br />
Cash and Bank Balance 2,507 2,952 1,773 2,877<br />
Loans & Advances 3,070 4,106 4,762 5,581<br />
Curr. Liability & Prov. 8,661 11,188 13,611 16,937<br />
Account Payables 6,710 8,955 10,777 13,218<br />
Provisions 1,951 2,233 2,834 3,719<br />
Net Current Assets 9,088 11,641 12,473 16,782<br />
Appl. of Funds 28,621 34,484 38,746 44,290<br />
E: MOSL Estimates<br />
Ratios<br />
Y/E March 2010 2011 2012E 2013E<br />
Basic (INR)<br />
EPS 24.5 30.9 28.3 41.1<br />
Cash EPS 30.8 40.9 40.2 49.8<br />
BV/Share 79.0 106.1 132.7 165.4<br />
DPS 5.0 6.3 6.3 8.7<br />
Payout (%) 23.7 20.8 21.6 23.8<br />
Valuation (x)<br />
P/E 33.7 26.6 29.1 20.0<br />
Cash P/E 26.7 20.1 20.5 16.5<br />
P/BV 10.4 7.8 6.2 5.0<br />
EV/Sales 4.8 3.8 3.4 2.9<br />
EV/EBITDA 22.1 17.2 17.2 14.0<br />
Dividend Yield (%) 0.6 0.8 0.8 1.1<br />
Return Ratios (%)<br />
RoE 35.4 37.5 27.3 27.6<br />
RoCE 26.4 30.5 25.4 27.2<br />
Working Capital Ratios<br />
Fixed Asset Turnover (x) 2.3 2.6 2.6 2.7<br />
Debtor (Days) 46 60 66 74<br />
Inventory (Days) 74 64 71 79<br />
Working Cap. Turnover (Days) 65 68 76 85<br />
Leverage Ratio (x)<br />
Current Ratio 2.0 2.0 1.9 2.0<br />
Debt/Equity 0.5 0.4 0.3 0.2<br />
* Ratios adjusted for bonus issue<br />
Cash Flow Statement<br />
(INR Million)<br />
Y/E March 2010 2011 2012E 2013E<br />
Oper. Profit/(Loss) bef. Tax 8,006 10,262 10,291 12,483<br />
Interest/Dividends Recd. 159 131 207 272<br />
Direct Taxes Paid -741 -1,064 -1,230 -1,549<br />
(Inc)/Dec in WC -402 -2,108 -2,011 -3,206<br />
CF from Operations 7,022 7,222 7,257 8,000<br />
CF from Oper. incl EO Exp. 6,976 7,222 7,257 8,000<br />
(inc)/dec in FA -3,478 -4,579 -5,000 -3,000<br />
(Pur)/Sale of Investments 42 0 0 0<br />
CF from Investments -3,436 -4,579 -5,000 -3,000<br />
Change in Networth 289 -301 0 0<br />
Inc/(Dec) in Debt -1,605 345 -1,200 -1,156<br />
Interest Paid -821 -699 -731 -650<br />
Dividend Paid -1,237 -1,529 -1,505 -2,090<br />
Others -175 -14<br />
CF from Fin. Activity -3,550 -2,198 -3,436 -3,896<br />
Inc/Dec of Cash -10 445 -1,179 1,105<br />
Add: Beginning Balance 2,517 2,507 2,952 1,773<br />
Closing Balance 2,507 2,952 1,773 2,878<br />
August 2011 102
Domestic Formulations | <strong>New</strong> Peaks<br />
This page is<br />
left blank<br />
intentionally<br />
August 2011 103
Domestic Formulations | <strong>New</strong> Peaks<br />
MEDICINES<br />
MEDICINES CAPSULE Score<br />
49/100<br />
Sayonara, unless ...<br />
Ranbaxy<br />
CMP: INR468<br />
RBXY IN<br />
TP: INR412 Sell<br />
M: Mix 6/10<br />
Ranbaxy operates mainly in acute therapeutic<br />
segments, deriving 76% of its revenue from the<br />
segment. It is yet to strengthen its presence in the<br />
chronic segment.<br />
Ranbaxy is a dominant player in large therapy<br />
segments like AI, CVS and pain management. The<br />
segments, along with the sex stimulant segment,<br />
contribute ~68% to Ranbaxy's domestic<br />
formulations revenue.<br />
E: Equity with doctors 5/10<br />
Ranbaxy enjoys low brand equity with doctors<br />
except in the AI and dermatology segments. Some<br />
of its brands like Storvas have good brand equity in<br />
the CVS segment.<br />
Ranbaxy is ranked at No3 position in the AI<br />
segment with a prescription market share of 7.8%<br />
and it ranks No4 in the dermatology segment with<br />
a prescription market share of 5.4%.<br />
Over the past five years, Ranbaxy's brand equity<br />
has taken a beating in almost all therapy areas.<br />
D: Distribution & reach 7/10<br />
Ranbaxy derives 66% of its revenues from metros<br />
and tier-I cities.<br />
Distribution reach in metros has increased over<br />
time but the contribution of rural geographies to<br />
revenue has fallen over the past four years.<br />
Ranbaxy's field force has been recently expanded<br />
by 50% to 4,500 MRs.<br />
I: Introductions 5/10<br />
Ranbaxy has been aggressive in launching new<br />
products over the past four years compared with<br />
its peers. It launched 65 products (including line<br />
extensions) a year over the past four years.<br />
Revenue growth has been driven by existing<br />
products and new launches.<br />
Stock info<br />
Equity Shares (m) 420.4<br />
52-Week Range (INR) 625/414<br />
1,6,12 Rel. Perf. (%) 0/6/6<br />
M.Cap. (INR b) 196.8<br />
M.Cap. (USD b) 4.3<br />
Financial & valuation summary<br />
Year Net Sales PAT EPS EPS P/E P/BV RoE RoCE EV/ EV/<br />
End (INR m) (INR m) (INR ) Gr. (%) (x) (x) (%) (%) Sales EBITDA<br />
12/09A 75,970 1,911 4.5 -38.2 - - 4.4 9.8 - -<br />
12/10A 89,608 10,855 25.8 467.1 15.2 2.9 19.4 15.9 2.3 11.1<br />
12/11E 85,242 4,991 11.9 -54.0 33.0 2.7 11.4 10.7 2.4 23.0<br />
12/12E 93,005 7,052 16.7 41.3 23.3 2.4 10.4 11.1 2.2 18.5<br />
Background<br />
Ranbaxy is a leading global generic company with global revenues of over USD1.9b. The company has<br />
established a direct presence across the world in key markets like US, UK, Germany, France, Brazil and<br />
other emerging markets. Around 40% of its revenues come from the developed markets of the US and<br />
Europe while emerging markets contribute about 50-55% of revenues.<br />
August 2011 104
Ranbaxy<br />
CEO Profile<br />
CEO<br />
Ranbaxy is currently a 64% subsidiary of Daiichi Sankyo (Japan). It is being currently managed by a team<br />
of professionals headed by Mr. Arun Sawhney (MD). Establishing a global generics business and a<br />
leading position in India, coupled with one of the strongest pipeline of First-to-File opportunities in the US<br />
is the key achievement of the company.<br />
C: CAGR and scale-up 6/10<br />
Ranbaxy posted revenue CAGR of 10.2% in the<br />
domestic formulations market over CY04-10,<br />
underperforming market's growth.<br />
We expect CAGR of 14% for Ranbaxy's domestic<br />
formulations business led by its recent field-force<br />
expansion and rapid new launches. This slightly<br />
lower than our forecast CAGR of 15-16% for the<br />
industry.<br />
I: Improvement in productivity 3/10<br />
Ranbaxy's domestic formulation revenue posted<br />
10.2% CAGR and its sales force posted 15%<br />
CAGR over 2004-10 implying negative MR<br />
productivity.<br />
The current productivity of INR3.6m per MR is in<br />
line with the industry average.<br />
Ranbaxy is likely to maintain its leading position<br />
in the sector given its strong position and market<br />
share in some of the largest therapeutic segments.<br />
N: Non-domestic business 5/10<br />
We are neutral on Ranbaxy's international<br />
business despite its strong presence in the US<br />
and in emerging markets due to ongoing US FDA<br />
issues and moderate profitability of its international<br />
operations.<br />
We expect the international business to post 13%<br />
CAGR over CY10-12 excluding low-competition and<br />
Para-IV products in the US.<br />
E: Earnings growth 3/10<br />
We expect overall core top-line CAGR of 14.4%<br />
over CY10-12, leading to EPS CAGR of 53%, albeit<br />
on a very low base.<br />
Cost reductions leading to improved profitability and<br />
gradual recovery in the US business will be key<br />
growth drivers.<br />
Option values (Para-IV products) will make a onetime<br />
contribution to PAT of INR38.2b over CY11-<br />
14, leading to DCF value of INR77/share.<br />
S: Stock Attractiveness 9/20<br />
Aggressive international expansion, high cost<br />
acquisitions and on-going US FDA issues have<br />
adversely impacted overall return ratios. While we<br />
expect some improvement in return ratios by CY12,<br />
they will still remain sub-optimal.<br />
Ranbaxy is valued at 33.0x CY11E and 23.3x<br />
CY12E consolidated earnings. Reiterate Sell with<br />
a target price of INR412 (20x CY12E EPS)<br />
excluding Para-IV upsides.<br />
Stock performance (1 year)<br />
Ranbaxy Labs Sensex - Rebased<br />
640<br />
580<br />
520<br />
460<br />
400<br />
Aug-10 Nov-10 Feb-11 May-11 Aug-11<br />
August 2011 105
Ranbaxy<br />
India formulations<br />
snapshot<br />
Domestic formulations -<br />
significant PAT contribution<br />
The domestic formulations<br />
business is a leading<br />
contributor to Ranbaxy's<br />
revenue and contributes ~98%<br />
to its EBITDA excluding one off<br />
upsides. Ranbaxy has been<br />
posting large losses in its core<br />
US business because of<br />
ongoing US FDA issues.<br />
EBITDA Contribution<br />
Non-DF EBITDA, 2%<br />
Sayonara, unless ...<br />
Key challenges are resolved at the earliest<br />
Ranbaxy is the second largest Indian company by revenue in the domestic formulations<br />
space after Cipla and ranks third in the overall ranking. Ranbaxy's strength lies in its strength<br />
in the acute therapeutic segments. However, it has underperformed the market over the<br />
past four years and has been losing market share.<br />
1. Mix: 6/10<br />
AI, CVS, pain management dominate sales<br />
The top four therapeutic segments including AI, CVS, pain management and sex stimulants<br />
contribute ~68% to Ranbaxy's domestic formulations revenue. Ranbaxy is among the<br />
market leaders in three of the largest therapy segments, AI, CVS and pain management.<br />
Ranbaxy derives ~76% of its revenue from acute therapies. Ranbaxy's dependence on<br />
the AI segment has fallen over the past 10 years while the contribution of CVS, pain and<br />
GI improved over the years.<br />
The second largest Indian<br />
player in the industry<br />
Ranbaxy has consistently<br />
ranked among the top three<br />
players in the industry due to<br />
its strong presence in two of<br />
the largest therapeutic<br />
segments in the industry.<br />
Ranbaxy holds 4.69% market<br />
share, which has fallen from<br />
5.1% in 2006. The company<br />
grew its business at 10.2%<br />
CAGR over the past six years<br />
while the industry posted 14%<br />
CAGR. This under<br />
performances can be<br />
attributed to the fact that<br />
Ranbaxy derives most of its<br />
revenue from highly<br />
competitive acute therapeutic<br />
segment.<br />
Ranbaxy is among top three<br />
players in the industry<br />
Mkt Share (%)<br />
Grow th (%)<br />
21.4<br />
17.0<br />
14.6<br />
7.8 7.1<br />
5.09<br />
DF EBITDA, 98%<br />
5.02<br />
5.2<br />
4.97<br />
4.69<br />
Ranbaxy: Therapeutic mix<br />
Respira<br />
tory<br />
2%<br />
CNS<br />
5%<br />
Derma<br />
3%<br />
GI<br />
4%<br />
Vitamins<br />
14%<br />
Pain<br />
8%<br />
CY 2000<br />
Others<br />
7%<br />
CVS<br />
6%<br />
AI<br />
51%<br />
CNS 4%<br />
GI 7%<br />
Respirat<br />
ory 4%<br />
Derma<br />
8%<br />
Sex<br />
stimulants<br />
9%<br />
March 2011<br />
Diabetes<br />
2%<br />
Pain<br />
11%<br />
Others<br />
7%<br />
CVS<br />
13%<br />
AI 35%<br />
Source: Company/Industry/MOSL<br />
2. Equity with doctors: 5/10<br />
Good brand equity in AI, CVS, pain management, dermatology segments<br />
Ranbaxy has been a dominant player in three of the largest therapeutic segments of the<br />
industry, AI, CVS and pain management. Ranbaxy ranks first in AI, with market share of<br />
10.8%, it ranks sixth in the CVS segment with market share of 5.8%, second in the pain<br />
management segment with market share of 7% and third in the dermatology segment with<br />
market share of 8.9%. However Ranbaxy's growth has been sluggish compared with the<br />
segments' growth over the past two years.<br />
2006 2007 2008 2009 2010<br />
August 2011 106
Ranbaxy<br />
Market share in key therapies (%) Growth comparison (%) (2010)<br />
10.8<br />
5.8<br />
3.6<br />
7<br />
8.9<br />
3.8<br />
14.6<br />
9.0<br />
Avg Gr - Company<br />
17.9<br />
17.1<br />
13.8<br />
12.8<br />
Avg Gr - Industry<br />
20.0<br />
18.4<br />
16.7<br />
10.9<br />
7.6<br />
18.7<br />
AI<br />
CVS<br />
GI<br />
Pain/Analgesic<br />
Dermatology<br />
CNS<br />
AI<br />
CVS<br />
GI<br />
Pain/Analgesic<br />
Dermatology<br />
CNS<br />
* Average growth over 2009-2010 Source: Industry/MOSL<br />
In terms of the number of prescriptions written, Ranbaxy's brand equity with physicians is<br />
high only in the AI and dermatology segments. Ranbaxy is ranked third in the AI segment<br />
with a prescription market share of 7.8% and it ranks fourth in the dermatology segment<br />
with a prescription market share of 5.4%. Over the past five years, Ranbaxy's brand<br />
equity has taken a beating in almost all therapy areas.<br />
Ranbaxy's prescription ranking<br />
Jan-07 Jan-08 Jan-09 Jan-10 Oct-10<br />
Anti-infectives 2 2 3 2 3<br />
Derma 3 3 3 4 4<br />
GI 12 13 9 14 14<br />
CNS 11 11 11 14 14<br />
Pain Mgmt 12 13 13 13 14<br />
CVS 13 15 13 17 15<br />
Anti-diabetic 10 12 11 15 16<br />
Respiratory 15 12 17 18 19<br />
Source: Industry/MOSL<br />
Top 10 brands contribute 40% of the revenues<br />
Ranbaxy's top 10 brands contribute ~40% to its revenue and they feature among the<br />
industry's top 300 brands. Its No1 brand Revital (Vitamins) ranks sixth in the industry and<br />
it posted revenue CAGR of 30% over 2006-10. Most of Ranbaxy's top 10 brands recorded<br />
double-digit CAGR over the past four years.<br />
Ranbaxy's top 10 brands<br />
Brand Drug Product Launch Sales (INR m) YoY Gr (%) CAGR (%)<br />
Revital Ginseng products 1989 1,607 29.4 30.4<br />
Mox Amoxycillin 1997 1,346 14.6 15.3<br />
Storvas Atorvastatin 1999 996 13.4 22.3<br />
Volini Nsaids 1994 924 36.0 33.2<br />
Cifran Ciprofloxacin injectables 1989 863 -1.6 2.4<br />
Sporidex Cephalexin 1980 904 5.0 5.1<br />
Zanocin Ofloxacin 1990 660 4.1 9.0<br />
Cepodem Cefpodoxime 1999 646 17.4 20.9<br />
Rosuvas Rosuvastatin 2003 346 57.4 56.1<br />
Fortwin Injectables 1975 341 26.0 26.2<br />
CAGR through 2006-10<br />
Source: Industry/MOSL<br />
August 2011 107
Ranbaxy<br />
3. Distribution & reach: 7/10<br />
Ranbaxy derives 66% of its revenue from the metros and class-I towns, compared with<br />
63% of the industry average. Over the past four years, revenue CAGR for all geographies<br />
has been below the industry average. The contribution of metros to revenue has risen<br />
over the past five years, in line with the industry trend.<br />
Ranbaxy: Geographical distribution of revenues (%) Geographical distribution of revenues: Industry (%)<br />
Metros Class I Tow ns Class II to VI Rural<br />
19.6 19.6 18.6 16.3 16.0<br />
17.9 17.1 17.7 17.7 17.7<br />
31.6 30.9 30.0 30.4 30.3<br />
Metros Class I Tow ns Class II to VI Rural<br />
20.6 20.9 20.0 18.1 17.3<br />
19.2 19.0 19.5 19.4 19.6<br />
32.6 31.3 31.6 32.5 32.0<br />
30.9 32.3 33.7 35.6 36.1<br />
27.6 28.9 28.9 30.0 31.0<br />
CY06 CY07 CY08 CY09 CY10<br />
Ranbaxy: Geography-wise growth rates (%)<br />
CY06 CY07 CY08 CY09 CY10<br />
Geography-wise growth rates<br />
Metros Class I Tow ns Class II to VI Rural<br />
21.5 21.8<br />
13.4<br />
16.0<br />
12.7<br />
13.6<br />
14.2<br />
8.0<br />
8.2<br />
14.2<br />
10.7<br />
5.5<br />
12.4<br />
7.1<br />
3.1<br />
-6.0<br />
17.6<br />
14.0<br />
11.1<br />
7.9<br />
Metros<br />
Class II to VI<br />
17.5<br />
15.6<br />
14.7<br />
9.5<br />
Class I Tow ns<br />
Rural<br />
17.7<br />
16.4<br />
13.0<br />
2.5<br />
26.2<br />
23.5<br />
20.7<br />
17.5<br />
CY07 CY08 CY09 CY10<br />
CY07 CY08 CY09 CY10<br />
Source: Industry/MOSL<br />
4. Introductions: 5/10<br />
Ranbaxy has been one of the most aggressive players in the industry in<br />
launching new products<br />
Ranbaxy has aggressively launched new products over the past four years. It launched 65<br />
new products (including line extensions) annually over the past four years. However, the<br />
average revenue per new launch has declined from INR94m in CY07 to INR60m in<br />
CY10. Revenue growth is driven by existing products and new launches.<br />
Ranbaxy: <strong>New</strong> launches (INR m) Ranbaxy: Growth composition (%)<br />
94.0<br />
No. Of launches in last 2yrs<br />
Avg sales per launch (INR m)<br />
92.4<br />
73.1<br />
60.5<br />
104 104 114 154<br />
<strong>New</strong> Launches<br />
10.6<br />
0.8<br />
7.0 6.4<br />
Existing Brands<br />
9.6<br />
2.4<br />
4.8 5.0<br />
CY07 CY08 CY09 CY10<br />
CY07 CY08 CY09 CY10<br />
Source: Industry/MOSL<br />
August 2011 108
Ranbaxy<br />
5. CAGR amd scale-up: 5/10<br />
We expect Ranbaxy's domestic formulations revenue to post 14% CAGR over CY10-12,<br />
led by a large field force and rapid new launches. This is lower than our forecast of 15-<br />
16% CAGR for the industry. Ranbaxy is likely to maintain its leading position in the sector<br />
given its strong position and market share in some of the largest therapeutic segments.<br />
Though Ranbaxy employs one of the largest field forces in the industry the company's<br />
focus on improving productivity of the salesforce needs to be enhanced for it to grow the<br />
business more profitably.<br />
Ranbaxy: Domestic formulations revenue ramp-up<br />
Source: Company/MOSL<br />
6. Improvement in MR productivity: 3/10<br />
Top-line growth driven by sale force additions; MR productivity declines<br />
Ranbaxy's domestic formulations revenue posted 10.2% CAGR over FY04-10 and its<br />
sales force posted 15% CAGR, implying negative productivity of the salesforce. In CY04<br />
Ranbaxy derived INR4.6m revenue per MR, which fell to INR3.6m in CY10. This is<br />
partially attributed to recent additions to the sale force.<br />
Sales force productivity<br />
No. of MR Revenue per MR (INR m)<br />
4.6<br />
4,500<br />
3.6<br />
1,950<br />
2004 2010<br />
Source: Company/Industry/MOSL<br />
August 2011 109
Ranbaxy<br />
7. Non-domestic business snapshot 5/10<br />
Positives<br />
• Strong presence in the US and emerging markets.<br />
• Strong chemistry skills and backward integrated low-cost operations.<br />
• Para-IV pipeline in the US market is strongest among peers.<br />
• Strong parentage (Daiichi, Sankyo, Japan).<br />
Risks & concerns<br />
• Resolution of US FDA issues imperative to monetize large Para-IV opportunities in<br />
the US. This can result in a large one-time penalty payment.<br />
• Needs to reduce fixed costs.<br />
• Yet to initiate steps to exploit the bio-similars space.<br />
• Acquisitions have not delivered desired results, impacting return ratios.<br />
Key news flows/triggers<br />
• US FDA resolution for Paonta and Dewas facility.<br />
• Launch of generic Lipitor with 180-day exclusivity in November 2011.<br />
• Further visibility on exploiting synergies with Daiichi.<br />
Impact assessment<br />
• We are neutral on Ranbaxy's international business despite its strong presence in the<br />
US and emerging markets, due to ongoing US FDA issues and high fixed cost in some<br />
of the European markets<br />
• We expect the international business to record 14.5% CAGR over CY10-12 excluding<br />
low-competition and Para-IV products in the US.<br />
• Option values (Para-IV products) to contribute INR38.2b in one-time PAT over CY11-<br />
14 with DCF value of INR77/share.<br />
Sales mix (INR m)<br />
2008 2009 2010 2011E 2012E CY10-12<br />
CAGR (%)<br />
Dosage Form<br />
India 368 359 387 438 519 15.9<br />
Growth (%) 8.9 -2.5 7.7 13.2 18.6<br />
Europe, CIS and Africa 571 480 527 621 697 15.0<br />
Growth (%) -1.9 -15.9 9.8 17.8 12.2<br />
Japan,Asia Pacific 100 100 93 102 133 19.4<br />
& Middle East<br />
Growth (%) -9.1 0.0 -7.0 10.0 29.7<br />
Latin America 74 71 83 80 102 10.9<br />
Growth (%) 15.6 -4.1 16.9 -3.6 27.7<br />
USA 448 397 660 467 473 -15.4<br />
Growth (%) 6.9 -11.4 66.2 -29.3 1.2<br />
Total dosage 1,561 1,407 1,750 1,708 1,924 4.9<br />
Growth (%) 3.2 -9.9 24.4 -2.4 12.6<br />
API 117 112 114 143 143 11.8<br />
Growth (%) 12 -5 2 25 0<br />
Allied business 4 0 0 0 0 -<br />
Growth (%) 0 -100 -99 -99 -99<br />
Total sales 1,682 1,519 1,864 1,851 2,066 5.3<br />
Note - Estimates exclude Para-IV/low-competition opportunities in US except for CY11<br />
EBITDA Contribution<br />
Non-DF<br />
EBITDA<br />
2%<br />
DF<br />
EBITDA<br />
98%<br />
Source: Company/MOSL<br />
August 2011 110
Ranbaxy<br />
8. Earnings growth and stock attractiveness: 6/30<br />
We expect overall top-line CAGR of 14.4% over CY10-12, leading to EPS CAGR of<br />
53%, albeit on a very low base. Cost cuts, leading to improved profitability and gradual<br />
recovery in the US business, will be key growth drivers.<br />
The key near term determinant for Ranbaxy's valuations will be the expected resolution of<br />
the US FDA and DoJ issues. Ranbaxy management has been trying to resolve these<br />
issues. However, time-lines for such a solution are not known.<br />
Valuations imply market attaching sustainable P/E multiples to Para-IV<br />
upsides<br />
• Current valuations implies that market is attaching sustainable P/E multiples<br />
to Para-IV upsides: Given the potential recurrence of Para-IV upsides every year<br />
for the CY11-12 period, Para-IV upsides are attracting P/E based valuations. We<br />
believe that these are one-off upsides and hence continue to value them on DCF<br />
basis. Our current DCF value of all potential Para-IV upsides is INR77/sh.<br />
• US FDA resolution imperative: Since sustaining current valuations is dependent on<br />
upsides from Lipitor & Nexium, it is imperative for RBXY to resolve outstanding US<br />
FDA issues and salvage the upsides from these two opportunities which account for<br />
80% of overall Para-IV upsides.<br />
• Valuations discount best-case scenario: Ranbaxy is currently valued at 33.0x<br />
CY11E and 23.3x CY12E core EPS. Our estimates exclude MTM forex gains and<br />
one-off upsides from Para-IV opportunities. Our current DCF value of all potential<br />
Para-IV upsides is INR77/sh. We believe that current valuations are discounting the<br />
best-case scenario for both the core business as well as for the Para-IV upsides. We<br />
maintain Sell with target price of INR412 (20x CY12E EPS + FTF DCF value of<br />
INR77/sh).<br />
Ranbaxy RoE & RoCE (%)<br />
Ranbaxy one year forward P/E<br />
RoE<br />
RoCE<br />
120<br />
P/E (x) Avg(x) Peak(x) Min(x)<br />
19.4<br />
90<br />
94.6<br />
15.9<br />
11.4 10.4<br />
9.8<br />
9.8<br />
10.7<br />
7.2 11.1<br />
4.4<br />
60<br />
30<br />
0<br />
14.3<br />
37.7<br />
30.7<br />
2008 2009 2010 2011 2012E<br />
Aug-06<br />
Mar-07<br />
Aug-07<br />
Feb-08<br />
Aug-08<br />
Feb-09<br />
Aug-09<br />
Feb-10<br />
Aug-10<br />
Feb-11<br />
Aug-11<br />
August 2011 111
Ranbaxy<br />
Ranbaxy non-domestic business: key trends, triggers & risk<br />
Getting the US business on track is key: Over the past 3-4 years, Ranbaxy has been<br />
facing cGMP issues, which have gradually aggravated. The problems started with a warning<br />
letter for the Paonta facility and gradually aggravated into an import alert for the Paonta<br />
and Dewas facilities and culminated in the Application of Integrity Policy (AIP) being<br />
invoked for the Paonta facility.<br />
The US FDA's steps resulted in the stopping of exports of US formulations from both the<br />
facilities. Ranbaxy's US facility is the only facility that supplies products in the US, pending<br />
the resolution of the US FDA issues at its India facilities. We believe getting the US<br />
business back on track through the clearance of the Paonta and Dewas facilities is crucial<br />
for the Ranbaxy management in the near-term.<br />
Resolution of US FDA issues imperative: We believe it is imperative for Ranbaxy to<br />
resolve its long-pending US FDA cGMP problems, without which the significantly large<br />
upsides for its US business are at a risk. The management has been attempting to resolve<br />
the issues and is trying to obtain a comprehensive solution with the US FDA and the DoJ<br />
for all outstanding issues. While the time-lines for such a resolution are not predictable, we<br />
note that, given past precedence, Ranbaxy may be required to pay a one-time penalty for<br />
the resolution.<br />
Risks to Para-IV opportunities: Given the seriousness of the US FDA issues, we<br />
believe there are risks to high value FTF opportunities like generic Lipitor and Nexium<br />
(cumulative one-time PAT of INR38.2b over CY11-14). Ranbaxy must demonstrate that<br />
these high-value Para-IV opportunities are not at risk.<br />
Para-IV upsides: Ranbaxy: One-time PAT from Para-IV upsides (INR m)<br />
Brand Innovator Launch CY09 CY10 CY11E CY12E CY13E CY14E Total % of total<br />
Sales<br />
(USD m)<br />
Valtrex 1500 25-Nov-09 2,724 5,893 - - - - 8,616 18<br />
Flomax 1452 Mar-10 - 1,561 - - - - 1,561 3<br />
Aricept 1900 30-Nov-10 - 393 1,993 - - - 2,386 5<br />
Lipitor 5000 Nov-11 - - 2,250 6,750 - - 9,000 18<br />
Caduet 304 Nov-11 - - 247 740 - - 986 2<br />
Diovan 1300 Sep-12 - - - 2,683 1,342 - 4,025 8<br />
Valcyte 300 Mar-13 - - - - 2,007 - 2,007 4<br />
Nexium 2800 May-14 - - - - - 20,168 20,168 41<br />
Total 17,956 2,724 7,846 4,489 10,173 3,348 20,168 48,749 100<br />
One-Time EPS 6.5 18.7 10.7 24.2 8.0 48.0<br />
Ranbaxy - Para-IV Upsides in US (INR M) Ranbaxy - Core & Para-IV Profits (INR M)<br />
20,168<br />
Core PAT<br />
Para-IV PAT<br />
2,724<br />
7,846<br />
4,489<br />
10,173<br />
3,348<br />
20,168<br />
10,173<br />
3,348<br />
7,846 4,489<br />
3,008<br />
4,991 7,052 8,437 9,702<br />
CY09 CY10 CY11E CY12E CY13E CY14E<br />
CY10 CY11E CY12E CY13E CY14E<br />
August 2011 112
Ranbaxy<br />
Key FTF upsides: Nexium at risk<br />
Nexium account for a major portion of Ranbaxy's FTF upsides. We believe there are<br />
potential risks to the monetization of these opportunities due to ongoing US FDA issues.<br />
Settlements for Nexium raise uncertainty<br />
AstraZeneca entered into an out-of-court settlement with Teva and recently with Dr<br />
Reddy's Labs for the potential launch of their respective generic versions in May 2014.<br />
This raises uncertainty over Ranbaxy's FTF status and an out-of-court settlement with<br />
AstraZeneca since Ranbaxy's 180-day exclusivity on Nexium is likely to commence from<br />
May 2014.<br />
Teva and Dr Reddy's indicated that if Ranbaxy got final US FDA approval, they would<br />
launch their generic versions after the expiry of Ranbaxy's exclusivity. However, the<br />
matching launch time-lines for the three settlements (May 2014) and the fact that Ranbaxy<br />
is yet to receive even tentative approval, raises uncertainty over upsides for Ranbaxy. The<br />
table highlights the upsides for Ranbaxy in both cases:<br />
NEXIUM UPSIDE (USD m) - Sensitivity Analysis<br />
Only Ranbaxy<br />
Ranbaxy along with<br />
on market<br />
DRL and Teva<br />
Innovator Sales (USD mn) 2,800 2,800<br />
Sales period (mths) 6 6<br />
Price discount (%) 30 70<br />
Potential Mkt for generics 980 420<br />
No. of players in mkt 2 4<br />
Ranbaxy Mkt Share (%) 70 30<br />
Ranbaxy Sales (USD mn) 686 126<br />
Assumed exchange rate (INR/USD) 42 42<br />
Ranbaxy Sales (INR mn) 28,812 5,292<br />
PAT Margin (%) 70 40<br />
PAT (INR mn) 20,168 2,117<br />
WACC (%) 14 14<br />
PV Factor 1 0.6<br />
PV of cash flow 11,941 1,253<br />
NPV (INR/share) 28.4 3.0<br />
Source: Company/MOSL<br />
August 2011 113
Ranbaxy<br />
Long-term plan to exploit synergies with Daiichi<br />
Ranbaxy formulated a three-year plan (2010-12) to exploit synergies with Daiichi. This<br />
plan straddles multiple areas in which the partners can leverage each other's strengths.<br />
The areas include:<br />
1. Accessing the Japanese generic market through Daiichi;<br />
2. Leveraging Ranbaxy's distribution network to launch Daiichi's products, with the key<br />
target markets including India, Africa, Latin America and parts of Europe.<br />
3. Synergies for NCE research: Daiichi has bought Ranbaxy's NCE operations.<br />
4. Accessing Ranbaxy's low-cost manufacturing facilities in India as a sourcing base for<br />
Daiichi.<br />
Accessing the Japanese generic market<br />
The USD70b Japanese pharmaceutical market (with 5% generic penetration at ~USD3.5b)<br />
is undergoing a change with the government planning to reduce health care costs by<br />
encouraging generics. The Japanese government aims to double the generic penetration<br />
over the next five years.<br />
Ranbaxy plans to become a strong player in this market by accessing Daiichi's presence<br />
and brand-equity in this market as well as its own product pipeline. We do not expect<br />
major upsides from this initiative in the short- to medium term as Ranbaxy will have to file<br />
products with the Japanese authorities and get them approved, which will be timeconsuming.<br />
Leveraging Ranbaxy's distribution network to launch Daiichi products<br />
Key target markets include India, Africa, Latin America and parts of Europe, in which<br />
Ranbaxy's front-end presence will be leveraged to distribute Daiichi's products (can also<br />
include patented products). A beginning has been made with Ranbaxy starting marketing<br />
of a few products in India, Mexico and Romania. We believe this could result in incremental<br />
upsides to Ranbaxy in the medium term.<br />
Cost savings for NCE research division<br />
In July 2010, Ranbaxy transferred its NCE research operations to Daiichi along with all its<br />
NCE assets and ~150 employees. In return, it received some upfront consideration (not<br />
quantified) from Daiichi. The transfer of NCE research to Daiichi will result in cost savings<br />
for Ranbaxy besides the upfront cash inflow. We estimate Ranbaxy spends ~20% of its<br />
annual R&D expenditure on NCE research, which has now been transferred to Daiichi,<br />
leading to cost savings. Our estimates take into account the savings in R&D cost due to<br />
the sale of NCE research operation to Daiichi.<br />
Shifting manufacturing to Ranbaxy's Indian facilities<br />
Ranbaxy can supply some products to Daiichi (especially APIs) from its Indian facilities,<br />
resulting in upsides for both partners. However, this may be a time-consuming exercise as<br />
it will require changing Daiichi's filings for these products.<br />
August 2011 114
Ranbaxy<br />
Financials and valuations: Ranbaxy<br />
Income Statement<br />
(INR Million)<br />
Y/E December 2009 2010 2011E 2012E<br />
Net Sales 73,294 85,355 83,111 90,736<br />
Change (%) 1.5 16.5 -2.6 9.2<br />
Other Operating Income 2,676 4,253 2,132 2,268<br />
Total Expenditure 68,846 70,955 76,209 81,969<br />
EBITDA 7,124 18,652 9,033 11,035<br />
Change (%) -15.1 161.8 -51.6 22.2<br />
Margin (%) 9.4 20.8 10.6 11.9<br />
Depreciation 2,676 5,533 3,210 3,894<br />
EBIT 4,448 13,120 5,823 7,141<br />
Int. and Forex loss -783 -793 1,063 204<br />
Other Income - Rec. 2,935 2,795 3,290 1,862<br />
PBT pre EO Expense 8,166 16,708 8,050 8,800<br />
Change (%) -459.2 104.6 -51.8 9.3<br />
Extra Ordinary Expense -1,931 -4,293 -1,138 -700<br />
PBT after EO Exp. 10,098 21,001 9,188 9,500<br />
Tax 6,991 5,849 1,516 1,615<br />
Tax Rate (%) 69.2 27.8 16.5 17.0<br />
Reported PAT 3,107 15,152 7,672 7,885<br />
Minority Interest 142 185 80 0<br />
Adj PAT after Min. Int. 1,911 10,855 6,984 7,052<br />
Change (%) -38.2 467.9 -35.7 1.0<br />
Margin (%) 2.6 12.7 8.4 7.8<br />
Adj PAT excl one-offs -812 3,008 4,991 7,052<br />
Balance Sheet<br />
(INR Million)<br />
Y/E December 2009 2010 2011E 2012E<br />
Equity Share Capital 2,102 2,105 2,105 2,105<br />
Fully Diluted Eq Cap 2,102 2,105 2,105 2,105<br />
Reserves 41,261 53,871 59,241 65,549<br />
Revaluation Reserves 71 71 71 71<br />
Net Worth 43,434 56,047 61,417 67,725<br />
Minority Interest 533 647 567 567<br />
Loans 36,295 43,348 23,328 13,328<br />
Deferred liabilities -4746 -227 -227 -227<br />
Capital Employed 75,517 99,815 85,085 81,393<br />
Gross Block 62,786 67,050 69,550 72,050<br />
Less: Accum. Deprn. 17,880 21,571 24,781 28,675<br />
Net Fixed Assets 44,905 45,479 44,769 43,375<br />
Capital WIP 6,231 3,818 6,231 6,231<br />
Investments 5,407 4,985 4,985 4,985<br />
Goodwill/Intangibles 21,446 19,009 19,009 19,009<br />
Curr. Assets 60,086 86,932 64,226 61,286<br />
Inventory 18,407 21,926 21,632 23,616<br />
Account Receivables 18,399 16,052 15,971 17,436<br />
Cash and Bank Balance 12,416 32,644 12,506 6,063<br />
Others 10,863 16,309 14,117 14,170<br />
Curr. Liability & Prov. 41,112 41,398 35,125 34,483<br />
Account Payables 32,511 31,865 30,774 29,750<br />
Provisions 8,602 9,534 4,350 4,733<br />
Net Current Assets 18,974 45,534 29,101 26,803<br />
Appl. of Funds 75,517 99,815 85,085 81,393<br />
E: MOSL Estimates<br />
Ratios<br />
Y/E December 2009 2010 2011E 2012E<br />
Basic (INR)<br />
EPS (Fully diluted)* 4.5 25.8 11.9 16.7<br />
Cash EPS 10.9 38.9 24.2 26.0<br />
BV/Share 103.1 132.9 145.7 160.7<br />
DPS 0.0 2.0 4.7 3.2<br />
Payout (%) 0.0 6.5 30.0 20.0<br />
Valuation (x)<br />
P/E (Fully diluted) 15.2 33.0 23.3<br />
PEG (x) 0.0 -0.9 23.9<br />
Cash P/E 10.0 16.1 15.0<br />
P/BV 2.9 2.7 2.4<br />
EV/Sales 2.3 2.4 2.2<br />
EV/EBITDA 11.1 23.0 18.5<br />
Dividend Yield (%) 0.5 1.2 0.8<br />
Return Ratios (%)<br />
RoE 4.4 19.4 11.4 10.4<br />
RoCE 9.8 15.9 10.7 11.1<br />
Working Capital Ratios<br />
Fixed Asset Turnover (x) 1.6 1.9 1.8 2.1<br />
Debtor (Days) 92 69 70 70<br />
Inventory (Days) 92 94 95 95<br />
Working Capital (Days) 33 55 73 83<br />
Leverage Ratio (x)<br />
Current Ratio 1.5 2.1 1.8 1.8<br />
Debt/Equity 0.8 0.8 0.4 0.2<br />
Cash Flow Statement<br />
(INR Million)<br />
Y/E December 2009 2010 2011E 2012E<br />
Op.Profit/(Loss) bef. Tax 7,124 18,652 9,033 11,035<br />
Interest/Dividends Recd. 2,935 2,795 3,290 1,862<br />
Direct Taxes Paid 493 -1,331 -1,516 -1,615<br />
(Inc)/Dec in WC -11,296 -6,332 -3,706 -4,144<br />
CF from Operations -743 13,785 7,101 7,138<br />
CF frm Op.incl EO Exp. -743 13,785 7,101 7,138<br />
(Inc)/Dec in FA -4,205 -3,694 -4,913 -2,500<br />
(Pur)/Sale of Investments 24 423 0 0<br />
CF from Investments -4,181 -3,271 -4,913 -2,500<br />
Change in networth -704 2,736 1,138 700<br />
Inc/(Dec) in Debt -6,695 7,167 -20,100 -10,000<br />
Interest Paid 783 793 -1,063 -204<br />
Dividend Paid 0 -982 -2,302 -1,577<br />
CF from Fin. Activity -6,616 9,714 -22,327 -11,081<br />
Inc/Dec of Cash -11,540 20,228 -20,139 -6,442<br />
Add: Beginning Balance 23,956 12,416 32,644 12,506<br />
Closing Balance 12,416 32,644 12,506 6,063<br />
August 2011 115
Domestic Formulations | <strong>New</strong> Peaks<br />
MEDICINES<br />
MEDICINES CAPSULE Score<br />
52/100<br />
The homecoming<br />
Dr Reddy's<br />
CMP: INR1,446<br />
DRRD IN<br />
TP: INR1,670 Neutral<br />
M: Mix 4/10<br />
Dr Reddy's Laboratories (DRL) derives 72% revenue<br />
from the acute therapy segment and has small<br />
presence in chronic therapy segments through the<br />
CVS segment.<br />
GI, CVS, pain management and AI contribute ~64%<br />
to DRL's domestic formulation revenue.<br />
E: Equity with doctors 6/10<br />
DRL has good brand equity in the GI and pain<br />
management segments but is not a market leader<br />
in these therapeutic segments.<br />
DRL ranks third in the GI and pain management<br />
segments with a prescription market share of 4.4%<br />
and 4.1% respectively. In other major segments<br />
its brand equity is not very strong. DRL has not<br />
been able to improve its brand equity in most after<br />
therapeutic areas in which it is present.<br />
D: Distribution & reach 6/10 I: Introductions 4/10<br />
DRL derives 68% of its revenue from metros and<br />
tier-I cities.<br />
The company's distribution in metros has increased<br />
significantly over time and the contribution of other<br />
geographies to revenue has fallen over the past<br />
four years.<br />
DRL has a large field force with 3,165 MRs which<br />
helps it to tap both the urban and semi-urban<br />
market.<br />
DRL launched fewer new products over the past<br />
four years than its peers. It launched 22 new<br />
products (including line extensions) annually over<br />
the past four years.<br />
Over the past two years DRL's revenue growth has<br />
been driven largely by old products rather than new<br />
launches.<br />
Stock info<br />
Equity Shares (m) 168.4<br />
52-Week Range (INR) 1,855/1,320<br />
1,6,12 Rel. Perf. (%) 5/4/20<br />
M.Cap. (INR b) 243.5<br />
M.Cap. (USD b) 5.3<br />
Financial & valuation summary<br />
Year Net Sales PAT EPS EPS P/E Adj P/E P/BV RoE RoCE EV/ EV/<br />
End (INR M) (INR M) (INR) GR. (%) (X) (X) (X) (%) (%) Sales EBITDA<br />
03/10A 68,179 334 2.0 729.7 716.2 5.7 2.5 2.6 3.5 17.4<br />
03/11A 74,693 11,099 65.6 22.0 21.6 5.3 24.1 16.7 3.5 16.7<br />
03/12E 81,754 11,615 68.6 7.8 21.1 20.7 4.7 22.5 15.4 3.2 17.1<br />
03/13E 90,323 13,725 81.1 18.2 17.8 17.5 4.2 23.5 17.0 2.9 14.4<br />
Background<br />
Dr. Reddy's is a vertically integrated company with presence across the pharmaceutical value chain through<br />
its core businesses of Global Generics, Pharmaceutical Services & Active Ingredients (PSAI), and Proprietary<br />
Products. The company is currently developing bio-generics and NCEs. Key focus markets include India,<br />
US, Europe and Russia.<br />
August 116
Dr Reddy's<br />
Chairman Profile<br />
Chairman<br />
Dr. Reddy's Labs was promoted by Dr. Anji Reddy, a first generation entrepreneur. The day-to-day operations<br />
of the company are currently managed by Mr. G.V. Prasad (Vice Chairman & CEO) and Mr. Satish Reddy<br />
(MD & COO). Building a strong business in US and Russia coupled with global scale in the API business<br />
are the key achievements of the company.<br />
C: CAGR and scale-up 6/10<br />
DRL outperformed the industry with revenue CAGR<br />
of 18% over FY05-11. The company scaled up its<br />
business rapidly albeit on a low base.<br />
We expect DRL to post revenue CAGR of 15%<br />
over FY11-13, in line with the industry, given its<br />
small base, recent additions to field force and<br />
considering the management's increased focus on<br />
the business.<br />
I: Improvement in productivity 2/10<br />
DRL posted negative MR productivity over 2004-<br />
10. The number of MRs grew 16% against revenue<br />
growth of 13.6%, indicating a fall in sales force<br />
productivity.<br />
Revenue per MR declined from INR3.6m in 2004 to<br />
INR3.2m in 2010. At this level, productivity is the<br />
lowest among peers.<br />
N: Non-domestic business 7/10<br />
We are positive on DRL's international business<br />
given its strong US and emerging markets portfolio,<br />
backed by a strong API portfolio.<br />
We expect non domestic business to record 15.2%<br />
CAGR over FY11-13, excluding low-competition and<br />
Para-IV products in the US.<br />
Option values (low-competition and Para-IV<br />
products in US) will contribute INR12.9b to sales<br />
and INR5.4b to PAT in FY12.<br />
E: Earnings growth 5/10<br />
We expect DRL to post top-line of 15% CAGR over<br />
FY11-13, leading to EPS CAGR of 11%, excluding<br />
Para-IV upsides.<br />
DRL's core earnings growth will be driven by<br />
sustained double-digit growth in the branded<br />
formulations business but will be partly tempered<br />
down by higher taxes.<br />
S: Stock Attractiveness 12/20<br />
Return ratios are muted due to a high cost German<br />
acquisition, which is not yielding desired returns.<br />
DRL is valued at 20.7x FY12E and 17.5x FY13E<br />
consolidated earnings.<br />
We had placed our recommendation "Under<br />
Review" for a potential downgrade (from Buy earlier)<br />
some time back. We now rate the stock Neutral<br />
with TP of INR1,670.<br />
Stock performance (1 year)<br />
Dr Reddy’ s Labs Sensex - Rebased<br />
2,000<br />
1,750<br />
1,500<br />
1,250<br />
1,000<br />
Aug-10 Nov-10 Feb-11 May-11 Aug-11<br />
August 2011 117
Dr Reddy's<br />
India formulations<br />
snapshot<br />
Domestic formulations:<br />
Revenue contribution<br />
marginal, sizable<br />
contribution to profits<br />
The domestic formulations<br />
business contributes just<br />
~15% to DRL's revenue but is<br />
one of its most profitable<br />
businesses. We estimate<br />
contribution of 23% to EBITDA.<br />
EBITDA Contribution<br />
Non-DF DF EBITDA<br />
EBITDA 23%<br />
77%<br />
The homecoming<br />
Balancing focus between overseas and domestic markets<br />
Despite being one of the largest Indian generic companies, Dr Reddy's Laboratories (DRL)<br />
has been lagging its peers in the domestic formulations business. DRL, ranked a distant<br />
thirteenth in the industry with 2.17% market share, has strong brand equity in the<br />
gastrointestinal and pain management segments. DRL lagged the industry average growth<br />
rate over the past four years in all geographies except metros. However, of late, it has been<br />
expanding in the domestic market, which is visible from its growth up-tick in 2009 and 2010.<br />
1. Mix: 4/10<br />
Acute therapeutic segments dominate sales<br />
The top four therapeutic segments, GI, CVS, pain management and AI contribute ~63%<br />
to DRL's domestic formulations revenue. Overall, the acute therapeutic segments contribute<br />
~72% to sales. Over the past 10 years, the GI and respiratory segments increased their<br />
contribution from 19% in FY01 to 29% in FY11 while contributions from pain management<br />
and anti-infective segments fell from more than 32% in FY01 to 20.6% in FY11.<br />
Among laggards in the<br />
segment compared with<br />
peers<br />
DRL ranks thirteenth in the<br />
industry and has a market<br />
share of 2.17%. Over the past<br />
five years DRL's market share<br />
dropped from 2.31% in 2006 to<br />
2.17% in 2010. DRL's focus on<br />
growing the international<br />
generic business had resulted<br />
in low focus on the domestic<br />
formulations business in the<br />
past which has impacted<br />
overall business growth. DRL<br />
posted revenue CAGR of 18%<br />
over the past six years,<br />
against the industry's 14%<br />
CAGR.<br />
DRL market share and<br />
growth<br />
Dr. Reddy's: Therapeutic breakup<br />
Diabetes<br />
5%<br />
AI<br />
15%<br />
Pain<br />
17%<br />
FY01<br />
Derma Respi<br />
tology ratory<br />
3% 1%<br />
CVS<br />
19%<br />
Stomatologicals 5%<br />
Respiratory 5%<br />
VMN<br />
9%<br />
Others<br />
13%<br />
GI<br />
18%<br />
FY11<br />
AI<br />
8%<br />
Pain<br />
17%<br />
Diabetes<br />
7%<br />
VMN 5% Others 10%<br />
Derma<br />
tology<br />
5%<br />
CVS<br />
22%<br />
FY05<br />
GI 23%<br />
Respira<br />
tory<br />
4%<br />
VMN<br />
6%<br />
Others<br />
9%<br />
GI<br />
22%<br />
18.6<br />
Mkt Share (%)<br />
Grow th (%)<br />
20.6<br />
Dermatology 6%<br />
14.7<br />
10.5<br />
8.0<br />
Diabetes 6%<br />
CVS 19%<br />
2.31<br />
2.4<br />
2.3<br />
2.2<br />
2.2<br />
AI 8% Pain 13%<br />
2006<br />
2007<br />
2008<br />
2009<br />
2010<br />
Source: Company/Industry/MOSL<br />
August 2011 118
Dr Reddy's<br />
2. Equity with doctors: 6/10<br />
Good brand equity in GI, pain management segments<br />
DRL is not a market leader in any therapeutic segment. It ranks third in the GI segment<br />
with market share of 5.6%, eighth in the pain management segment with market share of<br />
4% and tenth in the dermatology segment with market share of 3%. A major drawback in<br />
DRLs portfolio is that it is not among the top 10 players in any major chronic therapeutic<br />
segment. Over the past two years, DRL's growth in key segments like the GI and pain<br />
management segments has been lower than that of industry.<br />
Market share in key therapies (%) (2010) Growth comparison (%) (2010)<br />
5.6<br />
Avg Gr - Company<br />
Avg Gr - Industry<br />
4<br />
3<br />
15.5<br />
17.1<br />
16.7<br />
23.0<br />
18.4<br />
4.4<br />
GI Pain/Analgesic Dermatology<br />
GI Pain/Analgesic Dermatology<br />
* Average growth over 2009-2010 Source: Industry/MOSL<br />
DRL does not have high brand equity except in the GI and pain management segments in<br />
terms of the number of prescriptions written. DRL ranks at third position in the GI and<br />
pain management segments with prescription market shares of 4.4% and 4.1% respectively.<br />
In other major segments the brand equity is not very strong. DRL has not improved its<br />
brand equity in most therapeutic areas in which it is present.<br />
DRL's prescription ranking<br />
Jan-07 Jan-08 Jan-09 Jan-10 Oct-10<br />
Pain Mgmt 3 3 3 3 3<br />
GI 5 3 4 4 3<br />
Respiratory 10 9 10 11 10<br />
Vit 9 8 11 14 11<br />
CVS 10 11 12 12 13<br />
Anti-diabetic 11 13 15 14 13<br />
Anti-infectives 17 15 16 16 16<br />
Derma 23 19 22 19 21<br />
Source: Industry/MOSL<br />
Higher brand concentration<br />
DRL's top 10 brands contribute ~37% to its total revenue and seven of its top 10 brands<br />
feature among the industry's top 300 brands. Its No1 brand Omez (Omeprazole in the GI<br />
segment) ranks twenty-seventh in the industry and has been posting revenue CAGR of<br />
17% over the past two years. Six out of the top 10 brands reported double-digit revenue<br />
CAGR over the past two years.<br />
August 2011 119
Dr Reddy's<br />
DRL's top 10 brands<br />
Brand Drug Product Launch Sales (INR m) YoY Gr (%) CAGR (%)<br />
Omez Omeprazole 1992 1,065 14.8 17.2<br />
Nise Nimesulide 1996 700 1.4 7.6<br />
Stamlo Amlodipine 1994 507 7.2 9.6<br />
Reditux Rituximab 405 74.6 42.7<br />
Omez-D Omeprazole & Domperidone 2005 377 21.6 34.0<br />
Stamlo Beta Atenelol & Amlodipine 1996 328 0.6 4.4<br />
Razo Rabeprazole 2002 285 15.4 15.4<br />
Atocor Atorvastatin 2000 278 1.5 1.7<br />
Mintop Minoxidil 1989 209 6.6 10.2<br />
Razo-D Rabeprazole & Domperidone 2005 200 19.0 20.4<br />
CAGR through 2009-2011<br />
Source: Company/MOSL<br />
3. Distribution and reach: 6/10<br />
DRL derives 68% of its revenue from metros and class-I towns, against an industry<br />
average of 63%. Over the past four years revenue CAGR for all geographies have been<br />
either in line or below the industry average.<br />
DRL: Geographical distribution of revenues (%) Industry: Geographical distribution of revenues (%)<br />
Metros Class I Tow ns Class II to VI Rural<br />
20.5 20.9 20.8 17.9 16.0<br />
17.1 16.5 16.3 16.1 15.6<br />
Metros Class I Tow ns Class II to VI Rural<br />
20.6 20.9 20.0 18.1 17.3<br />
19.2 19.0 19.5 19.4 19.6<br />
31.9 31.5 32.4 32.1<br />
30.6<br />
32.6 31.3 31.6 32.5 32.0<br />
30.5 31.1 30.5 33.9 37.8<br />
27.6 28.9 28.9 30.0 31.0<br />
CY06 CY07 CY08 CY09 CY10<br />
CY06 CY07 CY08 CY09 CY10<br />
DRL: Geography-wise growth rates (%) Industry: Geography-wise growth rates (%)<br />
Metros Class I Tow ns Class II to V I Rural<br />
34.3<br />
17.2<br />
20.1<br />
17.2<br />
17.2<br />
13.6<br />
13.2<br />
15.1<br />
6.8<br />
10.5<br />
9.8 8.3<br />
7.7<br />
9.4<br />
6.7<br />
-7.0<br />
CY07 CY08 CY09 CY10<br />
Metros Class I Tow ns Class II to VI Rural<br />
26.2<br />
23.5<br />
17.6<br />
17.5<br />
17.7<br />
20.7<br />
15.6<br />
17.5<br />
14.0<br />
16.4<br />
11.1<br />
14.7<br />
13.0<br />
7.9<br />
9.5<br />
2.5<br />
CY07 CY08 CY09 CY10<br />
Source: Industry/MOSL<br />
August 2011 120
Dr Reddy's<br />
4. Introductions: 4/10<br />
DRL's growth over the past four years has been led by existing products<br />
as It launched fewer new products compared with the industry<br />
Over the past four years DRL launched 22 new products (including line extensions),<br />
annually which is less than its peers. The average revenue per new launch has fallen over<br />
the past four years, indicating a sharp decline in value derived out of new launches. Over<br />
the past two years, DRL's revenue growth has been largely driven by existing products<br />
rather than new launches.<br />
DRL: <strong>New</strong> launches DRL: Growth composition (%)<br />
No. Of launches in last 2 yrs<br />
Avg sales per launch (INR m)<br />
138.8 142.2<br />
<strong>New</strong> Launches<br />
Existing Brands<br />
7.0<br />
18.5<br />
5.2<br />
19.4 28.3<br />
34 26 54 63<br />
CY07 CY08 CY09 CY10<br />
7.7<br />
6.6<br />
5.3<br />
1.4 2.1<br />
CY07 CY08 CY09 CY10<br />
Source: Industry/MOSL<br />
5. CAGR and scale-up: 6/10<br />
DRL is aggressively targeting strong growth in the domestic formulations business and<br />
expects double-digit growth, led by new launches and strengthening of its field force (600<br />
MRs added over the past few quarters to total ~3,000). We expect DRL's domestic<br />
formulations business to post revenue CAGR of 15% over FY11-13. We expect DRL to<br />
report in line industry growth over the next two years, considering the management's<br />
increased thrust on the business and relatively low base.<br />
Dometic formulation revenues<br />
DF Revenue (INR m) YoY Grow th (%)<br />
26.7<br />
26.0<br />
15.7<br />
19.8<br />
15.1<br />
13.0<br />
16.0<br />
5.2<br />
5,526 6,964 8,060 8,478 10,158 11,690 13,210 15,323<br />
FY06 FY07 FY08 FY09 FY10 FY11 FY12E FY13E<br />
Source: Company/MOSL<br />
August 2011 121
Dr Reddy's<br />
6. Improvement in MR productivity: 2/10<br />
DRL's sales force productivity fairs poorly compared with the industry<br />
DRL's domestic formulations business posted revenue of 13.6% CAGR over FY04-10<br />
and its sales force grew 16% CAGR, implying negative productivity of the salesforce. In<br />
2004, DRL derived INR3.6m revenue per MR, which fell to INR3.2m in FY10. Compared<br />
with the companies covered in this report, DRL's performance was below average.<br />
DRL: Sales force productivity (2004-10)<br />
No. of MRs Revenue per MR (INR m)<br />
3.6<br />
Sales force addition CAGR (%)<br />
Productivity Improvement CAGR (%)<br />
3,165<br />
16.0 11.5<br />
1,300<br />
3.2<br />
-2.1<br />
1.9<br />
2004 2010<br />
DRL<br />
Industry<br />
Source: Company/Industry/MOSL<br />
7. Non-domestic business snapshot: 7/10<br />
Positives<br />
• DRL has a strong presence in the US and emerging markets.<br />
• It has strong chemistry skills and fully backward integrated, low-cost operations.<br />
• It has a pragmatic mix of low-competition, Para-IV and normal products for the US<br />
market.<br />
• It is one of the few Indian players to target the bio-similar opportunity.<br />
• It is among the top three global API players.<br />
Risks and concerns<br />
• Further write-offs for DRL's German operations cannot be ruled out. They are related<br />
to potential price erosions in the tender market.<br />
• DRL has yet to tie up with a global player to capitalize on the bio-similar opportunity in<br />
regulated markets.<br />
• DRL's CRAMS business may not scale-up due to a conflict of interest with a strong<br />
generic business.<br />
• DRL's past acquisitions have not delivered the desired results, which has impacted<br />
return ratios.<br />
<strong>New</strong>s flow/triggers<br />
• Launch of generic Zyprexa in US with 180 days exclusivity expected in October 2011<br />
• US FDA approval for generic Arixtra in the US expected in FY12.<br />
• Ramp-up in supplies to GSK for emerging markets expected in FY13.<br />
• Further visibility on DRL's achieving US$2.7b revenue by FY13.<br />
August 2011 122
Dr Reddy's<br />
Impact assessment<br />
• We are positive on DRL's international business given its strong US and emerging<br />
markets portfolio backed by a strong API portfolio.<br />
• We expect the non-domestic business to record 15.2% CAGR over FY11-13 excluding<br />
low-competition and Para-IV products in the US.<br />
• Option values (low-competition and Para-IV products) will contribute INR12.9b to<br />
DRL's sales and INR5.4b to PAT in FY12.<br />
Sales mix (INR m)<br />
FY09 FY10 FY11 FY12E FY13E FY10-13<br />
CAGR (%)<br />
PSAI 18,758 20,404 19,648 20,655 22,427 6.8<br />
India 2,383 2,646 2,619 2,750 2,887 5.0<br />
International 16,375 17,758 17,029 17,905 19,540 7.1<br />
Branded Formulations 18,060 22,145 25,913 29,708 34,627 15.6<br />
India 8,478 10,158 11,690 13,210 15,323 14.5<br />
International 9,582 11,987 14,223 16,499 19,303 16.5<br />
Generics 31,730 26,460 27,427 29,220 30,638 5.7<br />
US 19,844 16,817 18,996 20,532 21,354 6.0<br />
EU 11,886 9,643 8,431 8,688 9,284 4.9<br />
Others 893 1,268 1,705 2,171 2,631 24.2<br />
Total 69,441 70,277 74,693 81,754 90,323 10.0<br />
Note - Estimates exclude Para-IV/low-competition opportunities in the US<br />
EBITDA Contribution<br />
Non-DF<br />
EBITDA<br />
77%<br />
DF<br />
EBITDA<br />
23%<br />
Source: Company/MoSL<br />
8-9. Earnings growth and stock attractiveness: 17/30<br />
Traction in the branded formulations and US businesses will be key growth drivers for<br />
DRL over the next two years. We estimate core EPS of INR68.6 in FY12 and INR81.1<br />
in FY13, adjusting for the interest cost of the bonus debentures and factoring-in the impact<br />
of likely withdrawal of DEPB scheme. Our core estimates exclude upsides from patent<br />
challenges/low-competition opportunities in the US. The stock trades at 20.7x FY12E and<br />
17.5x FY13E core earnings. While current valuations are supported by large potential<br />
one-time opportunities in the US, they do not fully discount the slowdown in DRL's core<br />
business. We had placed our recommendation "Under Review" for a potential downgrade<br />
(from Buy earlier) some time back. We now rate the stock Neutral with TP of INR1,670<br />
(20x FY13E core EPS + INR47/sh of DCF value).<br />
Dr Reddy's RoE & RoCE (%)<br />
Dr Reddy's one year forward PE<br />
RoE<br />
RoCE<br />
24.1<br />
22.5<br />
23.5<br />
84<br />
64<br />
P/E (x) Avg(x) Peak(x) Min(x)<br />
77.2<br />
4.0<br />
9.9 16.7 15.4<br />
-2.9<br />
2.5<br />
2.6<br />
17.0<br />
44<br />
24<br />
Ne gative<br />
Ear nings<br />
Cycle<br />
25.4<br />
-12.3<br />
2008 2009 2010 2011 2012E 2013E<br />
4<br />
Aug-06<br />
Mar-07<br />
Aug-07<br />
Feb-08<br />
Aug-08<br />
16.4<br />
Feb-09<br />
Aug-09<br />
Feb-10<br />
Aug-10<br />
Feb-11<br />
19.7<br />
Aug-11<br />
August 2011 123
Dr Reddy's<br />
DRL non-domestic business: key trends, triggers & risk<br />
Revenue target of USD2.7b by FY13 implies 27% CAGR<br />
DRL aims at a top-line of USD3b by FY13 implying 27% revenue CAGR over FY11-13.<br />
We believe this is a slightly aggressive target given that most of its businesses are growing<br />
at much lower than 27% CAGR.<br />
Hence, we estimate DRL's core revenue will grow at 15% CAGR to USD2.1b. One-off<br />
and low-competition opportunities in the US are likely to contribute ~USD286m in FY12<br />
and ~USD173m for FY13. We expect revenues of USD2.2b in FY13 including the upside<br />
from low competition opportunities. We believe that without some inorganic initiative, it<br />
will be difficult for DRL to achieve USD2.7b in revenue by FY13.<br />
Strong positioning in emerging markets led by a focused approach<br />
We expect DRL's formulation exports to emerging markets to record 18% CAGR over<br />
FY11-13 led by a ramp-up in its Russian operations and the start of supplies to other<br />
emerging markets under the GSK supply agreement.<br />
The main target markets for the company's emerging market initiative include Russia and<br />
the CIS region, Venezuela and Brazil.<br />
Russia, CIS key markets<br />
With 76 percentage contribution to DRL's emerging market exports, Russia and the CIS<br />
region is a key market for the company. To sustain double-digit growth in this region, DRL<br />
has begun to focus on the Russian OTC market (with the addition of more products and<br />
expansion of the field force) and has in-licensing arrangements to expand its product<br />
portfolio in the region.<br />
US business to ramp-up significantly over the next two years<br />
DRL's revenue target of US$1b in the US implies 55% CAGR over FY11-13, led mainly<br />
by its FTF pipeline of 12 products and contribution from other low-competition opportunities.<br />
Such opportunities are likely to contribute ~INR12.9b and ~INR7.6b in sales and INR5.4b<br />
and INR2.3b to PAT in FY12 and FY13 respectively. We have excluded such opportunities<br />
from our core estimates and forecast that DRL will post core US revenue of 27.5%<br />
CAGR over FY11-13.<br />
Low-competition/patent challenge opportunities in the US gain momentum<br />
DRL management has guided for launch of at least one patent challenge/low-competition<br />
product in the US every year over the next few years. DRL has a pipeline of 11 FTFs. A<br />
combination of scale-up in existing patent challenge/low-competition products and new<br />
opportunities will help the company to achieve its revenue guidance of USD1b by FY13 in<br />
the US.<br />
August 2011 124
Dr Reddy's<br />
DRL US portfolio - one-time pat contribution (INR m)<br />
Product Launch Status FY12E FY13E<br />
Generic Arixtra Launched in Jul-2011 310 1,122<br />
Generic Accolate Launched 366 358<br />
Generic Zyprexa Likely launch on 23-Oct-2011 3,503 -<br />
Generic Prevacid Launched on 15-Oct-2010 1,063 -<br />
Generic Exelon Expected in August 2012 - 60<br />
Generic Clarinex Expected in January 2012 101 124<br />
Generic Geodon Expected in Mar 2012 79 385<br />
Generic Lipitor Expected in May 2012 229<br />
Total 5,421 2,277<br />
DRL US portfolio - one-time revenue contribution (INR m)<br />
Product Launch Status FY12E FY13E<br />
Generic Arixtra Launched in Jul-2011 1,721 4,488<br />
Generic Accolate Launched 731 715<br />
Generic Zyprexa Likely launch on 23-Oct-2011 7,005 -<br />
Generic Prevacid Launched on 15-Oct-2010 3,038 -<br />
Generic Exelon Expected in August 2012 - 172<br />
Generic Clarinex Expected in january 2012 169 206<br />
Generic Geodon Expected in Mar 2012 225 1,100<br />
Generic Lipitor Expected in June 2012 917<br />
Total 12,889 7,598<br />
Source: Company/MOSL<br />
Import alert for Mexico facility to temper core performance<br />
DRL's Mexico facility recently received a warning letter and subsequently an import alert<br />
from the US FDA. This is the fallout of the US FDA inspection done in November 2010<br />
wherein it issued 12 observations. Of these, DRL was able to resolve 8. However, the US<br />
FDA has issued a warning letter for the remaining four deviations.<br />
The warning letter has identified the following cGMP lapses at this facility: non-validation<br />
of analytical methods to test APIs, incomplete cleaning validation for some manufacturing<br />
equipment, out-of-specification investigations data did not include analysis of all available<br />
data, and lack of responsibility of the quality unit to ensure API manufactured were in<br />
compliance with GMP.<br />
This facility generates annual revenue of ~USD65m, of which ~USD30m is from Naproxen,<br />
which is not included in the import alert. DRL can continue to supply this product to its<br />
customers. Supply of remaining products (contributing ~USD35m in revenue) will have to<br />
be suspended till the import alert is resolved. These are low-margin products for DRL,<br />
with gross margins of 25-30%, implying EBITDA hit of USD8m-10m on annual basis.<br />
Our estimates factor in the impact of this development for DRL.<br />
Germany: Cost structure aligned for a pure generic model<br />
Over the past three years, DRL has significantly altered its German operations through<br />
cost cutting to align it with the low-margin pure generic market. While the high cost<br />
acquisition of Betapharm seems to have been mistimed, we believe that, contrary to past<br />
trend, the German operations will not be a drag on the company's PAT in the coming<br />
years.<br />
August 2011 125
Dr Reddy's<br />
Financials and valuations : Dr Reddy's<br />
Income Statement<br />
(INR Million)<br />
Y/E March 2010 2011 2012E 2013E<br />
Net Sales 70,277 74,693 81,754 90,323<br />
Change (%) 1.2 6.3 9.5 10.5<br />
Other Income 617 1,115 493 549<br />
Total Expenditure 56,075 59,073 66,384 72,259<br />
EBITDA 14,202 15,620 15,370 18,065<br />
Margin (%) 20.2 20.9 18.8 20.0<br />
Deprec. & Amortization 12,763 4,107 4,555 4,845<br />
EBIT 1,439 11,513 10,814 13,220<br />
Net Interest Exp 75 132 806 712<br />
Forex (Gains)/Losses -72 57 -158 0<br />
PBT & EO Expense 2,053 12,439 10,659 13,057<br />
Change (%) -151.4 505.9 -14.3 22.5<br />
PBT after EO Expense 2,053 12,439 10,659 13,057<br />
Tax 985 1,403 1,706 2,089<br />
Tax Rate (%) 48.0 11.3 16.0 16.0<br />
Reported PAT 1,068 11,036 8,953 10,968<br />
Adjusted Net Profit 1,068 11,099 11,615 13,725<br />
Change (%) -120.7 939.2 4.6 18.2<br />
Margin (%) 1.5 14.9 14.2 15.2<br />
Balance Sheet<br />
(INR Million)<br />
Y/E March 2010 2011 2012E 2013E<br />
Equity Share Capital * 844 846 846 846<br />
Reserves 42,071 45,144 50,712 57,679<br />
Net Worth 42,915 45,990 51,558 58,525<br />
Loans 14,695 23,572 23,572 23,572<br />
Deferred Liabilities/Tax 1,438 87 87 87<br />
Capital Employed 59,048 69,649 75,217 82,184<br />
Net Fixed Assets 22,769 29,955 38,755 43,155<br />
Investments 3,843 309 -1,191 -1,191<br />
Goodwill/Intangible Assets 13,973 15,246 15,246 15,246<br />
Curr. Assets 38,463 47,560 42,028 45,748<br />
Inventory 13,371 16,059 15,533 16,258<br />
Account Receivables 11,960 17,615 14,716 15,355<br />
Cash and Bank Balance 6,584 5,729 5,647 7,361<br />
Others 6,548 8,157 6,132 6,774<br />
Curr. Liability & Prov. 20,000 23,421 19,621 20,774<br />
Account Payables 9,322 8,480 8,993 9,936<br />
Other Current Liabilities 10,678 14,941 10,628 10,839<br />
Net Current Assets 18,463 24,139 22,407 24,974<br />
Appl. of Funds 59,048 69,649 75,217 82,184<br />
* IFRS reporting from FY09 onwards. Financials prior to FY09 are as<br />
per US GAAP<br />
E: MOSL Estimates<br />
Ratios<br />
Y/E March 2010 2011 2012E 2013E<br />
Basic (INR)<br />
EPS 6.3 65.6 68.6 81.1<br />
Cash EPS 81.9 89.9 95.6 109.7<br />
BV/Share 254.2 271.8 304.7 345.9<br />
DPS 0.8 8.2 8.6 10.1<br />
Payout (%) 28.2 29.2 29.2 29.2<br />
Valuation (x)<br />
P/E 22.0 21.1 17.8<br />
Cash P/E 16.1 15.1 13.2<br />
P/BV 5.3 4.7 4.2<br />
EV/Sales 3.5 3.2 2.9<br />
EV/EBITDA 16.7 17.1 14.4<br />
Dividend Yield (%) 0.6 0.6 0.7<br />
Return Ratios (%)<br />
RoE 2.5 24.1 22.5 23.5<br />
RoCE 2.6 16.7 15.4 17.0<br />
Working Capital Ratios<br />
Fixed Asset Turnover (x) 3.2 2.8 2.4 2.2<br />
Debtor (Days) 62 86 66 62<br />
Inventory (Days) 69 78 69 66<br />
Working Capital (Days) 62 90 75 71<br />
Leverage Ratio<br />
Current Ratio (x) 1.9 2.0 2.1 2.2<br />
Debt/Equity (x) 0.3 0.5 0.5 0.4<br />
Cash Flow Statement<br />
(INR Million)<br />
Y/E March 2010 2011 2012E 2013E<br />
Op. Profit/(Loss) before Tax 14,202 15,620 15,370 18,065<br />
Interest/Dividends Recd. 614 926 -155 -163<br />
Direct Taxes Paid -985 -1,403 -1,706 -2,089<br />
(Inc)/Dec in WC 3,629 -6,531 1,650 -853<br />
CF from Operations 17,460 8,612 15,159 14,959<br />
CF from Oper. incl EO Exp.17,460 8,612 15,159 14,959<br />
(inc)/dec in FA -6,182 -12,566 -13,355 -9,245<br />
(Pur)/Sale of Investments -3,113 3,534 1,500 0<br />
CF from Investments -9,295 -9,032 -11,855 -9,245<br />
Change in networth 103 -4,726 0 0<br />
(Inc)/Dec in Debt -5,006 8,877 0 0<br />
Other Items -1,973 0 0 0<br />
Dividend Paid -301 -3,235 -3,386 -4,001<br />
CF from Fin. Activity -7,177 916 -3,386 -4,001<br />
Inc/Dec of Cash 988 496 -82 1,713<br />
Add: Beginning Balance 5,596 6,584 5,729 5,647<br />
Closing Balance 6,584 7,080 5,647 7,360<br />
Note: Reported cashflow differs due to acquisitions & change to IFRS<br />
reporting from FY09 onwards<br />
August 2011 126
Domestic Formulations | <strong>New</strong> Peaks<br />
This page is<br />
left blank<br />
intentionally<br />
August 2011 127
Domestic Formulations | <strong>New</strong> Peaks<br />
MEDICINES<br />
MEDICINES CAPSULE Score<br />
49/100<br />
Needs to improve returns ratios<br />
Glenmark Pharma<br />
CMP: INR318<br />
GNP IN<br />
TP: INR310 Neutral<br />
M: Mix 2/10<br />
Acute therapeutic segments such as dermatology,<br />
AI and respiratory segments dominate the sales<br />
mix, contributing 76% of the company's revenue.<br />
Glenmark has been trying to expand its presence<br />
in chronic therapy segments.<br />
Over the past 10 years, Glenmark has tried to<br />
diversify its therapeutic mix as the contribution to<br />
revenue from the respiratory, gastro and<br />
dermatology segments has fallen significantly.<br />
E: Equity with doctors 3/10<br />
Glenmark lags other leading companies when it<br />
comes to brand equity among doctors.<br />
The only therapeutic segment in which Glenmark<br />
has made its mark is dermatology, in which it ranks<br />
second in the industry, with market share of 11.5%.<br />
However, Glenmark has gradually improved its<br />
prescription ranking in the gynecology and CVS<br />
segments over the past four years.<br />
D: Distribution & reach 5/10<br />
Glenmark has better distribution in metros and tier-<br />
I cities as it derives 70% of the revenue from such<br />
areas, which is above average compared with the<br />
industry.<br />
Distribution in metros has increased significantly<br />
over time while the contribution of other geographies<br />
to revenue has fallen.<br />
I: Introductions 6/10<br />
Glenmark has launched fewer new products<br />
compared with some of its peers.<br />
It launched 26 new products annually over the past<br />
four years.<br />
Glenmark's revenue growth is led by both existing<br />
products new launches over the past four years.<br />
Glenmark has a field force of 2,078 MRs.<br />
Stock info<br />
Equity Shares (m) 269.8<br />
52-Week Range (INR) 390/242<br />
1,6,12 Rel. Perf. (%) 10/22/20<br />
M.Cap. (INR b) 85.8<br />
M.Cap. (USD b) 1.9<br />
Financial & valuation summary<br />
Year Net Sales PAT EPS EPS P/E P/BV RoE RoCE EV/ EV/<br />
End (INR m) (INR m) (INR) Gr. (%) (x) (x) (%) (%) Sales EBITDA<br />
03/10A 24,616 3,310 11.6 174.9 27.3 3.6 14.1 12.7 4.2 17.3<br />
03/11A 29,491 3,548 12.5 7.2 25.5 4.2 17.4 13.4 3.6 17.7<br />
03/12E 37,007 4,584 16.1 29.2 19.7 3.2 17.0 15.3 2.8 10.4<br />
03/13E 40,693 5,612 19.7 22.4 16.1 2.6 17.1 16.3 2.5 11.1<br />
Background<br />
Glenmark is one of the second tier integrated pharmaceutical companies which has differentiated itself<br />
through its success in NCE research. The company has pipeline of 5 Novel drugs in different phases of<br />
clinical studies. It is also one of the leading Indian generic companies in US with focus on niche generics<br />
segments. Glenmark has reasonable presence in semi-regulated markets.<br />
August 2011 128
Glenmark Pharma<br />
CEO Profile<br />
CEO<br />
Glenmark was founded by Mr. Gracias Saldanha (Founder & Chairman Emeritus) and is being currently<br />
managed by Mr. Glenn Saldanha (CMD). Developing a strong NCE pipeline coupled with expanding<br />
presence in the US and emerging markets are the key achievements. It is the most successful NCE<br />
research company from India till date.<br />
C: CAGR and scale-up 6/10<br />
Glenmark has outperformed the average industry<br />
growth with revenue CAGR of 18.6% over FY05-<br />
11. The company scaled up its business rapidly<br />
albeit on a very low base.<br />
We expect Glenmark to post revenue CAGR of<br />
17% over FY11-13, outperforming the industry, given<br />
its low base and aggressive focus on driving growth<br />
in this business.<br />
I: Improvement in productivity 5/10<br />
Glenmark has shown marginal increase in MR<br />
productivity over the past six years.<br />
Glenmark's MR growth was 14.2% compared with<br />
revenue growth of 17.3%, indicating improved<br />
productivity.<br />
Revenue per MR improved from INR3.1m in 2004<br />
to INR3.6m in 2010. At this level productivity is in<br />
line with average.<br />
N: Non-domestic business 3/10<br />
We are neutral on Glenmark's international<br />
business despite its ramp-up in emerging markets<br />
due to the low return ratios in these markets.<br />
We expect international formulation business to<br />
record 17% CAGR over FY11-13.<br />
E: Earnings growth 7/10<br />
We expect topline of 18.3% CAGR over FY11-13<br />
leading to EPS CAGR of 25.8%.<br />
Reduction in interest costs in the long-term will<br />
partly drive earnings growth.<br />
Option values include potential NCE out-licensing<br />
and the launch of Crofelemer in some emerging<br />
markets.<br />
S: Stock Attractiveness 10/20<br />
Return ratios have been muted due to the workingcapital<br />
intensive nature of Glenmark's operations.<br />
Glenmark is valued at 19.7x FY12E and 16.1x<br />
FY13E consolidated earnings.<br />
Stock performance (1 year)<br />
Glenmark Pharma<br />
400<br />
350<br />
Sensex - Rebased<br />
Maintain Neutral with a target price of INR310 (15x<br />
FY13E EPS plus DCF value of Crofelmer and Para<br />
IV products).<br />
300<br />
250<br />
200<br />
Aug-10 Nov-10 Feb-11 May-11 Aug-11<br />
August 2011 129
Glenmark Pharma<br />
India formulations<br />
snapshot<br />
Domestic formulations<br />
contribute ~30% to revenue<br />
The domestic formulations<br />
business, which contributed<br />
30% to Glenmark's revenue in<br />
FY11 and an estimated 27% to<br />
EBITDA, is a leading<br />
contributor to Glenmark's topline<br />
and profitability.<br />
Interestingly, unlike other<br />
leading generic companies,<br />
Glenmark's profitability from<br />
the domestic formulations<br />
business is lower than from its<br />
regulated market generics<br />
business.<br />
EBITDA Contribution<br />
Non-DF<br />
EBITDA 73%<br />
DF EBITDA<br />
27%<br />
Needs to improve return ratios<br />
Ranks 25th in the domestic market<br />
Glenmark is a niche player in the domestic formulations segment with strong presence in a<br />
few niche therapeutic areas like dermatology. It ranks twenty-fifth in the industry with market<br />
share of 1.53%. The company has been gradually increasing its presence in chronic therapy<br />
areas. Glenmark is among the few companies to have improved the productivity of its<br />
workforce over the years.<br />
1. Mix: 2/10<br />
Acute therapeutic segments account for 76% of revenue; dermatology, CVS,<br />
AI, respiratory segments dominate sales<br />
Acute therapeutic segments, in which Glenmark has 76% market share, dominate<br />
Glenmark's sales mix. The top four therapeutic segments, including dermatology, CVS, AI<br />
and respiratory segments, account for about 76% of Glenmark's domestic formulation<br />
revenue. Its top therapy segment, dermatology, contributes 29% to total revenue. Over<br />
the past 10 years, the contribution of CVS and AI segments increased while that of<br />
respiratory, gastro and dermatology segments fell. Glenmark has been trying to expand its<br />
presence in chronic segments.<br />
Glenmark ranks twentyfifth<br />
in the domestic<br />
formulations segment<br />
Glenmark ranks twenty-fifth in<br />
the domestic formulations<br />
market and has a market share<br />
of 1.53%. However, over the<br />
past five years, the company<br />
improved its market share from<br />
1.26% in 2006 to 1.53%<br />
currently. Over the past six<br />
years, Glenmark's revenue<br />
posted 19% CAGR and the<br />
industry posted 14% CAGR.<br />
Glenmark has improved<br />
market share over the last<br />
5 years<br />
Acute segments contributes 76% to the revenue<br />
GI<br />
10%<br />
Gynae<br />
cology<br />
9%<br />
Pain<br />
4%<br />
Diabetes<br />
0%<br />
Pain 6%<br />
Diabetes 6%<br />
Others<br />
7%<br />
Respira<br />
tory<br />
22%<br />
Gynaec 5%<br />
FY01<br />
AI<br />
11%<br />
GI 3%<br />
Derma<br />
tology<br />
37%<br />
CVS<br />
0%<br />
FY11<br />
Others 6%<br />
Gynaeco<br />
logy<br />
5%<br />
Pain<br />
13%<br />
Diabetes<br />
8%<br />
GI<br />
7%<br />
Respirat<br />
ory<br />
15%<br />
FY05<br />
Others<br />
3%<br />
AI<br />
11%<br />
Dermatology 28%<br />
Dermatol<br />
ogy<br />
33%<br />
CVS<br />
5%<br />
21.8<br />
Mkt Share (%)<br />
Grow th (%)<br />
20.1 18.5 17<br />
25.9<br />
AI 14%<br />
1.26<br />
1.3<br />
1.4<br />
1.5<br />
1.5<br />
2006 2007 2008 2009 2010<br />
Respiratory 15%<br />
CVS 17%<br />
Source: Company/Industry/MOSL<br />
August 2011 130
Glenmark Pharma<br />
2. Equity with doctors: 3/10<br />
Glenmark lags in terms of brand equity except in dermatology<br />
Glenmark lags leading companies covered in this report in terms of brand equity. The only<br />
therapeutic segment in which Glenmark made its mark is dermatology, in which it ranks<br />
second in the industry with market share of 11.5%. In the respiratory segment, Glenmark<br />
ranks ninth with market share of 2.8%.<br />
Market share in key therapies (%) Growth comparison (%) (2010)<br />
11.5<br />
Avg Gr - Company<br />
Avg Gr - Industry<br />
25.4<br />
18.3<br />
16.2<br />
18.4<br />
2.8<br />
Respiratory<br />
Dermatology<br />
Respiratory<br />
Dermatology<br />
* Average growth over 2009-2010 Source: Industry/MOSL<br />
Glenmark has maintained its strong brand equity in the dermatology segment over the<br />
years with prescription ranking of No2 and 8% of the prescription market share. It has<br />
improved its prescription ranking in the gynecology and CVS segments over the past four<br />
years.<br />
Glenmark's prescription ranking<br />
Jan-07 Jan-08 Jan-09 Jan-10 Oct-10<br />
Derma 2 2 2 2 2<br />
Anti-diabetic 9 9 9 10 10<br />
Gynaec 16 12 9 11 8<br />
Respiratory 11 11 14 13 13<br />
CVS - 24 21 20 17<br />
Anti-infectives - 23 23 20 23<br />
Source: Industry/MOSL<br />
August 2011 131
Glenmark Pharma<br />
3. Distribution and reach: 5/10<br />
Glenmark derives 70% of its revenue from metros and class-I towns against the industry<br />
average of 63%. Over the past four years revenue CAGR for all geographies except rural<br />
areas has been better than that of the industry average.<br />
Glenmark: Geographical distribution of revenues (%) Geographical distribution of revenues: Industry (%)<br />
Metros Class I Tow ns Class II to VI Rural<br />
19.3 20.3 18.3 15.5 14.3<br />
18.3 17.2 16.0 15.4 15.6<br />
25.7<br />
25.5 26.7<br />
30.2 28.3<br />
32.2 34.2 40.0 43.6 43.5<br />
Metros Class I Tow ns Class II to VI Rural<br />
20.6 20.9 20.0 18.1 17.3<br />
19.2 19.0 19.5 19.4 19.6<br />
32.6 31.3 31.6 32.5 32.0<br />
27.6 28.9 28.9 30.0 31.0<br />
CY06 CY07 CY08 CY09 CY10<br />
CY06 CY07 CY08 CY09 CY10<br />
Glenmark: Geography-wise growth rates (%) Industry: Geography-wise growth rates (%)<br />
Metros Class I Tow ns Class II to VI Rural<br />
38.4<br />
31.5<br />
27.7<br />
27.5<br />
27.1<br />
26.4<br />
25.7<br />
16.3<br />
12.5<br />
7.5<br />
15.8<br />
12.5<br />
12.7<br />
7.1<br />
10.5<br />
-1.1<br />
CY07 CY08 CY09 CY10<br />
Metros Class I Tow ns Class II to VI Rural<br />
26.2<br />
23.5<br />
17.6<br />
17.5<br />
17.7<br />
20.7<br />
15.6<br />
17.5<br />
14.0<br />
16.4<br />
11.1<br />
14.7<br />
13.0<br />
7.9<br />
9.5<br />
2.5<br />
CY07 CY08 CY09 CY10<br />
Source: Industry/MOSL<br />
4. Introductions: 6/10<br />
Glenmark's revenue growth from new launches has been gradually<br />
declining over the past few years<br />
Glenmark's revenue growth was led mainly by new launches in CY07, CY08 and CY09<br />
but in CY10 the contribution of existing brands to revenue growth was higher than that of<br />
new launches. Glenmark launched 26 new products annually on average over the past<br />
four years. Average revenue per new launch has risen over the past four years from<br />
INR66m to INR90m.<br />
August 2011 132
Glenmark Pharma<br />
Glenmark: <strong>New</strong> launches Glenmark: Growth composition (%)<br />
No. Of launches in last 2 yrs<br />
Avg sales per launch (INR m)<br />
<strong>New</strong> Launches<br />
Existing Brands<br />
98.3<br />
96.7<br />
90.3<br />
65.7<br />
8.7 5.6<br />
7.5<br />
17.2<br />
57 52 46 53<br />
11.4<br />
12.9<br />
9.5 8.7<br />
CY07 CY08 CY09 CY10<br />
CY07 CY08 CY09 CY10<br />
Source: Industry/MOSL<br />
5. CAGR and scale up: 8/10<br />
Glenmark posted domestic formulation revenue CAGR of 19% over FY05-11, much faster<br />
than the industry average. We believe the company can sustain its out-performance of the<br />
industry by changing its therapeutic mix in favor of chronic therapeutics segments and<br />
consistent improvement in workforce productivity. We expect Glenmark's domestic<br />
formulations business to post 17% CAGR over FY11-13 against the industry's 15-16%<br />
CAGR.<br />
Glenmark: domestic formulations performance<br />
DF revenue (INR m) Grow th (%)<br />
27.1<br />
16.8<br />
18.1<br />
18.0<br />
16.0<br />
9.0<br />
12.2<br />
3,937<br />
4,290<br />
5,454<br />
6,372<br />
7,529<br />
8,447<br />
9,967<br />
11,562<br />
FY06 FY07 FY08 FY09 FY10 FY11 FY12E FY13E<br />
Source: Company/MOSL<br />
6. Improvement in MR productivity: 5/10<br />
Glenmark's above-average MR productivity leads growth<br />
Glenmark's revenue from the domestic formulations business grew at 17.3% CAGR over<br />
FY04-10 and its sales force strength increased by 14.2% CAGR, implying improvement<br />
in salesforce productivity. Glenmark's MR productivity improvement is visible from the<br />
fact that, in 2004, Glenmark derived sales of INR3.1m per MR, which went up to INR3.6m<br />
in FY10.<br />
August 2011 133
Glenmark Pharma<br />
Glenmark: Salesforce productivity<br />
No. of MRs Revenue per MR (INR m)<br />
Sales force addition CAGR (%)<br />
Productivity Improvement CAGR (%)<br />
3.6<br />
3.1<br />
14.2<br />
11.5<br />
936 2,078<br />
2004 2010<br />
2.7<br />
Glenmark<br />
1.9<br />
Industry<br />
Source: Company/Industry/MOSL<br />
7. Non-domestic business snapshot: 3/10<br />
Positives<br />
• Trying to build a differentiated portfolio in the US by targeting niche segments of<br />
dermatology, oral contraceptive and controlled substances.<br />
• One of the most successful NCE players from India despite setbacks on some NCEs.<br />
Glenmark has generated upfront and milestone income of USD187m from NCEs so<br />
far.<br />
• Glenmark is gradually ramping up its presence in emerging markets.<br />
Risks and concerns<br />
• Working capital intensive operations, especially in emerging markets<br />
• NCE out-licensing has become difficult and time-consuming, which may lead to higher<br />
R&D expenses in coming years.<br />
Key news flows/triggers<br />
• Stoppage of Oxycodone supplies by other generic players in the US will make Glenmark<br />
the sole player.<br />
• Launch of Calcipotriene ointment in the US makes Glenmark the sole supplier.<br />
• Launch of generic Malarone in the US under agreement with GSK.<br />
• Signing of NCE out-licensing deals with MNCs.<br />
Impact assessment<br />
• We are neutral on Glenmark's international business given the working capital<br />
intensiveness of its emerging market business.<br />
• We expect the international formlation business to record 17% CAGR for FY11-13.<br />
• Option values include potential NCE out-licensing and the launch of Crofelemer in<br />
some emerging markets.<br />
August 2011 134
Glenmark Pharma<br />
Sales mix (INR m)<br />
FY09 FY10 FY11 FY12E FY13E FY11-13E<br />
CAGR (%)<br />
Formulations 19,188 21,989 25,259 30,821 35,907 19.2<br />
Branded 11,303 14,116 15,963 19,163 22,188 17.9<br />
India 6,372 7,529 8,447 9,967 11,562 17.0<br />
Europe-branded 996 1,363 1,528 1,669 1,795 8.4<br />
Latam-branded 1,580 1,361 1,919 2,478 2,908 23.1<br />
Semi-regulated mkts 2,355 3,864 4,070 5,048 5,923 20.6<br />
Generics 7,885 7,873 9,296 11,658 13,719 21.5<br />
Latin America 400 343 401 478 561 18.3<br />
North America 7,338 7,230 8,352 10,370 12,168 20.7<br />
Europe 147 299 544 810 990 35.0<br />
API 1,972 2,627 3,337 3,610 4,026 9.8<br />
NCE Income 0 0 895 2,475 660<br />
Gross Sales 21,160 24,616 29,491 36,906 40,592 17.3<br />
EBITDA Contribution<br />
Non-DF<br />
EBITDA<br />
73%<br />
DF<br />
EBITDA<br />
27%<br />
Source: Company/MoSL<br />
8-9. Earnings growth and stock attractiveness: 17/30<br />
Sustaining growth in existing businesses and funding of NCE research expenses has resulted<br />
in high leverage for Glenmark. Debt has particularly increased after the credit crisis of<br />
FY09 and has not reduced significantly since. We believe the key determinant for Glenmark's<br />
valuations will be its ability to de-leverage without sacrificing growth traction. High debt<br />
and high working capital are our key concerns for Glenmark.<br />
Expect 26% EPS CAGR over FY11-13: We expect Glenmark to record 18.3% topline<br />
CAGR over FY11-13 led by 17.1% CAGR in the generic business and 18% CAGR in<br />
branded generic business. EPS CAGR is estimated at 26% over FY11-13. Glenmark has<br />
differentiated itself among Indian pharmaceutical companies through its success in NCE<br />
research (resulting in licensing income of USD187m so far). Given this success, Glenmark<br />
has been aggressive in adding new NCEs to its pipeline, which will put pressure on its<br />
operations in the short to medium term as it will have to fund R&D expenses for these<br />
NCEs on its own until they are out-licensed. High interest costs and likely absence of<br />
strong forex gains will temper down the strong operational performance for FY12. Low<br />
return ratios is our main concern. The stock is valued at 19.7x FY12E and 16.1x FY13E<br />
earnings. Maintain Neutral with a target price of INR310 (15x FY13E EPS+ DCF value<br />
of INR14 for Para-IV pipeline and crofelemer).<br />
Glenmark Pharma RoE & RoCE (%)<br />
Glenmark Pharma one year forward PE<br />
RoE RoCE<br />
17.4 17.0 17.1<br />
14.1<br />
15.3<br />
16.3<br />
12.7 13.4<br />
8.0<br />
7.0<br />
2009 2010 2011 2012E 2013E<br />
160<br />
120<br />
80<br />
40<br />
0<br />
Aug-06<br />
P/E (x) Avg(x) Peak(x) Min(x)<br />
137.7<br />
37.4<br />
18.4<br />
13.1<br />
Mar-07<br />
Aug-07<br />
Feb-08<br />
Aug-08<br />
Feb-09<br />
Aug-09<br />
Feb-10<br />
Aug-10<br />
Feb-11<br />
Aug-11<br />
August 2011 135
Glenmark Pharma<br />
Glenmark non-domestic business: key trends, triggers & risk<br />
Trying to build a differentiated portfolio in the US<br />
Glenmark is focusing on filing products in the niche segments of dermatology, controlled<br />
substances and hormones for the US market. This coupled with a few FTF filings are<br />
expected to be key growth drivers for the US business. However, we are cautious about<br />
these product categories given the complexities of manufacturing and the stretched US<br />
FDA approval time-lines for ANDA approvals. We estimate Glenmark's US portfolio (exupsides<br />
from one-off FTF opportunities) to post revenue of 21% CAGR over FY11-13.<br />
ANDAs filed/marketed (includes partner filings)<br />
As of 31 March 2009 As of 31 March 2010 As of 31 March 2011<br />
Dermatology 18 20 21<br />
Controlled substance 6 9 3<br />
Modified release 2 6 9<br />
Hormones 7 15 15<br />
Para-IV FTF 9 9 13<br />
Normal generics 45 46 48<br />
Total 87 105 109<br />
Source: Company/MOSL<br />
Para-IV pipeline not significant<br />
Unlike some of its peers, Glenmark has not focused on developing a strong patent challenge<br />
pipeline for the US. It has a pipeline of six Para-IV products (of which five are FTFs)<br />
targeting an innovator market size of USD2.3b.<br />
Glenmark: Para IV pipeline<br />
Product Indication Brand Innovator Market Status<br />
Size<br />
(USD m)<br />
Ezetimibe Cholesterol Zetia Schering 1500 Has tentative approval with FTF. Sued on 22-Mar-07. 30-month<br />
(Merck)<br />
stay period expired in Oct-2010. Court case started in May-10. Signed<br />
licensing & cost-sharing deal with Par Pharma on 04-May-10 for small<br />
upfront payment. Par to share risks/costs of litigation as well as profits.<br />
Settled out-of-court with innovator. Launch scheduled on 12-Dec-2016<br />
Tradolapril + Anti- Tarka Abbott/ 58 Glenmark is FTF and was sued on 07-Dec-07. 30-month stay expired in<br />
Verapamil hypertensive Sanofi May-2010. Received final approval on 10-May-2010. Innovator's summary<br />
motion rejected. Glenmark launched "at-risk" in Jun-10; Federal Jury ruled<br />
against Glenmark in Jan-2011 and awarded Abbott USD16m in damages<br />
post which Glenmark has stopped further sales. District Court Judge's ruling<br />
will determine the final outcome with losing party having right to appeal to<br />
the Federal Circuit Court<br />
Fluticasone Dermatology Cutivate Nycomed 48 Glenmark seems the FTF. Sued on 12-Dec-08. Received final approval<br />
lotion 0.005%<br />
on 02-May-2011. Settled out-of-court with Nycomed for potential launch<br />
in Mar-2012. Glenmark will pay mid-teens royalty to Nycomed. Only one<br />
other generic filing till date<br />
Atovaquone Anti-malarial Malarone GSK 58 Glenmark has FTF. GSK sued Glenmark on 17-Aug-09. Settled out-of-court<br />
Proguanil HCl<br />
on 12-Apr-10. Launch scheduled in Sep-2011 with 180-day exclusivity. No<br />
250mg/100mg tablets<br />
AzG. Glenmark seems to be the only filer till and date<br />
Oxycodone NA Pre-1938 13 Not an FTF product. Glenmark's partner Lehigh Valley Tech (LVT)<br />
Hydrochloride product has filed NDA with US FDA since it is a pre-1938 product. NDA<br />
Capsules &<br />
approval awaited. If successfully approved all other generic players<br />
Liquid Solution<br />
will have to file ANDAs referencing Glenmark's product & hence<br />
could give Glenmark ~18 months of indirect exclusivity. Product has<br />
to be manufactured in the US as it is a controlled substance<br />
August 2011 136
Glenmark Pharma<br />
Glenmark: Para IV pipeline<br />
Product Indication Brand Innovator Market Status<br />
Size<br />
(USD m)<br />
Calcipotriene Dermatology Dovonex Leo Pharma 93 Leo Pharma discontinued marketing in 2007 when annual revenues were<br />
ointment<br />
USD93m as it planned to shift prescriptions to a combination but has not<br />
been successful. Glenmark currently is the only approved product on the<br />
market. It has tied up with Taro exclusively for branding & promoting the<br />
product. Current revenue run-rate will be much lower than USD93m (likely to<br />
be USD25m for FY11) as the product has not been promoted for the past 3<br />
years. Glenmark to receive small milestone income prior to launch & then<br />
royalty on Taro's sales. Royalty will be minimum 30%<br />
Eszopiclone Insomnia Lunesta Sunovion 787 Settled with Sepracor on 9th Aug 2010. As per settlement Glenmark<br />
tablets can launch after 30-Nov-2013, which is 2.5months prior to the expiry of '673<br />
patent, or after 30-May-2014 if Sepracor obtains pediatric exclusivity. Other<br />
Para IV filers are Teva, DRL, Cobalt, Orchid, Lupin, Roxane, Wockhardt and<br />
Sun. Settled with Lupin, Wockhardt, Cobalt and Teva. Received tentative<br />
approval on 22- Dec-10<br />
Hydrocortisone Eczema Locoid Astellas 38 Glenmark has FTF. Sued on 04-Nov-10. The 30-month stay expires in May-<br />
Butyrate (Dermatology) Lipo- /Triax 2013. Patent expires on 03-Jun-2014. Settled out-of-court on 25-May-2011<br />
cream<br />
with launch scheduled in 3QFY12. There will be no AzG, but Glenmark will<br />
have to pay royalty to the innovator. Royalty amount/ percentage not disclosed<br />
Rosuvastatin Cholesterol Crestor AstraZeneca 3600 Glenmark not sued till date. The '314 patent expiring in 2016 has been upheld<br />
Calcium<br />
by court. Astra sued 8 generic players in Apr-10 for the '152 patent expiring<br />
on 02-apr-2018 and '618 patent expiring on 17-Dec- 2021. Glenmark's 30-<br />
month stay expires in Nov-2012. Patent litigation is on. No timelines known<br />
Atomoxetine Attention- Strattera Eli Lilly 530 9 generic players have FTF status alongwith Glenmark. Many generic filings<br />
HCl Deficit/ with Para-IV status - Teva, Sandoz, Actavis, Mylan, Glenmark, Cadila, Apotex,<br />
Hyperactivity<br />
Aurobindo, Synthon. DRL has tentative approval<br />
(ADHD)<br />
Fluocinonide Dermatology Vanos Medicis 30 Perriogo seems to be the FTF. Other generic players with Para-IV filings<br />
include Glenmark, Taro & Nycomed. Perrigo has settled with launch scheduled<br />
in Dec-2013. Glenmark & Taro have also settled with launch scheduled in<br />
Dec-2013. Glenmark's 30-month stay expires in Nov-2011<br />
Source: Company/MOSL<br />
Tarka has witnessed negative news flow<br />
On 15 January 2011, a US jury ruled against Glenmark on one of the contentions of the<br />
patent litigation for generic Tarka (a USD58m brand) at a US District Court (lower court).<br />
The federal jury rejected Glenmark's challenge to the validity of a Sanofi patent that<br />
expires in February 2015. Glenmark had argued that the patent covered an invention that<br />
was protected by an expired patent.<br />
Abbott markets the drug in the US and sought USD25m as compensation from Glenmark<br />
and the US jury awarded damages of USD16m. The District Court judge will now have to<br />
either accept or reject the jury ruling on this aspect of invalidation and give a ruling on<br />
other aspects of the case. The final outcome of the case will depend on what the judge<br />
rules on all the aspects of the case (the ruling is expected in next few weeks).<br />
August 2011 137
Glenmark Pharma<br />
Glenmark undertook an "at-risk" launch of generic Tarka in the US in June 2010. Glenmark<br />
generates US$5m in revenue per quarter from generic Tarka with about 55% PAT margins<br />
resulting in USD2.75m PAT per quarter. For FY11, we estimated one-time PAT of USD8m<br />
from this opportunity for Glenmark. The jury ruling implies potential damages of USD16m<br />
which Glenmark will have to pay Abbott if it loses the case. Glenmark has temporarily<br />
halted sales of generic Tarka until the District Court judge gives a ruling.<br />
Identifying niche opportunities in the US<br />
Besides Para-IV filings, identifying niche, low-competition opportunities in the US is a key<br />
focus area of Glenmark's US strategy. It has met with some success in this strategy with<br />
Oxycodone and Calcipotriene.<br />
(A) Oxycodone<br />
Glenmark's US partner, Lehigh Valley Technologies (LVT), received NDA approval for<br />
Oxycodone 5mg capsule and 100mg/5mL oral solution in June 2010. LVT will make the<br />
product and while Glenmark will have exclusive distribution rights for these dosages in the<br />
US (market size of USD13m/year).<br />
Background to the NDA filing<br />
Since Oxycodone is a pre-1938 product all generic players launched their generic versions<br />
in the US without US FDA approvals. The US FDA has been gradually trying to get the<br />
products approved. As part of this process, LVT filed an NDA for the 5mg capsules and<br />
100mg/5mL oral solution with the US FDA, which has been approved.<br />
As per US FDA guidelines, a successful NDA approval will force the remaining generic<br />
companies to withdraw from the market and re-file their products with reference to LVT's<br />
approved NDA. The US FDA will issue a warning letter to the remaining generic players<br />
to withdraw their versions from the market after it is convinced that it will not lead to drug<br />
shortages and that Glenmark/LVT will be able to meet the demand.<br />
US FDA approval time-lines for ANDAs is approximately for 18-24 months. This will<br />
result in Glenmark/LVT being the only approved Oxycodone player in the market for the<br />
next 24 months.<br />
Sole player - may be able to raise prices<br />
Being the sole player in the market, Glenmark/LVT will enjoy indirect exclusivity for the<br />
dosages until other generic players receive new approvals. This product will qualify as a<br />
niche (high margin) opportunity targeted by Glenmark in the US market. Absence of other<br />
generic players (for ~24 months) will give it an opportunity to raise prices of Oxycodone,<br />
enhancing the size of the opportunity to US$25m-30m over the next 12 months.<br />
(B) Calcipotriene<br />
Glenmark is the only US FDA approved player in the Calcipotriene ointment market. Leo<br />
Pharma discontinued marketing in 2007 when annual revenue was USD93m as it planned<br />
to shift prescriptions to a combination of Calcipotriene & Betamethasone but has not been<br />
successful.<br />
Glenmark is the only approved product on the market. It has tied up with Taro exclusively<br />
to brand and promote the product. Current revenue run-rate will be lower than US$93m<br />
(likely to be USD25m) as the product has not been promoted over the past three years.<br />
August 2011 138
Glenmark Pharma<br />
We expect Glenmark/Taro to launch this product in FY12. It will receive a small milestone<br />
income prior to launch and then royalty on Taro's sales. While Glenmark has not disclosed<br />
financial details of its tie-up with Taro, we believe the royalty will be fairly remunerative.<br />
Most successful NCE company from India so far<br />
Glenmark has been one of the most successful NCE companies from India, generating<br />
~USD202m in upfront and licensing income over the past decade. This is despite its being<br />
a relatively late entrant in this segment compared with the likes of Ranbaxy and Dr Reddy's.<br />
Glenmark - NCE Pipeline Snapshot<br />
Molecule Indication Clinical Trials Out-licensing Licensing Income (USD m)<br />
Partner Upfront Mile- Total Estimated<br />
stones Deal Value<br />
Melogliptin Diabetes - DPP IV Phase-IIb completed Initially Merck KgA 31 - Partner returned<br />
(GRC 8200) Inhibitor but molecule returned molecule<br />
to Glenmark<br />
Revamilast Rheumatoid Arthritis, Initiated Phase-II - - - -<br />
(GRC 4039) Asthma trials in UK, Poland,<br />
India, Czech<br />
Republic and Philippines<br />
in Aug-2011<br />
Tedalinab Neuropathic pain, Phase-I completed. - - - -<br />
(GRC 10693) Osteoarthritis and To initiate Phase-II<br />
Inflammatory pain. in FY12<br />
Initially targeted for<br />
Neuropathic pain<br />
GRC 15300 Osteoarthritis, Phase I completed Sanofi 20 - 325<br />
Neuropathic pain in UK<br />
GBR 500 Crohn's disease & Phase I completed Sanofi 50 - 613<br />
Multiple Sclerosis in US<br />
GBR 600 Acute Stroke/ To initiate Phase-I - -<br />
Coronary Syndrome, in UK<br />
Thrombosis<br />
Cardiovascular Disorders<br />
GRC 17536 Osteoarthritis, Phase I in - - -<br />
Neuropathic pain & Netherlands<br />
Respiratory disorders<br />
Oglemilast Asthma, COPD Partner stopped Forest/Teijin 16 25 Clinical development<br />
clinical development<br />
stopped<br />
post Phase-IIb<br />
GRC 6211 Osteoarthritis, Partner stopped Eli Lilly 45 Clinical development<br />
Neuropathic pain, clinical development stopped<br />
Dental pain,<br />
post Phase-IIb<br />
Incontinence<br />
Crofelemer Adult acute Completed Phase III In-licensed from 15 Glenmark holds rights<br />
infectious diarrhoea, in US and Phase IIb Napo Pharma only for 140 RoW<br />
HIV-related diarrhoea in India markets and not for<br />
regulated markets<br />
Total 177 25<br />
Source: Company/MOSL<br />
August 2011 139
Glenmark Pharma<br />
Out-licensing of NCEs imperative to control R&D costs<br />
Glenmark has a pipeline of Eight NCEs undergoing clinical development. Since NCE<br />
research has been a differentiating factor for Glenmark compared with its peers, and<br />
since it is the most successful NCE research company from India so far, the company has<br />
been prompted to aggressively add new NCEs to its pipeline. As these NCEs progress in<br />
clinical trials, they will put pressure on Glenmark's P&L in the short to medium term as it<br />
will have to fund R&D expenses for these NCEs on its own. Hence, we believe, outlicensing<br />
of some of these NCEs is imperative to control the expected increase in R&D<br />
costs.<br />
Crofelemer: Not a big opportunity<br />
Glenmark has in-licensed this NCE from Napo and holds distribution and marketing rights<br />
for 140 emerging markets. It does not hold rights for the product in regulated markets. A<br />
launch across 140 emerging markets will be phased.<br />
Glenmark has, in the past, indicated peak revenue of USD80m from this product (across<br />
unregulated markets that Glenmark will target). Revenue ramp-up will be phased from<br />
FY13/14 and is likely to take a few years.<br />
We believe the profitability of this product for Glenmark will not be very high due to:<br />
1. Relatively low profitability (compared with other NCEs) given the difficulty in<br />
manufacturing such products and lower flexibility in pricing the product since it is<br />
related to HIV.<br />
2. Payment of single-digit royalty on sales by Glenmark to Napo.<br />
3. We do not expect a big upside for Glenmark from this opportunity. We estimate the<br />
DCF value of this opportunity at INR9/share for Glenmark.<br />
Glenmark - Crofelemer DCF Valuation<br />
(USD m) FY11 FY12 FY13 FY14 FY15 FY16 FY17 FY18 FY19 FY20 FY21 FY22<br />
Total Market Size 0 0 15 75 150 255 380 380 380 80 80 80<br />
Regulated Markets 0 50 100 175 300 300 300 0 0 0<br />
Semi-regulated Markets (SRM) 15 25 50 80 80 80 80 80 80 80<br />
Glenmark - Upside from SRM<br />
Revenues 15 25 50 80 80 80 80 80 80 80<br />
EBITDA Margin (%) 30 30 30 30 30 30 30 30 30 30<br />
EBITDA 5 8 15 24 24 24 24 24 24 24<br />
Royalty to Napo at 8% of<br />
revenues (assumed) 1 2 4 6 6 6 6 6 6 6<br />
PAT 3 6 11 18 18 18 18 18 18 18<br />
Glenmark - Upside from Regulated Markets<br />
Salix/Napo's revenues 50 100 175 300 300 300 Patent Expiry<br />
Cost of API (%) 10 10 10 10 10 10<br />
Glenmark's revenue from API supplies 5 10 18 30 30 30<br />
PAT margin (%) 15 15 15 15 15 15<br />
PAT from API supplies 0.8 2 3 5 5 5<br />
Total upside for Glenmark 3 6 13 20 22 22 22 18 18 18<br />
WACC (%) 14 14 14 14 14 14 14 14 14 14<br />
Year 0 1 2 3 4 5 6 7 8 9 10 11<br />
PV of cash inflow 0 0 3 4 7 11 10 9 8 5 5 4<br />
Exchange Rate (INR/USD) 45.0 44.5 43.0 42.0 40.7 39.5 38.3 37.2 36.1 35.0 33.9 32.9<br />
PV (INR m) 0 0 109 177 302 415 386 328 279 189 161 137<br />
Total PV (INR m) 2,484<br />
Total PV per share (INR) 9<br />
Source: Company/MOSL<br />
August 2011 140
Glenmark Pharma<br />
Strong growth in emerging markets but working capital intensive<br />
Glenmark's revenue in emerging markets have grown 4x over FY05-11, albeit on a low<br />
base. These include markets like Latin America, Australasia, Africa, Russia and the CIS<br />
and parts of eastern and central Europe. Barring a slowdown in FY09, due to the credit<br />
crisis, the portfolio has been growing steadily over the years.<br />
However, we believe this growth traction has been partly achieved by expanding working<br />
capital in the business leading to increased borrowings. We believe Glenmark must strike<br />
an optimum balance between growth and working capital in these markets. We expect<br />
this portfolio to record 19% revenue CAGR over FY11-13, partly impacted by a potential<br />
rupee appreciation against the US dollar.<br />
High debt, working capital key concerns<br />
High net debt of over INR18b and net working capital of ~INR18b are key concern<br />
areas. While Glenmark is attempting to reduce its working capital requirements, we believe<br />
it may not be easy for it to reduce it significantly without sacrificing growth, resulting in<br />
slower progress on this front.<br />
Sales ramp-up v/s net working capital (INR b)<br />
Revenue (Ex-NCE income)<br />
Non Cash WC<br />
34.5<br />
40.0<br />
6.8<br />
4.6<br />
10.8<br />
7.6<br />
17.4<br />
11.7<br />
20.9<br />
15.5<br />
24.6<br />
18.0<br />
28.6<br />
16.4<br />
18.8<br />
21.1<br />
FY06 FY07 FY08 FY09 FY10 FY11 FY12E FY13E<br />
Source: Company/MOSL<br />
August 2011 141
Glenmark Pharma<br />
Financials and valuations: Glenmark Pharma<br />
Income Statement<br />
(INR Million)<br />
Y/E March 2010 2011 2012E 2013E<br />
Net Sales 24,616 29,491 37,007 40,693<br />
Change (%) 18.0 19.8 25.5 10.0<br />
Materials Consumed 8,061 9,918 11,396 13,211<br />
Personnel Expenses 3,425 5,103 5,613 6,455<br />
R&D Expenses 1,200 1,386 1,899 2,442<br />
Other Expenses 5,966 7,161 8,288 9,608<br />
Total Expenditure 18,653 23,568 27,196 31,716<br />
EBITDA 5,963 5,923 9,811 8,977<br />
Change (%) 76.4 -0.7 65.7 -8.5<br />
Margin (%) 24.2 20.1 26.5 22.1<br />
Adjusted EBITDA 5,963 5,028 7,336 8,317<br />
Margin (%) 24.2 17.6 21.2 20.8<br />
Depreciation 1,206 947 1,086 1,186<br />
EBIT 4,757 4,976 8,725 7,791<br />
Interest 1,640 1,566 1,482 1,276<br />
OI & forex gains/losses 722 1,405 562 646<br />
PBT before EO Expense 3,839 4,816 7,805 7,162<br />
Change (%) 42.8 25.4 62.1 -8.2<br />
PBT after EO Exp. 3,839 4,816 7,805 7,162<br />
Tax 529 237 994 976<br />
Tax Rate (%) 13.8 4.9 12.7 13.6<br />
Reported PAT 3,310 4,578 6,812 6,186<br />
Adj PAT** 3,310 3,548 4,584 5,612<br />
Change (%) 194.3 7.2 29.2 22.4<br />
Margin (%) 13.4 12.4 13.3 14.0<br />
** - Excl NCE upsides & incl adjustment for R&D exp capitalization<br />
Balance Sheet<br />
(INR Million)<br />
Y/E March 2010 2011 2012E 2013E<br />
Equity Share Capital 269 270 270 270<br />
Fully Diluted Eq Cap 284 284 284 284<br />
Reserves 23,282 20,102 26,678 32,549<br />
Net Worth 23,551 20,372 26,948 32,819<br />
Minority Interest 130 267 267 267<br />
Loans 18,693 21,258 18,258 15,758<br />
Deferred liabilities 710 -1081 -1081 -1081<br />
Capital Employed 43,085 40,816 44,391 47,763<br />
Gross Block 21,586 25,899 28,399 30,899<br />
Less: Accum. Deprn. 3,929 4,876 5,962 7,148<br />
Net Fixed Assets 17,656 21,023 22,437 23,751<br />
Capital WIP 6,224 1,100 1,100 1,100<br />
Investments 181 309 309 309<br />
Intangibles (net) 7,259 10,329 9,606 8,934<br />
Curr. Assets 24,210 25,988 30,608 33,643<br />
Inventory 7,085 8,070 10,407 11,483<br />
Account Receivables 10,783 11,308 12,772 13,936<br />
Cash and Bank Balance 1,069 1,959 1,752 1,535<br />
Others 5,273 4,651 5,676 6,689<br />
Curr. Liability & Prov. 5,186 7,605 10,063 11,041<br />
Account Payables 4,987 7,560 9,663 10,591<br />
Provisions 200 44 400 450<br />
Net Current Assets 19,023 18,384 20,545 22,602<br />
Appl. of Funds 43,085 40,816 44,391 47,763<br />
E: MOSL Estimates<br />
Ratios<br />
Y/E March 2010 2011 2012E 2013E<br />
Basic (INR)<br />
EPS (Fully diluted)* 11.6 12.5 16.1 19.7<br />
Cash EPS 15.9 15.8 19.9 23.9<br />
BV/Share 87.6 75.4 99.7 121.4<br />
DPS 2.0 3.7 3.7 5.0<br />
Payout (%) 3.8 5.2 3.5 5.1<br />
Valuation (x)<br />
P/E (Fully diluted) 25.5 19.7 16.1<br />
PEG (x) 3.5 0.7 0.7<br />
Cash P/E 20.1 15.9 13.3<br />
P/BV 4.2 3.2 2.6<br />
EV/Sales 3.6 2.8 2.5<br />
EV/EBITDA 17.7 10.4 11.1<br />
Dividend Yield (%) 1.2 1.2 1.6<br />
Return Ratios (%)<br />
RoE 14.1 17.4 17.0 17.1<br />
RoCE 12.7 13.4 15.3 16.3<br />
Working Capital Ratios<br />
Fixed Asset Turnover (x) 1.5 1.5 1.7 1.8<br />
Debtor (Days) 160 140 126 125<br />
Inventory (Days) 105 100 103 103<br />
Working Capital (Days) 266 203 185 189<br />
Leverage Ratio (x)<br />
Current Ratio 4.7 3.4 3.0 3.0<br />
Debt/Equity 0.8 1.0 0.7 0.5<br />
Cash Flow Statement<br />
(INR Million)<br />
Y/E March 2010 2011 2012E 2013E<br />
Op. Profit/(Loss) before Tax 5,963 5,923 9,811 8,977<br />
Interest/Dividends Recd. 722 1,405 562 646<br />
Direct Taxes Paid -388 -2,029 -994 -976<br />
(Inc)/Dec in WC -2,441 1,530 -2,368 -2,275<br />
CF from Operations 3,857 6,829 7,012 6,373<br />
CF frm Op.incl EO Exp. 3,857 6,829 7,012 6,373<br />
(Inc)/Dec in FA -3,970 810 -2,500 -2,500<br />
CF from Investments -3,970 682 -2,500 -2,500<br />
Change in Networth 4,386 -7,521 0 0<br />
Inc/(Dec) in Debt -2,151 2,701 -3,000 -2,500<br />
Interest Paid -1,640 -1,566 -1,482 -1,276<br />
Dividend Paid -126 -236 -236 -315<br />
CF from Fin. Activity 468 -6,621 -4,718 -4,090<br />
Inc/Dec of Cash 354 890 -207 -217<br />
Add: Beginning Balance 715 1,069 1,959 1,752<br />
Closing Balance 1,069 1,959 1,752 1,535<br />
Note: Reported cashflow differs due to acquisitions & change to IFRS<br />
reporting from FY09 onwards<br />
August 2011 142
Domestic Formulations | <strong>New</strong> Peaks<br />
NOTES<br />
August 2011 143
Disclosures<br />
This report is for personal information of the authorized recipient and does not construe to be any investment, legal or taxation advice to you. This research report does not constitute an offer, invitation or inducement<br />
to invest in securities or other investments and <strong>Motilal</strong> <strong>Oswal</strong> Securities Limited (hereinafter referred as MOSt) is not soliciting any action based upon it. This report is not for public distribution and has been<br />
furnished to you solely for your information and should not be reproduced or redistributed to any other person in any form.<br />
Unauthorized disclosure, use, dissemination or copying (either whole or partial) of this information, is prohibited. The person accessing this information specifically agrees to exempt MOSt or any of its affiliates<br />
or employees from, any and all responsibility/liability arising from such misuse and agrees not to hold MOSt or any of its affiliates or employees responsible for any such misuse and further agrees to hold MOSt<br />
or any of its affiliates or employees free and harmless from all losses, costs, damages, expenses that may be suffered by the person accessing this information due to any errors and delays.<br />
The information contained herein is based on publicly available data or other sources believed to be reliable. While we would endeavour to update the information herein on reasonable basis, MOSt and/or its<br />
affiliates are under no obligation to update the information. Also there may be regulatory, compliance, or other reasons that may prevent MOSt and/or its affiliates from doing so. MOSt or any of its affiliates or<br />
employees shall not be in any way responsible and liable for any loss or damage that may arise to any person from any inadvertent error in the information contained in this report . MOSt or any of its affiliates<br />
or employees do not provide, at any time, any express or implied warranty of any kind, regarding any matter pertaining to this report, including without limitation the implied warranties of merchantability, fitness<br />
for a particular purpose, and non-infringement. The recipients of this report should rely on their own investigations.<br />
This report is intended for distribution to institutional investors. Recipients who are not institutional investors should seek advice of their independent financial advisor prior to taking any investment decision<br />
based on this report or for any necessary explanation of its contents.<br />
MOSt and/or its affiliates and/or employees may have interests/positions, financial or otherwise in the securities mentioned in this report. To enhance transparency, MOSt has incorporated a Disclosure of Interest<br />
Statement in this document. This should, however, not be treated as endorsement of the views expressed in the report.<br />
Disclosure of Interest Statement<br />
Companies where there is interest<br />
1. Analyst ownership of the stock None<br />
2. Group/Directors ownership of the stock GSK Pharma<br />
3. Broking relationship with company covered None<br />
4. Investment Banking relationship with company covered None<br />
Analyst Certification<br />
The views expressed in this research report accurately reflect the personal views of the analyst(s) about the subject securities or issues, and no part of the compensation of the research analyst(s) was, is, or<br />
will be directly or indirectly related to the specific recommendations and views expressed by research analyst(s) in this report. The research analysts, strategists, or research associates principally responsible<br />
for preparation of MOSt research receive compensation based upon various factors, including quality of research, investor client feedback, stock picking, competitive factors and firm revenues.<br />
Regional Disclosures (outside India)<br />
This report is not directed or intended for distribution to or use by any person or entity resident in a state, country or any jurisdiction, where such distribution, publication, availability or use would be contrary to<br />
law, regulation or which would subject MOSt & its group companies to registration or licensing requirements within such jurisdictions.<br />
For U.K.<br />
This report is intended for distribution only to persons having professional experience in matters relating to investments as described in Article 19 of the Financial Services and Markets Act 2000 (Financial<br />
Promotion) Order 2005 (referred to as "investment professionals"). This document must not be acted on or relied on by persons who are not investment professionals. Any investment or investment activity to<br />
which this document relates is only available to investment professionals and will be engaged in only with such persons.<br />
For U.S.<br />
MOSt is not a registered broker-dealer in the United States (U.S.) and, therefore, is not subject to U.S. rules. In reliance on the exemption from registration provided by Rule 15a-6 of the U.S. Securities Exchange<br />
Act of 1934, as amended (the "Exchange Act") and interpretations thereof by the U.S. Securities and Exchange Commission ("SEC") in order to conduct business with Institutional Investors based in the U.S.,<br />
<strong>Motilal</strong> <strong>Oswal</strong> has entered into a chaperoning agreement with a U.S. registered broker-dealer, Marco Polo Securities Inc. ("Marco Polo").<br />
This report is intended for distribution only to "Major Institutional Investors" as defined by Rule 15a-6(b)(4) of the Exchange Act and interpretations thereof by SEC (henceforth referred to as "major institutional<br />
investors"). This document must not be acted on or relied on by persons who are not major institutional investors. Any investment or investment activity to which this document relates is only available to major<br />
institutional investors and will be engaged in only with major institutional investors.<br />
The Research Analysts contributing to the report may not be registered /qualified as research analyst with FINRA. Such research analyst may not be associated persons of the U.S. registered broker-dealer, Marco<br />
Polo and therefore, may not be subject to NASD rule 2711 and NYSE Rule 472 restrictions on communication with a subject company, public appearances and trading securities held by a research analyst account.<br />
<strong>Motilal</strong> <strong>Oswal</strong> Securities Ltd<br />
3rd Floor, Hoechst House, Nariman Point, Mumbai 400 021<br />
Phone: (91-22) 39825500 Fax: (91-22) 22885038. E-mail: reports@motilaloswal.com
<strong>Motilal</strong> <strong>Oswal</strong> Company Gallery
<strong>Motilal</strong> <strong>Oswal</strong> Sector Gallery
![Electronic Contract Note [ECN] â DECLARATION (VOLUNTARY) To ...](https://img.yumpu.com/48604692/1/158x260/electronic-contract-note-ecn-a-declaration-voluntary-to-.jpg?quality=85)