Sweetwater Creek Watershed Mgmt. Plan 2007 Update--Part 2
Sweetwater Creek Watershed Mgmt. Plan 2007 Update--Part 2
Sweetwater Creek Watershed Mgmt. Plan 2007 Update--Part 2

You also want an ePaper? Increase the reach of your titles
YUMPU automatically turns print PDFs into web optimized ePapers that Google loves.
CHAPTER 8: EXISTING NATURAL SYSTEMS<br />
CONDITIONS<br />
8.1 Overview<br />
The <strong>Sweetwater</strong> <strong>Creek</strong> watershed area encompasses 13,570 acres in Hillsborough County. The<br />
watershed contains plant communities, both terrestrial and aquatic, that provide a variety of<br />
important environmental functions, including habitat for listed species and other wildlife, stability<br />
for stream banks and lake shores, improvement of water and air quality, and moderation of<br />
water and air temperatures. However, plant communities have undergone several periods of<br />
significant alteration since the 1830’s as land use in the watershed changed from original<br />
conditions to agriculture to the current suburban/urban uses. Land use shifts have left the<br />
watershed with substantially less acreage in native plant communities, impaired water quality in<br />
streams, degradation of all plant communities by non-native invasive plants, and highly<br />
disturbed stream banks and lake shores. Most populations of native wildlife have been reduced<br />
and/or eliminated.<br />
One of the objectives of this watershed management plan is to identify opportunities to restore<br />
and protect natural systems in the watershed which are important in preventing excessive runoff<br />
volumes and pollutant loads, restoring and/or maintaining terrestrial and aquatic biodiversity,<br />
protecting stream channel stability, and reducing stream bank erosion. The first step toward this<br />
goal is to describe the historical and existing natural systems in the <strong>Sweetwater</strong> <strong>Creek</strong><br />
watershed and to identify specific key factors that prove useful in assessing watershed<br />
ecosystem quality. The evaluation of the key factors is done by means of a prioritization matrix<br />
which ranks the subwatersheds with respect to environmental quality. A discussion of the<br />
overall trends in environmental quality is provided early in the chapter, followed by more<br />
discussion of the significant issues for habitats and wildlife within the <strong>Sweetwater</strong> <strong>Creek</strong><br />
watershed.<br />
8.2 Data Sources/Literature Review<br />
Several reports were reviewed for this report, and a list appears in the Bibliography in Section<br />
8.9. Further, Geographic Information System (GIS) databases were utilized from the following<br />
organizations:<br />
• Florida Department of Environmental Protection (FDEP)<br />
• Florida Department of Transportation (FDOT)<br />
• Florida Fish and Wildlife Conservation Commission (FFWCC)<br />
• Hillsborough County Stream Waterwatch Program<br />
8-1 <strong>Sweetwater</strong> <strong>Creek</strong> <strong>Watershed</strong> Management <strong>Plan</strong>
EXISTING NATURAL SYSTEMS CONDITIONS<br />
• Florida Natural Areas Inventory (FNAI)<br />
• Hillsborough County Environmental Protection Commission (EPC)<br />
• Hillsborough County Environmental Lands Acquisition and Protection Program (ELAPP)<br />
• Hillsborough County <strong>Plan</strong>ning Commission<br />
• Hillsborough River Greenways Task Force (HRGTF)<br />
• Southwest Florida Water Management District (SWFWMD)<br />
• Natural Resources Conservation Service (NRCS)<br />
• U.S. Fish and Wildlife Service (USFWS)<br />
• University of Florida, Geoplan Center, Florida Geographic Data Library (FGDL)<br />
• University of Florida Lakewatch Program<br />
• University of South Florida, Florida Center for Community Development and Design<br />
8.3 Overall Trends and Summary<br />
There are numerous ecological factors and relationships that define the condition of a natural<br />
system, and therefore the “level of service” that can be provided by that system. To evaluate<br />
and score the watershed, a series of parameters were considered which represented important<br />
ecological functions, extent of human development/impacts, and the presence/absence of<br />
important wildlife species. The data that were used to develop quantitative parameter scores<br />
were processed and generated from a library of information and staff experience in addition to<br />
existing GIS data provided by the SWFWMD and Hillsborough County. Most of these data are<br />
presented in subsequent subsections of this chapter. The parameters used in this are described<br />
as follows:<br />
• Historical and existing land use – expressed as a percent, this factor describes the<br />
change in land uses in the watershed area over the period from the 1950 to 2004;<br />
• Loss of natural lands<br />
- habitat fragmentation – describes the impact to the watershed area of the<br />
splitting up and isolation of wildlife habitat;<br />
- riparian buffers – describes the losses of forested systems in stream floodplains<br />
and their significance to ecosystem quality in the watershed area;<br />
• Hydrologic alterations – describes the impact to environmental quality and function<br />
resulting from physical alterations to streams and lakes such as channelization,<br />
diversion, filling, and encroachment;<br />
• Exotic flora and fauna – describes the impact to native plant and animals in the<br />
watershed area of the invasion and establishment of exotic species;<br />
• Strategic habitat conservation areas – describes the identification by FFWCC of areas<br />
that are particularly important to preserve in terms of wildlife conservation; and<br />
• Land held in public ownership – describes the land acreage currently acquired by public<br />
resource conservation agencies that provides important natural environmental functions<br />
in the watershed area.<br />
8-2<br />
<strong>Sweetwater</strong> <strong>Creek</strong> <strong>Watershed</strong> Management <strong>Plan</strong>
CHAPTER 8<br />
Using the data described in the following sections of this chapter, a natural systems evaluation<br />
matrix was developed to provide a comparative tool for measuring the quality and quantity of<br />
existing natural habitats within the watershed. This tool can be used to evaluate the overall<br />
condition of a watershed so that future efforts to protect or restore natural systems can be<br />
prioritized and implemented effectively either as stand-alone projects or in conjunction with flood<br />
and/or water quality improvement activities. An overall score was calculated based on the sum<br />
of scores for each habitat parameter (Table 8-1). Using a scoring technique similar to the water<br />
quality level of service evaluation, the overall natural system evaluation matrix score was based<br />
on the ratio of the total watershed score divided by the maximum possible score. The watershed<br />
was then given a grade based on the following ratios: 1.0 to 0.8 = A, 0.79 to 0.6 = B, 0.59 to 0.4<br />
= C, 0.39 to 0.20 = D,
EXISTING NATURAL SYSTEMS CONDITIONS<br />
8.4 Historical and Existing Habitats<br />
This section discusses, in broad terms, the historical (pre-1900) natural systems conditions in<br />
general terms based on information derived from the General Land Office Survey Notes. This<br />
description is presented as background for detailed discussion of the land use patterns and<br />
natural systems areal coverages estimated from available maps and imagery prior to 1950 in<br />
addition to land use patterns known to exist in the 1950’s and in 2004. Information from the time<br />
period prior to 1950 was obtained from the Florida General Land Office Survey (1843-1855), the<br />
1916 Soil Survey of Hillsborough County and from the Florida Department of Agriculture and<br />
Consumer Services (ACS) aerial photos from 1938-39. Information on the 1950’s and 2004 land<br />
uses were obtained from SWFWMD. The following tables have collapsed the Level III Florida<br />
Land Use Cover and Forms Classification System (FLUCFCS) (2004) land use codes to Level I<br />
to enhance comparisons among the pre-1900, 1950’s, and 2004 time periods. The figures<br />
illustrating land uses retain the Level III coding. The narratives following the tables provide<br />
details of the Level III land use cover types included in the Level I listings in the tables.<br />
Historical (pre-1900) land uses and cover types – Prior to the permanent settlement of<br />
Hillsborough County in the first half of the 19 th century, approximately 68% of the land in the<br />
<strong>Sweetwater</strong> <strong>Creek</strong> watershed was occupied by soils that supported two land cover types: the<br />
primary upland community, pine flatwoods (FLUCFCS 411), and longleaf pine-xeric oak<br />
(FLUCFCS 412). The remainder of the land in the watershed was occupied by stream and lake<br />
swamp (FLUCFCS 615), cypress swamps (FLUCFCS 621), wetland forested mixed (FLUCFCS<br />
630), and herbaceous wetlands (FLUCFCS 641, 643, 644). The swamps bordering <strong>Sweetwater</strong><br />
<strong>Creek</strong>, itself and the 37 lakes in the watershed were significant contiguous wetlands in the<br />
watershed. By 1910, Hillsborough was the most populous county in the state, and considerable<br />
development of roads and railroads had occurred. By 1916, in the <strong>Sweetwater</strong> <strong>Creek</strong><br />
watershed, the current main roadways (Gunn Highway, North Boulevard, Dale Mabry Highway,<br />
Armenia Avenue, US 41, Bearss Avenue) were hard surface facilities, and important secondary<br />
roads such as Lake Magdalene Boulevard and Crystal Lake Road were in place. At least three<br />
churches, one cemetery, and one school existed. Several hundred homes had been<br />
constructed, and one railroad line traversed the watershed at the present location of Busch<br />
Boulevard. Agriculture had became established on the uplands located near lakes and streams,<br />
with citrus occupying the highest elevations and crops and pasture occupying the lands at lower<br />
elevations. By 1950, agriculture accounted for 32% of the lands in the watershed, while uplands<br />
were reduced to from approximately 68% to 38% of the watershed. By 2004, the percent<br />
coverage of the watershed by uplands was further reduced to 2.4%.<br />
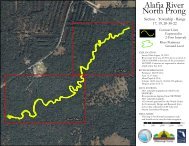
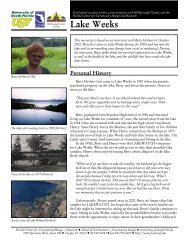
Land uses and cover types from the 1950’s - Table 8-2 provides a list and the acreages of land<br />
uses and cover types existing in 1950; each land use is compared to the total watershed area.<br />
Figure 8-1 illustrates the 1950 land uses and cover types in the <strong>Sweetwater</strong> <strong>Creek</strong> watershed.<br />
8-4<br />
<strong>Sweetwater</strong> <strong>Creek</strong> <strong>Watershed</strong> Management <strong>Plan</strong>
CHAPTER 8<br />
Table 8-2 Land Use in the <strong>Sweetwater</strong> <strong>Creek</strong> <strong>Watershed</strong>, 1950<br />
Land Use<br />
Total Area<br />
(acres) % of <strong>Watershed</strong><br />
Uplands 5,140 37.9<br />
Herbaceous wetlands 776 5.7<br />
Forested wetlands 1,609 11.9<br />
Agriculture 4,325 31.9<br />
Lakes 1,006 7.4<br />
Reservoirs 85 0.6<br />
Low/Medium Density Residential 583 4.3<br />
Commercial, Utilities, Transportation, Institutional 45 0.3<br />
Total 13,570 100%<br />
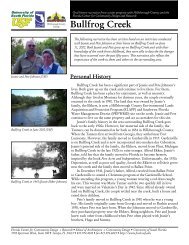
2004 land uses and cover types - Table 8-3 provides a list and the acreages of land uses and<br />
cover types existing in 2004; each land use is compared to the total watershed area. Figure 8-2<br />
illustrates the 2004 land uses and cover types in the <strong>Sweetwater</strong> <strong>Creek</strong> watershed.<br />
Table 8-3 Land Use in the <strong>Sweetwater</strong> <strong>Creek</strong> <strong>Watershed</strong>, 2004<br />
Land Use<br />
Total Area<br />
(acres) % of <strong>Watershed</strong><br />
Uplands 397 3<br />
Wetlands 1,212 9<br />
Agricultural 149 1<br />
Water 1,603 12<br />
Open Land/Recreational 639 5<br />
Low/Medium Density Residential 3,054 23<br />
High Density Residential 3,851 28<br />
Commercial, Utilities, Transportation, Institutional 2,654 19<br />
Total 13,559 100%<br />
8-5<br />
<strong>Sweetwater</strong> <strong>Creek</strong> <strong>Watershed</strong> Management <strong>Plan</strong>
Legend<br />
Roads<br />
Hydrography<br />
County Boundary<br />
Subbasins<br />
Historical Land Use (1950)<br />
Residential (Low Density)<br />
Residential (Medium Density)<br />
Residential (High Density)<br />
Agricultural<br />
Commercial and Services<br />
Disturbed Lands<br />
Extractive<br />
Industrial<br />
Institutional<br />
Non-Vegetated Wetlands<br />
Open Land<br />
Rangeland<br />
Recreational<br />
Transportation, Communication, and Utilities<br />
Upland Forests<br />
Water<br />
Wetlands<br />
Ehrlich Rd<br />
Lake Magdalene Blvd<br />
Old US Hwy 41<br />
Bearss Ave<br />
I-275<br />
Nebraska Ave<br />
Fletcher Ave<br />
Linebaugh Ave<br />
Gunn Hwy<br />
Dale Mabry Hwy<br />
Lake Ellen Dr<br />
Busch Blvd<br />
Waters Ave<br />
Anderson Rd<br />
0 6,000 12,000 Feet<br />
Historical Land Use (1950s) in the <strong>Sweetwater</strong> <strong>Creek</strong> <strong>Watershed</strong><br />
Figure<br />
8-1
Legend<br />
Roads<br />
Hydrography<br />
Agricultural<br />
Barren Land<br />
Commercial, Industrial, or Institutional<br />
High Density Residential<br />
Low/Medium Density Residential<br />
Open Land<br />
Recreational<br />
Transportation, Communication, and Utilities<br />
Upland Forested<br />
Upland Non-Forested<br />
0 4,500 9,000 Feet<br />
Water<br />
Wetlands<br />
Land Use in the <strong>Sweetwater</strong> <strong>Creek</strong> <strong>Watershed</strong> (2004)<br />
Figure<br />
8-2
EXISTING NATURAL SYSTEMS CONDITIONS<br />
8.4.1 Upland Natural Systems<br />
The following upland habitat descriptions are based on the information contained in Carlisle<br />
(1978), Harper (1921), Florida Department of Transportation’s FLUCFCS Manual (1999), and<br />
the Soil Surveys of Hillsborough County from 1916, 1958, and 1989. In the plant community<br />
descriptions below, only the species that are most characteristic of the plant community in the<br />
<strong>Sweetwater</strong> <strong>Creek</strong> watershed are mentioned as being present; however, the natural plant<br />
communities that still remain in the watershed are highly diverse and contain many more<br />
species than are mentioned in this report. For ease of reading, only common names of plants<br />
are used in the report narrative, but Section 8.10 provides a list of all scientific names of plants<br />
and animals included in the report.<br />
Pine flatwoods (411)<br />
The most common upland plant community in the state and in the <strong>Sweetwater</strong> <strong>Creek</strong> watershed<br />
in the pre-development period, pine flatwoods were associated with Myakka fine sands. The<br />
primary canopy species common to pine flatwoods is slash pine with some longleaf pine, while<br />
the shrubby understory is dominated by saw palmetto with some gallberry, staggerbush,<br />
blueberry, and tarflower. Herbaceous ground cover is sparse and includes wiregrass, several<br />
species of bluestem, and goldenrod. This community occurs on flat, moderately to poorly<br />
drained terrain composed of acid sands overlying an organic/clayey hardpan. Even on better<br />
drained terrain, flatwoods can experience periods of inundation when rainfall amounts are in the<br />
normal to above normal range. On less well drained terrain, a wet phase of pine flatwoods<br />
occurs in which obligate to facultative-wet plant species can be found flatwoods regularly.<br />
These species include trees: sweetbay, gordonia, red maple; shrubs: wax myrtle, gallberry,<br />
fetterbush; and herbs: spikerush, redroot, bog buttons, pink sundews, and yellow-eyed grass.<br />
Pine flatwoods is a fire-maintained community that will transition to a hardwood-dominated<br />
community with very dense canopy dominated by live oak, laurel oak, and pignut hickory if fire is<br />
excluded. In the <strong>Sweetwater</strong> <strong>Creek</strong> watershed, pine flatwoods have been used for pasture, row<br />
crops, and (with drainage) some citrus. By 1950, pine flatwoods occupied 36.2% of the<br />
watershed but were replaced by other land uses in 2004.<br />
Longleaf pine-xeric oak (412)<br />
The longleaf pine - xeric oak plant community, also known as sandhill, is associated with Zolfo<br />
fine sands in the <strong>Sweetwater</strong> <strong>Creek</strong> watershed. Natural canopy vegetation is dominated by<br />
longleaf pine, and characteristically has a mid-canopy of bluejack oak, turkey oak, sand live<br />
oak. The understory contains a medium to low density shrub community consisting of shiny<br />
blueberry, Darrow’s blueberry, gopher apple, Adam’s needle, and beautyberry. Herbs compose<br />
the ground cover and include: wiregrass, sky-blue lupine, drumheads, Carolina elephant’s foot,<br />
dwarf pawpaw, and eastern milk pea. This community also is a fire-maintained community that<br />
will transition to a hardwood-dominated community with few to no pines and a very dense<br />
canopy dominated by sand live oak, turkey oak, bluejack oak if fire is excluded. This plant<br />
community was largely replaced by citrus by 1950. In 2004, this community is not included on<br />
land use mapping.<br />
8-8<br />
<strong>Sweetwater</strong> <strong>Creek</strong> <strong>Watershed</strong> Management <strong>Plan</strong>
CHAPTER 8<br />
Upland coniferous forest (410)<br />
Upland coniferous forest is a general category defined by FLUCFCS as any natural upland<br />
forest having a 66% canopy closure of coniferous species. In the <strong>Sweetwater</strong> <strong>Creek</strong> watershed,<br />
this community currently (2004) occupies only 0.02% of the watershed, having been largely<br />
replaced by agriculture.<br />
Upland hardwood forest (420)<br />
Upland hardwood forest is a general category defined by FLUCFCS as natural upland forest<br />
having 66% crown canopy dominated by hardwood tree species. This community was not<br />
identified on the 1950 or 2004 mapping.<br />
Hardwood conifer mixed forest (434)<br />
In a hardwood-conifer mixed forest, neither upland conifers nor hardwoods attain more than<br />
66% dominance in the canopy. By definition, these areas typically occur on well-drained but<br />
non-droughty soils and are often the result of fire suppression in pine flatwoods, and are often<br />
successional to the flatwoods community on drier soils. This community has the same species<br />
as the longleaf pine-xeric community (FLUCFCS 412) except that neither the pines nor the oaks<br />
dominate. The percent coverage of this community increased from 0.01% to 1.7% between<br />
1950 and 2004, probably as a result of natural successional activity.<br />
Shrub and brushland (320)<br />
Shrub and brushland occurs on the same<br />
soils as pine flatwoods and longleaf pinexeric<br />
oak communities. However, it is<br />
dominated by herbs and shrubs; few to no<br />
trees are present. Typical species include<br />
saw palmetto, gallberry, wax myrtle,<br />
species of bluestem, other woody scrub<br />
plant species, and various short herbs and<br />
grasses. It often develops following the<br />
clearing of pines for timber or on longfallow<br />
cropland. This community occupied<br />
1.4% of the watershed in 1950 and 0.47% by 2004. The decrease in areal cover of this<br />
community is likely related to the conversion of these lands to residential or commercial uses.<br />
Mixed rangeland (330)<br />
Mixed rangeland is defined by FLUCFCS as rangeland where there is more than 33% mixture of<br />
grassland and shrub-brushland range species exists. This community, representing lands in<br />
transition or lands used for cattle grazing after clearing of trees in flatwoods, was absent in 1950<br />
mapping but occupied 0.58% of the watershed in 2004.<br />
8-9<br />
<strong>Sweetwater</strong> <strong>Creek</strong> <strong>Watershed</strong> Management <strong>Plan</strong>
EXISTING NATURAL SYSTEMS CONDITIONS<br />
8.4.2 Wetland/Aquatic Natural Systems<br />
The following wetland habitat descriptions are based on the information contained in Carlisle et<br />
al. (1978), Florida Department of Transportation’s FLUCFCS Manual (1999), and the Soil<br />
Surveys of Hillsborough County from 1916, 1958, and 1983. For information on lakes, the<br />
SWFWMD’s Directory of Lakes (SWFWMD, 2005) and the USF Hillsborough <strong>Watershed</strong> Atlas<br />
(http://www.hillsborough.wateratlas.usf.edu) were consulted. In the plant community<br />
descriptions below, only the species that are most characteristic of the plant community in the<br />
<strong>Sweetwater</strong> <strong>Creek</strong> watershed are mentioned as being present; however, the natural plant<br />
communities that still remain in the watershed are highly diverse and contain many more<br />
species than are mentioned in this report. For ease of reading, only common names of plants<br />
are used in the report narrative, but Section 8.10 provides a list of all scientific names of plants<br />
and animals included in the report.<br />
Cypress swamp (621)<br />
Cypress swamp is the most common wetland<br />
community in the watershed. Formerly (1950)<br />
occupying 5% of the land in the <strong>Sweetwater</strong> <strong>Creek</strong><br />
watershed, the cypress swamp community in 2004<br />
covers 2.6% of the watershed. It is associated with<br />
depressional Basinger, Holopaw, and Samsula soils that are located on the margins of some of<br />
the 38 lakes in the watershed. These natural systems are typically large basins characterized by<br />
peat substrates, seasonal to year-round inundation, still water, and occasional fire. The typical<br />
vegetation canopy species is pond cypress which is associated with swamp black gum,<br />
southern red maple, laurel oak, and dahoon holly. The understory is shrubby and is composed<br />
of fetterbush, Virginia willow, and buttonbush. The herbaceous understory includes a variety of<br />
ferns (royal fern, cinnamon fern, netted chain fern, Virginia chain fern, and toothed mid-sorus<br />
fern) associated with alligator flag, water hoarhound, false nettle. Endangered and threatened<br />
species such as butterfly orchid, Spanish moss, and ball moss occur occasionally in cypress<br />
swamps. If intact, these communities provide important ecological and hydrological services in a<br />
watershed.<br />
Stream and Lake Swamp (615)<br />
Formerly (1950) occupying 2.8% of the land in the<br />
<strong>Sweetwater</strong> <strong>Creek</strong> watershed, the stream and lake<br />
swamp community covered 0.08% of the watershed in<br />
2004. Much of the original habitat has been replaced<br />
by agricultural and urban land uses. The community is<br />
also referred to as bottomland hardwood forests and is<br />
associated with the stream channel of <strong>Sweetwater</strong><br />
<strong>Creek</strong>. Canopy tree species include red maple, water<br />
oak, sweetgum, swamp black gum, pond cypress, and some tall Carolina willows. The<br />
subcanopy and understory in this community are typically of open aspect except in forests<br />
8-10<br />
<strong>Sweetwater</strong> <strong>Creek</strong> <strong>Watershed</strong> Management <strong>Plan</strong>
CHAPTER 8<br />
where the hydroperiod (depth and duration of inundation) has been reduced, which has allowed<br />
a tangle of shrub species to become established on the forest floor, invade and close the<br />
understory. In such cases, shrubs such as fetterbush and buttonbush make the forest virtually<br />
impenetrable. This community and FLUCFCS 630 have most impacted by transportation<br />
facilities in the watershed.<br />
Wetland Forested Mixed (630)<br />
Wetland forested mixed is a wetland forest where neither hardwoods nor conifers achieve a<br />
66% dominance of the crown canopy composition. Formerly (1950) occupying 4.1% of the land<br />
in the <strong>Sweetwater</strong> <strong>Creek</strong> watershed, this community covered 3.18% of the watershed in 2004. It<br />
is a community that occupies riparian areas just as the Stream and Lake Swamp community<br />
does, and species common to this community are those described for Stream and Lake Swamp<br />
community (FLUCFCS 615). This community and FLUCFCS 615 have most impacted by<br />
transportation facilities in the watershed.<br />
Freshwater Marsh (641)<br />
The areal coverage of freshwater marsh in the <strong>Sweetwater</strong> <strong>Creek</strong> watershed declined from<br />
4.9% to 1.56% of the watershed over the period 1950 – 2004, having been drained or<br />
eliminated for agricultural purposes in the first half of the 20 th century. This habitat is typically<br />
characterized by large basins with peat substrates, seasonal to year-round inundation, and<br />
infrequent fire. Freshwater marshes usually occur as open expanses of grasses, sedges,<br />
rushes, and other herbaceous species in soils that are usually saturated or covered with surface<br />
water for two or more months during the year (Brown et al., 1990). Freshwater marsh is highly<br />
diverse and marshes may differ significantly from one another even though located in<br />
geographic proximity. In The <strong>Sweetwater</strong> <strong>Creek</strong> watershed, typical species include: sawgrass,<br />
cattail, arrowhead, maidencane, buttonbush, and cordgrass, soft rush, and fire flag. The species<br />
composition of freshwater marsh habitat often occurs in zones and is dependent upon soil type,<br />
hydroperiod, water depth, and successional stage (Wolfe and Drew, 1990).<br />
Wet prairies (643)<br />
Formerly (1950) occupying 0.6% of the land in the <strong>Sweetwater</strong> <strong>Creek</strong> watershed, the wet prairie<br />
community covered 0.2% of the watershed in 2004. Wet prairies are usually open, mixed grasssedge<br />
associations, which occur in areas of periodic flooding and are distinguished from<br />
marshes as having shorter herbaceous species and longer, drier hydroperiods (Wolfe and<br />
Drew, 1990). Like freshwater marshes, wet prairies support a diversity of species, and each<br />
system may be different from a neighboring system. Important species in the <strong>Sweetwater</strong> <strong>Creek</strong><br />
watershed wet prairie systems include: spike rushes, beak rushes, St. John’s wort, yellow-eyed<br />
grass, whitetop sedge, pink sundew, early whitetop fleabane, and meadow beauty.<br />
Emergent aquatic vegetation (644)<br />
The areal coverage of emergent aquatic vegetation in the <strong>Sweetwater</strong> <strong>Creek</strong> watershed<br />
increased from 0.2% to 1.3% over the period 1950 – 2004. Typically, this habitat is associated<br />
with the deepwater portions of freshwater marshes and includes species such as water lettuce,<br />
8-11<br />
<strong>Sweetwater</strong> <strong>Creek</strong> <strong>Watershed</strong> Management <strong>Plan</strong>
EXISTING NATURAL SYSTEMS CONDITIONS<br />
spatterdock, water hyacinth, duckweed, and water lilies. The increase in areal coverage is likely<br />
the result of the development of this community in the many artificial ponds constructed in<br />
associated with residential and commercial facilities.<br />
Streams and waterways (510)<br />
While <strong>Sweetwater</strong> <strong>Creek</strong> is the dominant<br />
linear waterway in the watershed, it is not<br />
identified on the 1950 land use mapping due<br />
to its narrow channel and intermittent flow<br />
characteristics. The plant community<br />
supported on the creek banks is included<br />
under the Stream and Lake Swamp<br />
community description (FLUCFCS 615).<br />
However, the creek itself should be<br />
recognized for its habitat and habitat support<br />
functions. The inclusion of this category (0.3%<br />
of the watershed) recognized the artificial channels constructed off the original channel of the<br />
creek and the deepening and widening of other reaches of the creek. These channel alterations<br />
created linear features that were more visible on the 2004 imagery. The current <strong>Sweetwater</strong><br />
<strong>Creek</strong> provides a degraded, ruderal habitat along most of its length.<br />
Lakes (520) / Reservoirs (530)<br />
Lakes are defined by FLUCFCS as inland water bodies excluding reservoirs. In the <strong>Sweetwater</strong><br />
<strong>Creek</strong> watershed, lakes are water bodies ranging in surface area from less than 10 acres to<br />
greater than 200 acres. The larger lakes in the watershed are: Magdalene (238 ac), White Trout<br />
(77 ac), Carroll (191 ac), and Ellen (53 ac). These water features are permanently inundated,<br />
although water elevations rise and fall as a result of rainfall and control structure operations.<br />
Most lakes have undergone some degree of development on bordering lands; however, some<br />
cypress swamp and wetland coniferous forests remain on lake margins. The lakes also support<br />
in-lake plant communities that are extraordinarily valuable in terms of fish production and water<br />
quality functions. <strong>Plan</strong>t communities include emergent aquatic species along the shallow lake<br />
margins and rooted submerged aquatic species in the deeper zones of the lakes. The areal<br />
coverage of lake in the watershed has declined from 7.4% to 6.1% between 1950 and 2004 as<br />
a result of the lowering of lake levels due to surface drainage facilities and reduced ground<br />
water levels.<br />
Reservoirs are artificial impoundments of water. Occupying 85 acres (0.6%) in 1950, this<br />
community type in 2004 occupied 732 acres (5.3%) as urban land uses have expanded in the<br />
watershed. These water features have been constructed in association with residential<br />
development in the watershed and generally are managed to provide aesthetic or stormwater<br />
management functions.<br />
8-12<br />
<strong>Sweetwater</strong> <strong>Creek</strong> <strong>Watershed</strong> Management <strong>Plan</strong>
CHAPTER 8<br />
Intermittent ponds (653)<br />
This category includes small, shallow water bodies that are not permanently inundated. Not<br />
recognized in 1950, this category covered 0.07% of the watershed in 2004. Such ponds,<br />
appearing on the imagery during a period of rapid urbanization, likely reflect artificial ponds<br />
(FLUCFCS 533, 534) in the process of construction.<br />
8.4.3 Urban Altered Land Use<br />
The following land use descriptions are based on the 2004 land use map of the <strong>Sweetwater</strong><br />
<strong>Creek</strong> watershed, the corresponding descriptions FLUCFCS, and staff knowledge of the area.<br />
Tree plantation (440)<br />
This land use category, not present in the 1950 land use mapping, occupies only 0.13% of the<br />
watershed in 2004. While some pine plantations were present in the watershed between 1950<br />
and 2004, most were harvested and replaced with urban land uses.<br />
Residential [Low (110), Medium (120), High (130)] Density<br />
Residential land uses occupied less than 1% in 1918 and less<br />
than 5% of the watershed in 1950. By 2004, they accounted for<br />
over 50% of the watershed, reflecting much more rapid growth in<br />
the last half of the 20 th century. In 2004, 5% is in low density uses<br />
(5 units/acre). The majority of the residential development has occurred on lake<br />
shorelines and at major crossroads where native upland habitat has been replaced by dwelling<br />
units.<br />
Commercial and Services (140)<br />
Commercial areas and services is a land use that is predominantly associated with the<br />
distribution of products and services. This category is composed of a large number of individual<br />
types of commercial land uses, which often occur in complex combinations. This category often<br />
includes a main building and the integral areas that support the main structure. In the<br />
<strong>Sweetwater</strong> <strong>Creek</strong> watershed, this category occupied 0.3% of the watershed in 1950 but in<br />
2004 occupied 9% of the watershed. Land uses present in the watershed that fall into the<br />
Commercial areas and Services category include: service stations and convenience stores,<br />
retail facilities, small restaurants, and cemeteries.<br />
Institutional (170)<br />
In the <strong>Sweetwater</strong> <strong>Creek</strong> watershed, Institutional land uses include schools, churches, and<br />
small office facilities. At least three churches and a school were present in the early 1900’s, but<br />
the category was absent from the 1950 land use mapping. In 2004, this category occupied 1.5%<br />
of the watershed.<br />
8-13<br />
<strong>Sweetwater</strong> <strong>Creek</strong> <strong>Watershed</strong> Management <strong>Plan</strong>
EXISTING NATURAL SYSTEMS CONDITIONS<br />
Recreational (180)<br />
Recreational land uses were absent in the1950 land use mapping but were reported as<br />
occupying 0.8% of the watershed in 2004 which represent area parks, community recreational<br />
facilities, and historic sites.<br />
Open Land (190)<br />
Open Land includes undeveloped land within urban areas and inactive land with street patterns<br />
but without structures. Open land normally does not have any structures or any indication of<br />
intended use. Urban inactive land is often in a transitional state and will eventually be developed<br />
into one of the typical urban land uses. Occupying 2% of the watershed in 1950, open land<br />
increased in areal coverage slightly to 2.73%.<br />
Cropland and Pastureland (210)<br />
Formerly occupying 13.4% of the watershed, this land use<br />
category has decline to 0.01% as most agricultural lands<br />
have been re-developed for urban purposes. Included here<br />
are chiefly pastures with some vegetable and small fruit<br />
crops.<br />
Tree Crops (220)<br />
In the <strong>Sweetwater</strong> <strong>Creek</strong> watershed, this category includes citrus groves which originally were<br />
located on the higher lands adjacent to lakes in the area. The areal coverage of this land use<br />
category has declined from 16.4% to 0.77% as urban land uses have replaced agriculture.<br />
Nurseries and Vineyards (240)<br />
This category, composed of plant nurseries to service the growing urban community, was<br />
absent in the 1950 land use mapping but now occupies 0.2% of the watershed.<br />
Other Open Lands (260)<br />
Other open lands are agricultural land with a use that cannot be determined from available<br />
imagery. It occupies 0.16% of the watershed.<br />
Disturbed Land (740)<br />
Representing 0.07% of the watershed, disturbed lands are areas that have been changed<br />
primarily due to human activities other than mining and include rural lands in transition to<br />
residential land uses, and temporary spoil sites.<br />
Transportation (810)<br />
In the <strong>Sweetwater</strong> <strong>Creek</strong> watershed, this category includes: roads and highways, railroads lines.<br />
It occupied 0.3% of the watershed in 1950 and 3% of the watershed in 2004 as new facilities<br />
(e.g. Veterans Expressway) were constructed and existing facilities were widened (e.g., Dale<br />
Mabry, US 41).<br />
8-14<br />
<strong>Sweetwater</strong> <strong>Creek</strong> <strong>Watershed</strong> Management <strong>Plan</strong>
CHAPTER 8<br />
Communications (820)<br />
In the <strong>Sweetwater</strong> <strong>Creek</strong> watershed, this category includes microwave towers. The category is<br />
not included on the 1950 or 2004 land use mapping.<br />
Utilities (830)<br />
In the <strong>Sweetwater</strong> <strong>Creek</strong> watershed, this category includes water and wastewater treatment and<br />
transmission facilities. It is not included on the 1950 mapping, but it covered 0.14% of the<br />
watershed in 2004.<br />
8.4.4 Natural Systems Trends<br />
This section identifies the historical and remaining upland, wetland, and aquatic natural systems<br />
in the <strong>Sweetwater</strong> <strong>Creek</strong> watershed and summarizes the relative loss of natural habitat between<br />
1950 and 2004 land cover. Existing land use classifications other than natural systems, such as<br />
reservoirs and developed and altered lands, were not included in the habitat loss analysis.<br />
Historical and existing land use types were consolidated into general habitats of uplands and<br />
wetlands for the purpose of estimating percent habitat loss. An analysis of "type for type" habitat<br />
loss is not possible due to differences in the classification of vegetation communities, as well as<br />
inaccuracies inherent in the historical land use data. Table 8-4 demonstrates the historical and<br />
existing upland and wetland acreage, the relative habitat loss of each based on the total<br />
available area of the natural systems.<br />
Historical and Existing Land Cover Changes<br />
The areal coverage of uplands in the <strong>Sweetwater</strong> <strong>Creek</strong> watershed in 1950 is estimated at<br />
5,139 acres, and 2004 uplands are calculated at 396 acres. The difference between 1950 and<br />
2004 represents a 92% net loss of uplands as these lands were converted to agricultural and<br />
urban land uses and supporting infrastructure. The most attractive areas for citrus production<br />
were lands occupied by the longleaf pine-xeric oak community, while pine flatwoods was the<br />
primary upland community displaced for pasture cultivation and cattle production. Residential<br />
development and transportation facilities also are preferentially located on lands supporting<br />
these two plant communities. Remaining upland communities have been degraded by adjacent<br />
agricultural and urban land uses and/or by encroachment within a remnant community.<br />
The areal coverage of historical wetlands was estimated at 3,477 acres, and the coverage by<br />
wetlands today is approximately 1,212 acres. The difference in areal coverage of wetlands<br />
since 1950 represents a 65% net loss of wetlands as these lands were drained, filled, and<br />
converted to agricultural uses. Remaining wetlands have been degraded by physical<br />
disturbances associated with agricultural practices, the construction of transportation facilities,<br />
and residential development. Wetlands located within citrus groves generally have been rimditched<br />
to enhance drainage for rows of trees adjacent to the wetland. In the case of wetlands<br />
located in pastures, pasture grass is planted and cattle graze up to and through the wetland<br />
itself. Consequently, wetlands have no protective buffer zones; they are invaded by pasture<br />
grass species and other non-wetland plants; and they are the receiving waters for stormwater<br />
and irrigation runoff containing pesticides and fertilizers.<br />
8-15<br />
<strong>Sweetwater</strong> <strong>Creek</strong> <strong>Watershed</strong> Management <strong>Plan</strong>
EXISTING NATURAL SYSTEMS CONDITIONS<br />
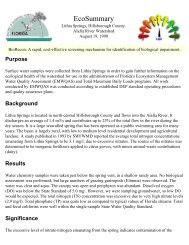
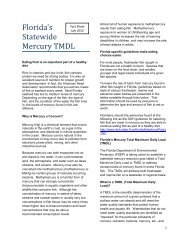
Native uplands and wetlands have been replaced by urban land uses and by agricultural land<br />
uses (Figures 8-3 and 8-4).<br />
Table 8-4<br />
Change of Uplands and Wetlands in the <strong>Sweetwater</strong> <strong>Creek</strong> <strong>Watershed</strong><br />
Acres in 1950 Acres in 2004 Acre Reduction % Reduction<br />
Uplands 5,139 396 4,743 92%<br />
Wetlands 3,477 1,212 2,265 65%<br />
8.4.5 Prioritization of Restorable Habitat Types<br />
Uplands<br />
Based on their large areal coverage in the pre-development period and their current rarity within<br />
the watershed, pine flatwoods, longleaf pine-xeric oak were identified as priority upland habitats<br />
for restoration.<br />
Wetlands<br />
Based on their ecological value and biodiversity, Stream and Lake Swamp (615) and Wetland<br />
Forested Mixed (630) were identified as priority wetland habitats for restoration.<br />
8.5 Natural Systems Issues and Areas of Concern<br />
8.5.1 Habitat Loss, Degradation, and Fragmentation<br />
As described above, the <strong>Sweetwater</strong> <strong>Creek</strong> watershed<br />
was once composed of a wide variety of upland and<br />
wetland habitats. Within the last century, many large<br />
tracts have been converted from natural land features to<br />
agricultural uses, predominantly in the northern and<br />
easternmost portions of the watershed. Based on 2004<br />
SWFWMD land use data, approximately 76% of the<br />
watershed has been altered by human activities with<br />
approximately 1.1% of the watershed impacted by<br />
agricultural activities and approximately 67% developed<br />
for urban, suburban, commercial, industrial, and mining uses. Lands in a near-natural condition<br />
(uplands and wetlands) comprise an estimated 24% of the watershed, although all remaining<br />
native habitats are disturbed and degraded to some degree by past agricultural practices and<br />
urban development.<br />
8-16<br />
<strong>Sweetwater</strong> <strong>Creek</strong> <strong>Watershed</strong> Management <strong>Plan</strong>
Legend<br />
Roads<br />
Hydrography<br />
County Boundary<br />
Loss of Uplands<br />
Subbasins<br />
Old US Hwy 41<br />
Lake Magdalene Blvd<br />
Ehrlich Rd<br />
Bearss Ave<br />
I-275<br />
Nebraska Ave<br />
Fletcher Ave<br />
Lake Ellen Dr<br />
Linebaugh Ave<br />
Gunn Hwy<br />
Dale Mabry Hwy<br />
Busch Blvd<br />
Waters Ave<br />
Anderson Rd<br />
0 6,000 12,000 Feet<br />
Loss of Uplands in the <strong>Sweetwater</strong> <strong>Creek</strong> <strong>Watershed</strong><br />
Figure<br />
8-3
Legend<br />
Roads<br />
Hydrography<br />
County Boundary<br />
Loss of Wetlands<br />
Subbasins<br />
Old US Hwy 41<br />
Lake Magdalene Blvd<br />
Ehrlich Rd<br />
Bearss Ave<br />
I-275<br />
Nebraska Ave<br />
Fletcher Ave<br />
Lake Ellen Dr<br />
Linebaugh Ave<br />
Gunn Hwy<br />
Dale Mabry Hwy<br />
Busch Blvd<br />
Waters Ave<br />
Anderson Rd<br />
0 6,000 12,000 Feet<br />
Loss of Wetlands in the <strong>Sweetwater</strong> <strong>Creek</strong> <strong>Watershed</strong><br />
Figure<br />
8-4
CHAPTER 8<br />
Habitat Fragmentation<br />
Habitat fragmentation is defined as the break-up of a continuous landscape containing large<br />
patches into smaller, numerous, less connected patches. To measure habitat fragmentation<br />
within the watershed, ArcView was used to join contiguous natural habitat polygons from<br />
SWFWMD’s 2004 land use layer. The polygons with FLUCFCS code of 3000, 4000, 5000,<br />
6000, and 7000 (natural systems designations) were dissolved to form contiguous polygons<br />
throughout the watershed. The areas of these contiguous polygons were then calculated and<br />
compared to the overall area of the watershed. If one or more contiguous polygons represented<br />
a significant proportion of the watershed (i.e., greater than 75%), the watershed was<br />
categorized as having relatively little fragmentation. Alternately, if the watershed was comprised<br />
of several small contiguous natural systems polygons and few large contiguous polygons, then<br />
the area was categorized as being highly fragmented. Large numbers of small polygons<br />
represent a high level of fragmentation, while small numbers of large polygons represent a low<br />
level of fragmentation.<br />
The level of fragmentation was evaluated for each region and watershed (Table 8-5, Figures 8-<br />
5). The watershed has a total of 485 contiguous natural areas, none of which represent more<br />
than 25% of the watershed. Therefore, the degree of habitat fragmentation in the watershed can<br />
be described as high and a score of 0 assigned (Table 8-5).<br />
Table 8-5<br />
Distribution of Contiguous Natural Systems Polygons<br />
within the <strong>Sweetwater</strong> <strong>Creek</strong> <strong>Watershed</strong><br />
Contiguous Natural Polygons<br />
Score = 0 25% but 50% but 75%<br />
Degree of fragmentation High Moderate Low Very Low<br />
Number of polygons 485 0 0 0<br />
8.5.2 Wildlife Corridors<br />
Wildlife corridors are naturally existing or<br />
restored native linear landscape features<br />
connecting two or more larger tracts of habitat<br />
functioning as a dispersal route for native flora<br />
and fauna, and for the occurrence of the natural<br />
ecological processes such as fire (Harris, 1991).<br />
With the continuing need for land development<br />
to support an increasing human population,<br />
wildlife habitats are cleared and destroyed to<br />
meet human needs. In the <strong>Sweetwater</strong> <strong>Creek</strong><br />
watershed where urbanization, agriculture, and<br />
8-19<br />
<strong>Sweetwater</strong> <strong>Creek</strong> <strong>Watershed</strong> Management <strong>Plan</strong>
EXISTING NATURAL SYSTEMS CONDITIONS<br />
deforestation have fragmented natural habitats, it has been necessary to establish natural<br />
pathways for movement and migration for wildlife to prevent inbreeding or overexploitation of<br />
prey. The Hillsborough County Comprehensive <strong>Plan</strong> defines wildlife corridors as “contiguous<br />
stands of Significant Wildlife Habitat which facilitate the natural migratory patterns, as well as<br />
other habitat requirements (e.g., breeding, feeding) of wildlife.” The need for and use of wildlife<br />
corridors became apparent as early as the 1930s (Edmisten, 1963) and corridors have been<br />
used widely ever since for the benefit of game species (McElfres et al., 1980) as well as nongame<br />
animals (Maher, 1990).<br />
Regulatory Component<br />
Wildlife corridors are one of the many avenues that support the Biodiversity Treaty proposed by<br />
the United Nations and signed by then President Clinton, but not ratified by the United States<br />
Congress. In 1992, the United Nations published the Global Diversity Assessment for the<br />
purpose of implementing the Global Biodiversity Treaty and Agenda 21.<br />
Section 10.4.2.1.2 of the Global Biodiversity Assessment sets forth the criteria for protected<br />
areas stating that, “Representative areas of all major ecosystems in a region need be reserved,<br />
blocks should be as large as possible, buffer zones should be established around core areas,<br />
and corridors should connect these areas.” These core areas and buffer zones would then be<br />
connected by wildlife corridors, in accordance with the Wildlands Project. The goal is to allow<br />
animals to travel from one core habitat to another through wildlife corridors without<br />
anthropogenic obstruction or interference. The remaining areas will be utilized for human<br />
habitats conforming to the principles of sustainable development as supported by Executive<br />
Order 94-54 that created the Governor’s Commission for a Sustainable Florida and Section<br />
163.3244 F.S. (Sustainable Community Demonstration Project). Establishment of wildlife<br />
corridors is consistent with the Hillsborough Comprehensive <strong>Plan</strong> (CARE Policy 14.2) and the<br />
Hillsborough County Land Development Code.<br />
Wildlife Corridors in the <strong>Sweetwater</strong> <strong>Creek</strong> <strong>Watershed</strong><br />
As discussed in the previous section, significant habitat fragmentation has occurred throughout<br />
the watershed. The protection of wildlife corridors and major routes between two or more core<br />
and/or remnant areas of wildlife habitat is critical for the long-term survival of a wide range of<br />
plant and animal species. Such protection is often provided by public lands purchased for<br />
conservation purposes; there are no such public lands in the watershed. However, an 11-acre<br />
parcel owned by the Florida Department of Transportation will be restored, providing some<br />
range and habitat for very small animals. The Town ‘N Country Greenway will provide some<br />
benefit to wildlife, although its’ primary goal is to enhance non-motorized transportation<br />
opportunity for area residents. The identification and protection of remaining wildlife corridors is<br />
essential to restoring natural areas in this watershed. The <strong>Sweetwater</strong> <strong>Creek</strong> watershed has<br />
areas of development where wildlife corridors and greenways have been identified through the<br />
Hillsborough Comprehensive <strong>Plan</strong>, Land Development Code, and Hillsborough Greenways<br />
Task Force as supported by the Hillsborough County Natural Resources Regulation.<br />
8-20<br />
<strong>Sweetwater</strong> <strong>Creek</strong> <strong>Watershed</strong> Management <strong>Plan</strong>
Legend<br />
Roads<br />
Hydrography<br />
County Boundary<br />
Contiguous Land Use<br />
Subbasins<br />
Old US Hwy 41<br />
/<br />
Lake Magdalene Blvd<br />
Ehrlich Rd<br />
Bearss Ave<br />
I-275<br />
Nebraska Ave<br />
Fletcher Ave<br />
Lake Ellen Dr<br />
Linebaugh Ave<br />
Gunn Hwy<br />
Dale Mabry Hwy<br />
Busch Blvd<br />
Waters Ave<br />
Anderson Rd<br />
0 6,000 12,000 Feet<br />
Contiguous Land Use in the <strong>Sweetwater</strong> <strong>Creek</strong> <strong>Watershed</strong><br />
Figure<br />
8-5
EXISTING NATURAL SYSTEMS CONDITIONS<br />
Approximately 24% (3,211 acres) of the watershed remains undeveloped, and opportunity to<br />
acquire public lands is slight. Further, existing undeveloped uplands and wetlands have been<br />
disturbed and encroached upon, diminishing their ecological value for conservation purposes in<br />
the absence of an aggressive restoration effort.<br />
Conservation Development<br />
Conservation development is a concept proposed for urban watersheds that focuses on<br />
residential development designs that utilize conservation strategies such as inter-connected<br />
networks of permanent open space. The method allows residential developments that maximize<br />
open space conservation without reducing overall building density. The same method could be<br />
applied to commercial and industrial developments as area re-development occurs. This<br />
approach will allow new development to utilize space clustering land uses for human utilization,<br />
passive recreational use, and wildlife habitat conservation. The Conservation Development<br />
concept is consistent with Hillsborough County Natural Resources Regulation, serving as an<br />
avenue to identify areas that may serve as wildlife corridors and/or areas that should be<br />
protected and preserved as core habitats or environmentally sensitive lands.<br />
Basically, development with wildlife preservation considered within the overall site plan will allow<br />
for innovative and creative land use and design for new urban communities. Additionally, the<br />
FWC is committed to working with land use planners, developers, and homeowners to assist<br />
them with development designs that offer homes for both humans and wildlife. Clustering,<br />
designing corridor trails away from critical wildlife areas, and designing wildlife crossings all<br />
contribute to increased wildlife habitat.<br />
Criteria for significant wildlife habitat minimum widths and sizes are contained in Appendix B of<br />
the Hillsborough County Natural Resources Regulation. Existing studies have established a<br />
definitive link between habitat area size and species diversity (Miller and Schaeffer, 1998). The<br />
Hillsborough County Natural Resources Regulation sets a 75-acre minimum based on wildlife<br />
research review that concluded that species diversity rapidly declines below 60 acres, while<br />
another study determined 50 to 74 acres as the optimum minimum habitat. Although wildlife<br />
corridors do not have to follow these criteria for size and width, reserving 75 acres or more of<br />
significant wildlife habitat should be taken into consideration as core habitat or as the basis for a<br />
wildlife corridor.<br />
Although wildlife corridors can help conserve habitat dependent species affected by<br />
encroaching urbanization, it is important to consider that the total amount of available habitat is<br />
the critical factor and that no amount of corridors connecting isolated habitat areas will replace<br />
extensive loss of habitat. Wildlife corridors allow for the linkage and preservation of isolated<br />
wildlife habitats in the competition for space with humans.<br />
8-22<br />
<strong>Sweetwater</strong> <strong>Creek</strong> <strong>Watershed</strong> Management <strong>Plan</strong>
CHAPTER 8<br />
8.5.3 Identification of Existing Riparian Buffer Areas<br />
Measures of ecosystem health can play an important role in the linkage between land use<br />
practices, ecological integrity, and water quality. The loss of natural riparian vegetation due to<br />
agriculture and development impair the functional role of riparian buffers, strongly influencing<br />
the diversity and productivity of both the aquatic and terrestrial biota, and the physical stability of<br />
the streambank and channel. A critical component of the riverine ecosystem, riparian buffers<br />
function ecologically to:<br />
• regulate sediment storage and transport,<br />
stream flow characteristics;<br />
• maintain bank and channel stability by<br />
provision of solid root mass and ground<br />
cover, regulate stream temperature;<br />
• regulate instream biological production by<br />
determining the inputs of small organic<br />
debris (SOD);<br />
• buffer streams from fine sediments;<br />
• provide wildlife habitat features, including<br />
coarse woody debris (CWD), large woody<br />
debris (LWD), and nest and perch sites; and<br />
• provide summer and winter forage for terrestrial fauna.<br />
Factors such as the width of riparian (streamside vegetation) zones and the abundance and<br />
diversity of plant and macroinvertebrate communities can serve as biological indicators of<br />
environmental stress and water quality. Table 8-6 summarizes a rating system that was used in<br />
this plan to evaluate existing environmental conditions within the <strong>Sweetwater</strong> <strong>Creek</strong> watershed.<br />
Unfortunately, detailed macrobinvertebrate or water quality data were not available for the<br />
watershed, and the analyses were restricted to the vegetation component of this rating system<br />
(riparian buffer widths and percent of riparian buffer as developed land use).<br />
A number of agencies throughout the U.S. have developed stream buffer protection ordinances<br />
(e.g., Baltimore County, Rhode Island Coastal Resources Management Council, City of Napa –<br />
California, Portland Metro). More detailed buffer zone analyses have been performed in Florida,<br />
specifically in the Wekiva River basin and the east central Florida region (Brown et al., 1987;<br />
Brown et al., 1990). The purpose of the Florida studies were to develop methodologies for<br />
determining buffer zone widths for regionally significant wetland systems that could then be<br />
used for the purposes of establishing minimum criteria for future land use planning. The buffer<br />
zone widths developed by Brown et al. (1987) are similar to those used in this riparian buffer<br />
rating system described above with minimum buffer widths ranging from 24m to 98m (Table 8-<br />
7).<br />
8-23<br />
<strong>Sweetwater</strong> <strong>Creek</strong> <strong>Watershed</strong> Management <strong>Plan</strong>
EXISTING NATURAL SYSTEMS CONDITIONS<br />
Table 8-6 Rating of Stream Water Quality and Health<br />
based on existing vegetation and development activities within a watershed<br />
(modified from Office of the Commissioner for the Environment, Victoria, Australia, 1988)<br />
Rating<br />
Excellent<br />
Good<br />
Fair<br />
Poor<br />
Degraded<br />
Vegetation<br />
Streamside vegetation intact for minimum 100m width from the bank, with<br />
continuous cover essentially unmodified and with few exotic plants. <strong>Watershed</strong><br />
vegetation substantially uncleared. Less than 10% of watershed developed.<br />
Existing streamside vegetation communities intact, with cover essentially<br />
unmodified for, at a minimum, 30m width for over 80% of each stream segment.<br />
Infrequent exotics. Largely undisturbed by roadways. Limited permanent clearing<br />
of watershed vegetation.<br />
Existing streamside vegetation communities predominantly intact and exotics<br />
infrequent. Riparian zone intact for 30m width, at minimum, for over 60% of<br />
watershed.<br />
Existing streamside vegetation largely fragmented and exotics frequent. Riparian<br />
zone of 30m width intact for less than 60% of watershed, and frequently disturbed<br />
by roadways/development. <strong>Watershed</strong> largely cleared of native vegetation.<br />
Little remnant streamside vegetation. Surviving patches fragmented. Exotics<br />
frequent. Riparian zone of 30m width intact for less then 25% of watershed, and<br />
frequently disturbed by roadways & development. <strong>Watershed</strong> substantially cleared<br />
of native vegetation.<br />
Table 8-7 Recommended Buffer Widths (in meters)<br />
for protection of water quality and quantity and wetland-dependent wildlife habitat<br />
(from Brown and Schaefer, 1987)<br />
Protect Water Quantity Protect Water Quality Protect Wildlife Habitat<br />
Minimize Groundwater Drawdown Control Sedimentation<br />
Landscape Association (Habitat Type) Min. Max. Min. Max. Min. Max.<br />
Flatwoods/isolated wetlands 30 168 23 114 98 168<br />
Flatwoods/flowing-water wetlands 30 168 23 114 98 168<br />
Flatwoods/hammocks/hardwood swamps 15 76 23 114 N/A 168<br />
Sandhills/wetlands 6 76 23 114 98 223<br />
Flatwoods/salt marshes 30 168 23 114 98 N/A<br />
Coastal hammocks/salt marshes 30 168 23 114 98 N/A<br />
AVERAGE 24 137 23 114 98 182<br />
To calculate riparian zone widths and percentages of riparian zones that have been converted<br />
to development in the <strong>Sweetwater</strong> <strong>Creek</strong> watershed area, the ArcView buffer extension was<br />
used. First, 30 m and 100 m buffer zones were created around the stream network coverage<br />
that was created during the hydrologic analysis. From this coverage, the 2004 land use data<br />
were clipped for each of the buffer zones and evaluated to determine percent of natural land<br />
cover within each clipped area to develop a rating score (Figures 8-6 to 8-7). These scores<br />
were then converted to numerical values and used in a natural systems evaluation matrix.<br />
8-24<br />
<strong>Sweetwater</strong> <strong>Creek</strong> <strong>Watershed</strong> Management <strong>Plan</strong>
Legend<br />
Roads<br />
Hydrography<br />
County Boundary<br />
Agricultural<br />
Barren Land<br />
Commercial, Industrial, or Institutional<br />
High Density Residential<br />
Low/Medium Density Residential<br />
Open Land<br />
Recreational<br />
Transportation, Communication, and Utilities<br />
Upland Forested<br />
Upland Non-Forested<br />
Water<br />
Wetlands<br />
Subbasins<br />
Old US Hwy 41<br />
<br />
Lake Magdalene Blvd<br />
Ehrlich Rd<br />
Bearss Ave<br />
I-275<br />
Nebraska Ave<br />
Fletcher Ave<br />
Lake Ellen Dr<br />
Linebaugh Ave<br />
Gunn Hwy<br />
Dale Mabry Hwy<br />
Busch Blvd<br />
Waters Ave<br />
Anderson Rd<br />
0 6,000 12,000 Feet<br />
100m Riparian Buffer in the <strong>Sweetwater</strong> <strong>Creek</strong> <strong>Watershed</strong><br />
Figure<br />
8-6
Legend<br />
Roads<br />
Hydrography<br />
County Boundary<br />
Agricultural<br />
Barren Land<br />
Commercial, Industrial, or Institutional<br />
High Density Residential<br />
Low/Medium Density Residential<br />
Open Land<br />
Recreational<br />
Transportation, Communication, and Utilities<br />
Upland Forested<br />
Upland Non-Forested<br />
Water<br />
Wetlands<br />
WATER<br />
Subbasins<br />
Old US Hwy 41<br />
/<br />
Lake Magdalene Blvd<br />
Ehrlich Rd<br />
Bearss Ave<br />
I-275<br />
Nebraska Ave<br />
Fletcher Ave<br />
Lake Ellen Dr<br />
Linebaugh Ave<br />
Gunn Hwy<br />
Dale Mabry Hwy<br />
Busch Blvd<br />
Waters Ave<br />
Anderson Rd<br />
0 6,000 12,000 Feet<br />
30m Riparian Buffer in the <strong>Sweetwater</strong> <strong>Creek</strong> <strong>Watershed</strong><br />
Figure<br />
8-7
CHAPTER 8<br />
Within the 100 m buffer encompassing 3,630 acres, 60% (2,195 acres) of the land has been<br />
developed for agricultural, commercial, or residential purposes, leaving 40% of the buffer area<br />
in native habitats. Within the 30 m buffer (1,191 acres), 45% of the land has been developed for<br />
agricultural, commercial, or residential purposes, leaving 55% of the buffer area in native<br />
habitats. It should be noted that much of the remaining native habitats have undergone<br />
disturbance and encroachment, reducing their ecological value. Based on the riparian zone<br />
analyses, rating scores were developed for the <strong>Sweetwater</strong> <strong>Creek</strong> watershed (Table 8-8). The<br />
score for the watershed was “fair.”<br />
Table 8-8<br />
Riparian Buffer Measures within the <strong>Sweetwater</strong> <strong>Creek</strong> <strong>Watershed</strong><br />
Excellent Good Fair Poor Degraded<br />
Score<br />
Vegetation<br />
Intact within<br />
100m buffer?<br />
30m buffer<br />
80%<br />
developed<br />
of stream<br />
30m buffer intact for<br />
>60% of stream<br />
30m buffer intact<br />
for
EXISTING NATURAL SYSTEMS CONDITIONS<br />
net for a given stream sampling location and the identification of all organisms within the net.<br />
Scores for three categories are tabulated based on this data and if two of three exceed<br />
threshold values the stream is rated as “healthy,” if less than two meet the thresholds then the<br />
stream is rated as “suspected impaired” or “impaired. While useful for the Hillsborough River<br />
<strong>Watershed</strong> <strong>Plan</strong>, the BioRecon data can give not assessment of watershed health in the<br />
<strong>Sweetwater</strong> <strong>Creek</strong> watershed due to an absence of information.<br />
8.5.5 Strategic Habitat Conservation Areas<br />
In 1994, the FWC published Closing the Gaps in Florida’s Wildlife Habitat Conservation System,<br />
which identifies habitats that must be conserved and managed to ensure the survival of key<br />
components of Florida’s biological diversity. The primary objectives of the report are to:<br />
1. Identify habitat areas that are essential to the survival of rare and declining species not<br />
adequately protected by the current system of conservation areas;<br />
2. Identify areas that are important to several globally endangered species of plants,<br />
animals, and plant communities; and<br />
3. Identify regional areas of high biological diversity to assist in local land use planning.<br />
The FWC utilized land cover and vegetation data, public land boundaries, and documented<br />
occurrences of species and communities to identify Strategic Habitat Conservation Areas<br />
(SHCA). Hillsborough County was identified as containing SHCA critical to the wood stork,<br />
white ibis, great egret, little blue heron, short-tailed hawk, and Florida sandhill crane.<br />
As previously discussed, the protection and preservation of the remaining natural areas of the<br />
watershed are important components of this watershed management plan. These natural lands<br />
are critical to the maintenance of local and regional wildlife and the protection of water<br />
resources. Approximately 24% (3,211 acres) of the watershed remain undeveloped.<br />
Strategic Conservation Habitat Areas within the <strong>Sweetwater</strong> <strong>Creek</strong> <strong>Watershed</strong><br />
The FWC SHCA GIS data was utilized to estimate the size of these areas within the <strong>Sweetwater</strong><br />
<strong>Creek</strong> watershed (Figure 8-8). These areas were determined from vector data converted from<br />
the original raster data, which is contained within pixels. Therefore, these estimates are based<br />
on square polygons and not a delineated ecological boundary. A total of approximately 2% (285<br />
acres) of the watershed was identified as SHCA for wading birds. These species include great<br />
egret, white ibis, snowy egret, and little blue heron, all of which have been observed in the area.<br />
8.5.6 Hydrologic Alterations<br />
Hydrologic alterations can be defined as any action that would change or affect the water cycle.<br />
The <strong>Sweetwater</strong> <strong>Creek</strong> watershed and its diverse array of natural systems are affected by<br />
hydrological alterations that would upset the watershed’s delicate ecological balance.<br />
8-28<br />
<strong>Sweetwater</strong> <strong>Creek</strong> <strong>Watershed</strong> Management <strong>Plan</strong>
Legend<br />
Roads<br />
Hydrography<br />
County Boundary<br />
Subbasins<br />
WATER<br />
SHCAs<br />
ESTES, LAKE<br />
Old US Hwy 41<br />
ROCKET, LAKE<br />
CHAPMAN LAKE<br />
Lake Magdalene Blvd<br />
PLATT LAKE<br />
LONG LAKE<br />
Ehrlich Rd<br />
MAGDALENE, LAKE<br />
Bearss Ave<br />
I-275<br />
Nebraska Ave<br />
BAY LAKE<br />
Fletcher Ave<br />
GEORGE LAKE<br />
Linebaugh Ave<br />
CITRUS PARK LAKE<br />
CASEY, LAKE<br />
Gunn Hwy<br />
Dale Mabry Hwy<br />
ELLEN, LAKE<br />
Lake Ellen Dr<br />
LIPSEY, LAKE<br />
CARROLL, LAKE<br />
BOAT LAKE<br />
Busch Blvd<br />
Waters Ave<br />
Anderson Rd<br />
0 6,000 12,000 Feet<br />
Strategic Habitat Conservation Areas in the <strong>Sweetwater</strong> <strong>Creek</strong> <strong>Watershed</strong><br />
Figure<br />
8-8
EXISTING NATURAL SYSTEMS CONDITIONS<br />
Development for the purposes of residential, commercial, industrial, institutional, recreational,<br />
extractive, and agricultural land use has increased impervious surface area and/or resulted in<br />
the channelization and rerouting of surface water flows which has adversely affected the<br />
watershed’s hydrological cycle. Development of groundwater supplies in the watershed has<br />
affected lake elevations and in-lake wildlife habitat. These hydrological alterations can have<br />
results such as:<br />
1. Accelerated successional changes of natural systems in both upland and wetland<br />
systems;<br />
2. Changes in the sizes of faunal populations (some species are favored and increase in<br />
numbers, while others are stressed and decline in numbers and/or viability);<br />
3. Reduced biodiversity; and<br />
4. Changes in water quality.<br />
Natural plant communities, particularly uplands, have been replaced by agricultural, commercial,<br />
or residential development, leaving parcels of smaller size and ecological value.<br />
While wetlands have remained virtually unchanged in areal coverage, the habitat quality of<br />
existing systems can be presumed to be less than original conditions due to several factors,<br />
including: invasive species invasion, excessive disturbance of wetland margins, elimination of<br />
protective upland buffers; trash disposal; rim ditching; and reduced hydroperiod. The elimination<br />
and disturbance of natural habitats has resulted in a decline in the number of wild animal<br />
species (lowered biodiversity) present in the watershed.<br />
Channel Alterations<br />
With the growing need for space for human use, natural<br />
channels in the watershed have been dredged, straightened,<br />
and/or filled to serve as water conveyances for stormwater,<br />
resulting in loss or reduction in ecological value. Channelization<br />
has also resulted in degraded water quality in streams allowing<br />
exotic species like water hyacinth to compete with native<br />
species. Increased stormwater runoff and removal of bank<br />
vegetation in these ditch systems have resulted in sedimentation<br />
and eutrophication, altering the aquatic species that utilize the system. Non-native and/or<br />
nuisance aquatic species more tolerant of anoxic or poor water quality conditions dominate<br />
these waterways which decreases biological diversity. In the <strong>Sweetwater</strong> <strong>Creek</strong> watershed,<br />
alterations have occurred throughout the watershed. Channelization of the creek itself has<br />
occurred along its’ entire length.<br />
Water Control Structures<br />
Seven lakes (Bay, Bird, Elaine, Ellen, Lipsey, Magdalene, and Platt) have water control<br />
structures that allow varying degrees of control on lake stage and discharge rates. Guidance<br />
levels have been developed by the Southwest Florida Water Management District for these, and<br />
other, Hillsborough County lakes.<br />
8-30<br />
<strong>Sweetwater</strong> <strong>Creek</strong> <strong>Watershed</strong> Management <strong>Plan</strong>
CHAPTER 8<br />
8.5.7 Wildlife<br />
The information for this section was developed from previous surveys conducted by<br />
Hillsborough County and ELAPP staff, FFWCC (1992), FNAI Species Occurrence records, and<br />
staff experience in the area. Review of compiled fauna indicates that a total of 91 species of<br />
vertebrates (25 species of fish, 33 species of amphibians and reptiles, 22 species of birds, and<br />
11 species of mammals) potentially utilize the watershed. By comparison, the similar-sized<br />
Brooker <strong>Creek</strong> watershed, the other watershed in the Northwest Hillsborough area that lacks a<br />
marine/estuarine habitat component, reports a total of 299 species).<br />
8.5.8 Protected Species<br />
Many native fauna and flora are protected from activities that harm or interfere with them or their<br />
habitat by federal, state, and local regulations. Fauna and flora are federally protected by the<br />
USFWS under Title 50 Code of Federal Regulations (CFR) 17 and 23. Federally protected<br />
species are categorized as threatened or endangered. State protection of fauna is administered<br />
by the FWC under F.A.C., Rules 39-27.003, 39-27.004, and 39-27.005. The Florida Department<br />
of Agriculture and Consumer Services administers Chapter 5B-40, F.A.C. State protected floral<br />
species are categorized as commercially exploited, threatened, or endangered. Management<br />
strategies still needed to be developed to protect these species, including coordination efforts<br />
with Florida Natural Areas Inventory (FNAI), FWC, and USFWS. Hillsborough County EPC<br />
indirectly protects these species by protecting wetland habitats essential to the survival of these<br />
species. In addition, the County’s upland habitat ordinance provides protection of essential<br />
habitats.<br />
The presence of wildlife or plant species is often considered indicative of the presence and<br />
health of natural systems. A literature search was conducted to determine the floral and faunal<br />
composition of the watershed. This search included the review of recent surveys conducted<br />
within the watershed by Hillsborough County and ELAPP staff, standard Florida literature<br />
references such as the Rare and Endangered Biota of Florida, the Florida Atlas of Breeding<br />
Sites for Herons and their Allies, the FNAI, the FFWCC, and the USFWS. Protected species<br />
that have been observed and/or may utilize the watershed are listed in Table 8-9. A total of six<br />
protected animal species potentially occur in the <strong>Sweetwater</strong> <strong>Creek</strong> watershed.<br />
Fish<br />
No protected fish species are expected to utilize habitats in the <strong>Sweetwater</strong> <strong>Creek</strong> watershed.<br />
Reptiles and Amphibians<br />
Protected reptiles and amphibians that may occur in the <strong>Sweetwater</strong> <strong>Creek</strong> watershed are the<br />
American alligator which has been documented as occurring in the watershed (Table 8-9). The<br />
American alligator is a resident of river swamps, lakes, marshes, bayous, and other bodies of<br />
water and is prevalent within the watershed. The required habitat of the short-tailed snake is<br />
longleaf pine-turkey oak associations and adjacent upland hammocks or sand pine scrub. The<br />
Florida gopher frog (Rana capito) prefers a xeric upland habitat, but are often found in<br />
8-31<br />
<strong>Sweetwater</strong> <strong>Creek</strong> <strong>Watershed</strong> Management <strong>Plan</strong>
EXISTING NATURAL SYSTEMS CONDITIONS<br />
commensal association with the gopher tortoise (Gopherus polyphemus). Florida gopher frogs<br />
breed in habitats that are seasonally flooded, grassy ponds, and cypress heads that lack fish<br />
populations.<br />
Avifauna<br />
Protected wading birds that may occur in the watershed include little blue heron, snowy egret,<br />
tricolored heron, white ibis, and wood stork. Most of these species require relatively shallow<br />
water habitats for foraging, although the white ibis is known to forage in pastures and lawns.<br />
They nest in marine and freshwater habitats including cypress, wetland hardwoods, or shrub<br />
swamps. Wood storks are not expected to nest in the watershed, but they are known to forage<br />
in both natural and artificial ponds and waterways. They have been observed in ditches just to<br />
the east and may be expected in the <strong>Sweetwater</strong> <strong>Creek</strong> watershed. Degradation of both nesting<br />
and foraging habitats has contributed to population declines in these species.<br />
Mammals<br />
No protected mammals are expected to utilize habitat in the <strong>Sweetwater</strong> <strong>Creek</strong> watershed.<br />
Table 8-9<br />
Protected Animal Species<br />
that potentially occur in the <strong>Sweetwater</strong> <strong>Creek</strong> <strong>Watershed</strong><br />
Species Common Name FFWCC USFWS Observed<br />
REPTILES<br />
American alligator SSC T(S/A) X<br />
BIRDS<br />
Little blue heron SSC - X<br />
Snowy egret SSC - X<br />
Tricolored heron SSC - X<br />
White ibis SSC - X<br />
Wood Stork E E X<br />
FFWCC-Florida Wildlife Conservation Commission<br />
USFWS-United States Fish and Wildlife Service<br />
E = Endangered T= Threatened SSC = Species of Special Concern<br />
C = Commercially Exploited T(S/A) = Threatened due to similarity of appearance<br />
Flora<br />
Over 500 species of plants can be expected in the <strong>Sweetwater</strong> <strong>Creek</strong> watershed. The<br />
watershed’s poor quality habitat suggest that few protected species occur there. Nine species<br />
(Table 8-10) may be present in remaining uplands, but with the elimination of much of the native<br />
upland habitat, many of the protected species that may still be present in the watershed are<br />
species that prefer wetland habitats, for example orchids and ferns. Some protected species<br />
may be present as cultivated specimens in greenhouses or homes.<br />
8-32<br />
<strong>Sweetwater</strong> <strong>Creek</strong> <strong>Watershed</strong> Management <strong>Plan</strong>
CHAPTER 8<br />
Table 8-10<br />
Protected <strong>Plan</strong>t Species documented in the <strong>Sweetwater</strong> <strong>Creek</strong> <strong>Watershed</strong><br />
Floral Species scientific name Common name FDA listing<br />
Osmunda cinnamomea Cinnamon fern Commercially exploited<br />
Osmunda regalis Royal fern Commercially exploited<br />
Phlebodium aureum Golden polypody Threatened<br />
Pteris vittata Chinese ladder brake Threatened<br />
Spiranthes praecox Greenvein ladies’ tresses Threatened<br />
Spiranthes vernalis Spring ladies’ tresses Threatened<br />
Thelypteris kunthii Southern shield fern Threatened<br />
Tillandsia fasciculata Cardinal airplant Commercially exploited<br />
Tillandsia utriculata Giant airplant Commercially exploited<br />
8.5.9 Exotic Species<br />
Florida is particularly prone to biological invasions due to the widespread disturbance of native<br />
habitats as well as its semi-tropical climate, great expanse of waterways, and "island-like<br />
habitat" (bounded on three sides by water and the fourth by frost). This section discusses exotic<br />
plants and animals that have been observed or have the potential of invading the <strong>Sweetwater</strong><br />
<strong>Creek</strong> watershed. Due to the degree of disturbance and the length of time of human habitation<br />
in the area, the <strong>Sweetwater</strong> <strong>Creek</strong> watershed supports over 39 species of exotic plants and 50<br />
species of exotic animals.<br />
8.5.9.1 Exotic <strong>Plan</strong>ts<br />
An exotic plant is a non-indigenous species, or one introduced to this state either purposefully<br />
or accidentally. A naturalized exotic is a non-native plant that has reproduced on its own either<br />
sexually or asexually.<br />
Approximately 1.7 million acres of Florida's remaining natural areas have been invaded by<br />
exotic plant species. These exotic plant invasions degrade and diminish Florida's natural areas.<br />
Invasive, non-indigenous plants are non-native plants that have invaded Florida's forests and<br />
wetlands. They replace native plant species and often form exotic monocultures. In many cases,<br />
these stands of exotic plants are not useful to the state's wildlife, which have evolved to depend<br />
on native plants for food and shelter. Native animals are rarely able to adapt to new exotic<br />
plants. Animals that depend on native plants will move away or even become extinct if exotic<br />
plants replace too many of our native plants. Some of the effects of invasive plant species<br />
include:<br />
• Decrease in biological diversity of native ecosystems<br />
• Poisoning of some wildlife and livestock species<br />
• Reduction of aquatic habitat for native fish and wildlife species, including listed species<br />
8-33<br />
<strong>Sweetwater</strong> <strong>Creek</strong> <strong>Watershed</strong> Management <strong>Plan</strong>
EXISTING NATURAL SYSTEMS CONDITIONS<br />
• Decrease in the ecological value of important habitats for native fish and wildlife<br />
• Clogging of lakes and waterways and other wetlands, impeding wildlife movements<br />
Exotic <strong>Plan</strong>t Species Control Programs<br />
The FDEP’s Bureau of Invasive <strong>Plan</strong>t Management is the lead agency in Florida responsible for<br />
coordinating and funding two statewide programs to control invasive aquatic and upland plants<br />
on public conservation lands and waterways. Florida’s aquatic plant management program,<br />
established in the early 1900s, is one of the oldest invasive species removal programs. With the<br />
addition of the Upland Invasive <strong>Plan</strong>t Management Program under Florida Statute 369.252, the<br />
state addresses the need for a statewide coordinated approach to the upland exotic and<br />
invasive plant problem. Additionally, Hillsborough County’s Land Development Code requires<br />
the removal of exotic species for newly developed areas. The Exotic Pest <strong>Plan</strong>t Council (EPPC)<br />
has played a major role in identifying exotic species that pose a threat to natural flora.<br />
The EPPC was established in 1984 for the purpose of focusing attention on:<br />
1. impacts to biodiversity from exotic pest plants;<br />
2. impacts of exotic plants to the integrity of native plant community composition and<br />
function;<br />
3. habitat loss due to exotic plant infestations;<br />
4. impacts of exotic plants to endangered species primarily due to habitat loss and<br />
alteration (e.g., Cape Sable Seaside Sparrow);<br />
5. the need to prevent habitat loss and alteration by comprehensive management for exotic<br />
plants;<br />
6. the socioeconomic impacts of exotic pest plants (e.g., increased wildfire intensity and<br />
frequency in Melaleuca);<br />
7. changes in the seriousness of exotic pest plants and to indicate which are the worst<br />
problems; and<br />
8. informing and educating resource managers about which species deserve to be<br />
monitored, and to help managers set priorities for management.<br />
The Council’s Florida chapter, the Florida Exotic Pest <strong>Plan</strong>t Council (FEPPC), compiles a list of<br />
Florida's most invasive exotic plant species every few years, grouping them according to degree<br />
of invasiveness. The most recent compilation can be found at the end of this chapter. The<br />
FEPPC has also developed a database map for the Noxious and Exotic Weed Task Team of<br />
Category I species throughout the state. A review of this database resulted in the list of FEPPC<br />
Category I species occurrence within Hillsborough County, which are described individually<br />
below.<br />
This list is based on the definitions of invasive exotic species made by the FEPPC Committee:<br />
• Category I are exotic pest plants that invade and disrupt Florida’s native plant<br />
communities<br />
8-34<br />
<strong>Sweetwater</strong> <strong>Creek</strong> <strong>Watershed</strong> Management <strong>Plan</strong>
CHAPTER 8<br />
• Category II are exotic pest plants that have the potential to invade and disrupt native<br />
plant communities as indicated by (1) aggressive weediness; (2) a tendency to disrupt<br />
natural successional processes; (3) a similar geographic origin and ecology as Category<br />
I species (4) a tendency to form large vegetative colonies; and/or (5) sporadic, but<br />
persistent, occurrence in natural communities<br />
• (N) indicates a species listed as noxious on the United States Department of Agriculture<br />
and the Florida Department of Agriculture and Consumer Services lists<br />
• (P) indicates a species listed as prohibited by the Florida Department of Environmental<br />
Protection under Rule 62C-52, F.A.C.<br />
Exotic <strong>Plan</strong>ts in the <strong>Sweetwater</strong> <strong>Creek</strong> <strong>Watershed</strong><br />
The <strong>Sweetwater</strong> <strong>Creek</strong> watershed has been susceptible to exotic species invasion as a result of<br />
the physical disruption of habitats for development purposes, agricultural and industrial<br />
operations, and the escape of exotic species from residential landscapes. Information contained<br />
in several reports (see Bibliography) and on site visual inspection of the watershed revealed the<br />
presence of 39 exotic plant species in the watershed; many other species, undocumented as<br />
yet, probably occupy the watershed. Many exotic species are agricultural tree crops and/or<br />
landscape plants that were purposely planted, while others have been introduced accidentally.<br />
Many of the purposely planted exotics remained in the landscape even after land use changes<br />
occurred (e.g., residences built in former citrus grove) and many have been introduced into<br />
landscapes for specimen plants. Of this category of exotic species, the primary species<br />
includes: fruit trees and shrubs (grapefruit, orange, tangerine, loquat, kumquat, Surinam cherry,<br />
banana, papaya, avocado, mango). Other purposely planted species include: asparagus fern,<br />
Australian pine, bamboo, Brazilian pepper, camphor tree, carrotwood, castor bean, chinaberry<br />
tree, Chinese privet, Chinese tallow tree, cogon grass, earpod tree, fig species, Japanese<br />
honeysuckle, lantana, latex plant, lead tree, paper mulberry, punk tree, torpedo grass, water<br />
hyacinth, wild taro. Other species that escaped into the landscape to become well established<br />
include: air potato, alligator weed, hydrilla, Japanese climbing fern, parrot’s feather, skunk vine,<br />
and tropical soda apple. Below is a brief description of a few of the more common exotic<br />
species observed within the <strong>Sweetwater</strong> <strong>Creek</strong> watershed. The vegetative descriptions are from<br />
the University of Florida’s Northeast Region Data Center. The photographs are reprinted from<br />
the University of Florida, Institute of Food and Agricultural Sciences Aquatic, Center for Aquatic<br />
and Invasive <strong>Plan</strong>ts, online Aquatic, Wetland and Invasive <strong>Plan</strong>t Information Retrieval System<br />
(APIRS).<br />
Alligator Weed<br />
Alligator weed is an immersed plant that thrives in disturbed aquatic<br />
environments, but can grow in a variety of habitats, including dry<br />
land. It may form sprawling mats over the water or along shorelines.<br />
Alligator weed stems are long, branched, and hollow. Leaves are<br />
opposite, simple, elliptic, and have smooth margins. Flowers grow<br />
on stalks and are whitish and papery, and bloom during the warm<br />
months.<br />
8-35<br />
<strong>Sweetwater</strong> <strong>Creek</strong> <strong>Watershed</strong> Management <strong>Plan</strong>
EXISTING NATURAL SYSTEMS CONDITIONS<br />
Australian pine<br />
Several species of Australian pine were introduced into Florida prior to<br />
1920 (Morton, 1980). The three species of Australian pine in Florida<br />
are Casuarina equisetifolia, C. glauca, and C. cunninghamiana.<br />
Hybridization of these species is extensive and complicates<br />
identification (Schardt and Schmitz, 1990). The tree is an emersed<br />
hardwood, native to Australia and Malaysia, and occurs along rocky<br />
coasts, dunes, sand bars, and islands.<br />
The Australian pine was primarily planted to form windbreaks along<br />
coastal areas. The trees can reach 35-m heights and grow at a rate of<br />
1.0 to 1.5 m a year. In southern and central Florida, Australian pines<br />
typically produce dense stands and form thick carpets of needles on the ground prohibiting the<br />
growth of native vegetation. In dune communities, Australian pine's dense shade and leaf-litter<br />
retard the growth of native coastal vegetation (Schardt and Schmitz, 1990). Dense monospecific<br />
stands of Australian pine crowd out native vegetation in coastal areas and affect habitat for<br />
several listed and non-listed species.<br />
Air potato<br />
It is believed that air potato was introduced to Florida as an ornamental<br />
and food plant around 1905. It was already recognized as a pest plant<br />
throughout the state by the 1970s. It is a non-native, invasive vine<br />
covered with large handsome leaves. It can quickly grow 60-70 feet in<br />
length, which is long enough to overtop (and shade-out) tall trees. A<br />
member of the yam family (Dioscoreaceae), air potato produces large<br />
numbers of aerial tubers, (potato-like growths attached to the stems) that grow into new plants.<br />
Water hyacinth<br />
The water hyacinth is a floating plant that grows in all types of<br />
freshwaters. It has inflated petioles and forms large floating mats that<br />
can completely cover lakes, ponds, and streams. It is a prolific tropical<br />
weed now naturalized in waterways throughout the state and the frostfree<br />
coastal areas of the Southeast (Bell and Taylor, 1982). Water<br />
hyacinths vary in size from a few inches to over three feet tall. It has<br />
showy lavender flowers. The leaves are rounded and leathery, attached to a spongy and<br />
sometimes inflated stalk. The plant has dark feathery roots.<br />
Cogon Grass<br />
Cogon grass is a non-native grass with extensive rhizomes,<br />
spreading stems from 3-10 feet. It is one of the most<br />
aggressive weeds of dry lands in Florida, but can occur in<br />
areas that become briefly flooded. It can cover large areas.<br />
Native to the warmer regions of the Old World, it was brought<br />
8-36<br />
<strong>Sweetwater</strong> <strong>Creek</strong> <strong>Watershed</strong> Management <strong>Plan</strong>
CHAPTER 8<br />
to the U.S. as experimental forage. It has spread, partially through its use as a packing material.<br />
It is commonly seen along roadsides, ditches, swales, and abandoned land. Difficult to<br />
eradicate due to its hardy rhizomes, the plant quickly out competes most native grasses.<br />
Punk Trees (Melaleuca)<br />
Melaleuca trees, also known as punk trees or paperbark tea trees,<br />
are native to Australia, New Guinea, and New Caledonia. Melaleuca<br />
is characterized in Florida by a rapid growth rate, efficient<br />
reproduction, and the ability to invade a wide variety of habitats<br />
(Meskimen, 1962). This exotic tree grows along roadsides, on<br />
ditchbanks, in mesic prairies, in sawgrass marshes, and on lake<br />
shorelines. Once established, trees form dense stands that are nearly impenetrable (Center and<br />
Dray, 1986). More than 4,000 trees per hectare are not uncommon in melaleuca forests.<br />
Melaleuca is a pest, especially in the Everglades and surrounding areas, where the trees grow<br />
into immense forests virtually eliminating all other vegetation. Although small mammals seem to<br />
use these forests, species diversity in wet prairie-marsh ecosystems with dense monocultures<br />
of melaleuca decreases by 60-80% (Austin, 1978; Woodall, 1978; Mazzotti et al., 1981).<br />
Schortemeyer et al. (1981) reported that only 10% of the bird species in melaleuca stands<br />
actually fed there and only 1.5% of their activity involves nesting in these trees. Melaleuca can<br />
replace native pond cypress.<br />
Chinaberry Tree<br />
Chinaberry is a naturalized, fast-growing tree in the southeastern<br />
U.S. It is invading the forests, fence lines, and disturbed areas of<br />
Florida and elsewhere, including Hawaii. Belonging to the<br />
mahogany family of plants, chinaberry is native to Asia. Striking<br />
and colorful, chinaberry was widely introduced as an ornamental<br />
shade tree because of its large compound leaves, distinctive<br />
clusters of lilac-colored flowers, and round yellow fruits. Chinaberry seeds are spread by fruiteating<br />
birds. Chinaberry outgrows, shades-out, and displaces native vegetation. The bark,<br />
leaves, and seeds are poisonous to farm and domestic animals. Chinaberry is a landscape<br />
element on residential properties in the watershed.<br />
Skunk Vine<br />
Skunk vine, a woody vine from Asia, actually does smell more-orless<br />
skunk-like. The aggressive, competitive plant may grow high<br />
into the trees in a variety of habitats, from mesic hammocks to<br />
xeric sand hill communities. It appears to prefer sunny floodplains<br />
and bottomlands, and can even grow under water. Reportedly<br />
introduced in 1897 as a "potential fiber crop", skunk vine now<br />
occurs throughout the southeastern U.S. Herbarium records indicate that skunk vine grows in at<br />
least 17 counties of central and north central Florida. Its stems root freely. This species is<br />
prevalent on the edges of the Stream and Lake Swamp habitat.<br />
8-37<br />
<strong>Sweetwater</strong> <strong>Creek</strong> <strong>Watershed</strong> Management <strong>Plan</strong>
EXISTING NATURAL SYSTEMS CONDITIONS<br />
Chinese Tallow<br />
Like melaleuca, the Chinese tallow is a tree that grows and spreads<br />
rapidly, is difficult to kill, and tends to take over large areas by outcompeting<br />
native plants. Chinese tallow is spreading rampantly in<br />
large natural areas, including Paynes Prairie State Preserve near<br />
Gainesville, state-owned protected lands along the St. Johns River. It<br />
is a landscape element on residential property and has escaped into<br />
all but the xeric plant communities.<br />
Brazilian Pepper<br />
Brazilian pepper is one of the most aggressive of the invasive<br />
non-indigenous plants in Florida. It is invading aquatic and<br />
terrestrial habitats, greatly reducing the quality of native biotic<br />
communities in the state. Brazilian pepper is from South<br />
America, and was probably introduced as an ornamental in the<br />
mid 1800s. Since it is not cold hardy, the tree occurs mostly in<br />
southern Florida. Brazilian pepper is indigenous to the coast of<br />
tropical Brazil, Paraguay, and Argentina (Ewel, 1986). It was present in Florida in the early<br />
1840's (Barkley, 1944) and was re-introduced into Florida in 1898 (Morton, 1978). This plant<br />
was once sold as a landscape ornamental because it produced dense masses of scarlet<br />
berries. The species is established in the watershed in the Stream and Lake Swamp habitat.<br />
Wild taro<br />
The wild taro is an emergent plant, imported from the Pacific Islands. It<br />
occurs in and out of water. The leaves can grow to two feet long and<br />
are medium to large in size, arrowhead-shaped with heart-shaped<br />
bases. They are dark, velvety green, and water repellant. Wild taro<br />
leaves are peltate: the leaf stem attaches more-or-less to the middle of<br />
the underside of the leaf. Leaf stems grow to four feet tall. Flowers<br />
occur in small fingerlike spikes.<br />
The castor bean, earpod tree, latex plant, lead tree, and paper mulberry are also escapees from<br />
landscapes. Not purposely planted around homes and buildings today, these species are<br />
represented by a sufficient number of individuals to provide an adequate seed source for further<br />
invasion of upland native habitats, particularly disturbed sites. <strong>Plan</strong>ts of these species are<br />
commonly seen along roadsides.<br />
Hydrilla and parrot’s feather, both of which are submerged aquatic plants that are rooted in the<br />
bottom substrate, escaped from the aquarium trade and are well established in ponds and some<br />
lakes in the watershed. Hydrilla is particularly invasive and has been a serious problem in some<br />
of the larger lakes in the watershed in the past. Control measures include chemical treatment<br />
and the introduction of the Chinese grass carp, a plant-eating fish species.<br />
8-38<br />
<strong>Sweetwater</strong> <strong>Creek</strong> <strong>Watershed</strong> Management <strong>Plan</strong>
CHAPTER 8<br />
8.5.9.2 Exotic Fauna<br />
An exotic animal is a non-indigenous species introduced to an area either purposefully or<br />
accidentally. Exotic, non-indigenous, invasive species compete with native species for space,<br />
food, and ecological niche. Activities to prevent and control invasive animal species that<br />
severely impact the lands and waters of the United States have become a priority for watershed<br />
management. The term invasive species is defined by the Presidential Executive Order 13112.<br />
Known as "exotic-invasive" or "alien-invasive" species, these invasive animals cause ecological<br />
and economic damage, and sometimes, human health impacts in areas that they infest. These<br />
species have gained a foothold on public and private lands throughout the nation and in other<br />
parts of the world, and range across almost every ecosystem of the country including those<br />
found within the <strong>Sweetwater</strong> <strong>Creek</strong> watershed. Common methods of introduction include<br />
release of pets, escape from pet dealers, or intentional introduction for pest control.<br />
USGS, FDEP, UF-IFAS, and Hillsborough County information on non-indigenous species were<br />
reviewed to compile a list of exotic species that have been observed or reported in the<br />
watershed. Some of the exotic and nuisance animals found in Hillsborough County include:<br />
Nine-banded armadillo, Cuban tree frog, Greenhouse frog, and Brown anole. These four<br />
species arrived in Florida by natural migration (nine-banded armadillo) and by accidental<br />
introduction (Cuban tree frog, Greenhouse frog, and Brown anole). Armadillos disturbed soils in<br />
all habitats, particularly Stream and Lake Swamp, Cypress, and other wetlands during the dry<br />
season. The Cuban tree frog is a voracious predator and will attack and devour anything smaller<br />
than itself, including native frogs, fish, and invertebrates. The greenhouse frog may be replacing<br />
native frogs, particularly in south Florida, while the brown anole competes to some degree with<br />
the native Carolina anole (chameleon). Several exotic fish species are known from waterways in<br />
Hillsborough County, and they may reasonably be expected to occur in the <strong>Sweetwater</strong> <strong>Creek</strong><br />
watershed also; these species include: tilapia, sailfin molly, marbled molly, grass carp,<br />
plecostomus catfish, Jack Dempsey, Oscars, and other aquarium fishes.<br />
8.6 Conservation and Preservation Programs<br />
Conservation and preservation programs are critical instruments in the protection of natural<br />
communities. These programs promote and protect biological diversity which are supported by<br />
international treaties, federal regulations, state legislation, local comprehensive management<br />
plans, and local ordinances which are discussed in detail in Section 8.7.<br />
Local governments in Florida may use two instruments of preservation: conservation easement<br />
as supported by 704 F.S. and 193 F.S. and land acquisition. These Florida Statutes support the<br />
following methods of preservation:<br />
• Full fee acquisition<br />
• Less than fee acquisition<br />
8-39<br />
<strong>Sweetwater</strong> <strong>Creek</strong> <strong>Watershed</strong> Management <strong>Plan</strong>
EXISTING NATURAL SYSTEMS CONDITIONS<br />
• 193 F.S. easement<br />
• Transfer of development rights<br />
• Purchase of development rights<br />
8.6.1 Land Acquisition Conservation and Preservation Programs<br />
There are several land acquisition conservation and preservation programs in Florida available<br />
to local governments that have jurisdiction over the <strong>Sweetwater</strong> <strong>Creek</strong> watershed. These<br />
programs are briefly described in the following sections.<br />
Conservation and Recreation Lands Program<br />
The Conservation and Recreational Lands (CARL) program was established in 1979 by the<br />
Florida Legislature which expanded the 1972 Environmentally Endangered Lands Program to<br />
include resource conservation measures for other types of lands. It is one of Florida’s<br />
environmental land acquisition programs for the protection and conservation of unique natural<br />
areas, endangered species, unusual geologic features, wetlands, and significant archaeological<br />
and historical areas. Mineral-extraction severance taxes and documentary stamp fees funded<br />
the CARL program until the recent creation of the Preservation 2000 (P2000) program. The<br />
CARL program receives approximately $105 million annually from the sale of bonds. Future<br />
funding from the sale of bonds is dependent on legislative action, but the Florida Forever<br />
program is scheduled to continue until 2010.<br />
The Land Acquisition and Restoration Council (ARC) was established by Section 259.035 (1)<br />
F.S., and selects and ranks projects on the CARL acquisition list each year. Nine members of<br />
ARC represent the following state agencies: Department of Community Affairs, DEP, Division of<br />
Forestry of the Department of Agriculture and Consumer Affairs, FWC, Division of Historical<br />
Resources of the Department of State, and four appointees of the Governor with backgrounds<br />
from scientific disciplines related to land, water, or environmental science. The FDEP Bureau of<br />
Land Acquisition reviews all CARL and P2000 acquisitions and handles land exchanges,<br />
negotiates, and acquires lands for the department and other state agencies. Lands acquired<br />
under the CARL program are maintained as parks, recreation areas, wildlife management<br />
areas, wilderness areas, forests, and greenways.<br />
Florida Forever Program<br />
Established in 1999 by the Florida Legislature, the Florida Forever Program is the principal land<br />
acquisition program for Florida. It provides for up to $3 billion statewide over a 10-year period to<br />
protect and improve environmental lands, water resources, and urban green space. The<br />
allocation to SWFWMD equates to approximately 25% of total funds expected to be provided<br />
under the program. To date, SWFWMD has not acquired lands in fee for the <strong>Sweetwater</strong> <strong>Creek</strong><br />
Headwaters project; an additional 636 acres are proposed for acquisition.<br />
8-40<br />
<strong>Sweetwater</strong> <strong>Creek</strong> <strong>Watershed</strong> Management <strong>Plan</strong>
CHAPTER 8<br />
Hillsborough County Environmental Lands Acquisition and Protection Program<br />
(HCELAPP)<br />
The HCELAPP was established by Hillsborough County in 1987 for the purpose of acquiring,<br />
preserving, and protecting endangered and environmentally sensitive lands, beaches, parks,<br />
and recreational lands. Although resource protection is the primary purpose of acquiring<br />
sensitive lands in the county, public use that is compatible with the preservation and protection<br />
of such lands has been allowed on select parcels. The program is administered through the<br />
county’s Parks and Recreation Department and is overseen by an advisory committee<br />
composed of both local citizens and public agency staff. Parcels deemed environmentally<br />
sensitive are evaluated and ranked on a site-by-site basis through an annual nomination<br />
process.<br />
HCELAPP’s land acquisition efforts for acquiring environmentally sensitive lands are often in<br />
cooperation with FDEP’s CARL Program, SWFWMD, the Florida Forever Program, and The<br />
Nature Conservancy. HCELAPP has not acquired lands in the <strong>Sweetwater</strong> <strong>Creek</strong> watershed.<br />
Nature Conservancy<br />
The Nature Conservancy (TNC) is a non-profit international organization whose goals are to<br />
conserve biological diversity through habitat conservation. TNC works with the Natural Heritage<br />
Inventory scientists and other researchers to set conservation priorities and acquire lands for<br />
conservation management. TNC utilizes acquisition, land exchanges, conservation easements,<br />
retained life estates, and other arrangements to work with property owners to protect natural<br />
habitats. They also provide landowners with technical assistance on identifying and managing<br />
natural resources including rare species and unusual natural communities.<br />
Trust for Public Lands<br />
The Trust for Public Land (TPL) is a national non-profit land conservation organization that was<br />
created to protect land for public use and enjoyment. The principal goal of TPL is to acquire<br />
lands suitable for open space and parks, and convey them to public agencies for ownership and<br />
management. TPL also provides training and technical assistance to private landowners, local<br />
land trusts, and government agencies to enhance their land conservation goals.<br />
Wetland Reserve Program<br />
The Wetland Reserve Program (WRP) is administered through the USDA Natural Resources<br />
Conservation Service (NRCS). The WRP is a voluntary program offering landowners the<br />
opportunity to protect, restore, and enhance wetlands on their property. The NRCS provides<br />
technical and financial support for conservation easements and wetland restoration in an effort<br />
to achieve the greatest wetland functions and values, along with optimum wildlife habitat.<br />
8-41<br />
<strong>Sweetwater</strong> <strong>Creek</strong> <strong>Watershed</strong> Management <strong>Plan</strong>
Legend<br />
Roads<br />
Hydrography<br />
County Boundary<br />
Subbasins<br />
WATER<br />
Conservation Lands<br />
Lake Park<br />
ESTES, LAKE<br />
Old US Hwy 41<br />
/<br />
ROCKET, LAKE<br />
CHAPMAN LAKE<br />
Lake Magdalene Blvd<br />
PLATT LAKE<br />
LONG LAKE<br />
Ehrlich Rd<br />
MAGDALENE, LAKE<br />
Bearss Ave<br />
I-275<br />
Nebraska Ave<br />
BAY LAKE<br />
Fletcher Ave<br />
GEORGE LAKE<br />
Linebaugh Ave<br />
CITRUS PARK LAKE<br />
CASEY, LAKE<br />
Gunn Hwy<br />
Dale Mabry Hwy<br />
ELLEN, LAKE<br />
Lake Ellen Dr<br />
LIPSEY, LAKE<br />
CARROLL, LAKE<br />
BOAT LAKE<br />
Busch Blvd<br />
Waters Ave<br />
Anderson Rd<br />
0 6,000 12,000 Feet<br />
Conservation Lands in the <strong>Sweetwater</strong> <strong>Creek</strong> <strong>Watershed</strong><br />
Figure<br />
8-9
CHAPTER 8<br />
8.6.2 Public Lands in the <strong>Sweetwater</strong> <strong>Creek</strong> <strong>Watershed</strong><br />
A review of existing public lands within the watershed was conducted utilizing GIS metadata for<br />
conservation lands in Florida compiled by the Florida Greenways <strong>Plan</strong>ning Team, Department<br />
of Landscape Architecture of the University of Florida based on:<br />
• SWFWMD GIS acquired and proposed land data<br />
• CARL, Conservation Lands 1999, and FNAI Managed areas GIS data (FGDL)<br />
• Hillsborough County ELAPP GIS data<br />
• Atlas of Outstanding Florida Waters<br />
Hillsborough County Parks information provided by the Hillsborough <strong>Plan</strong>ning Commission was<br />
also reviewed and utilized for this report. An analysis of the GIS data layers was performed to<br />
approximate proposed and acquired land area. No public lands have been acquired for<br />
conservation purposes in this watershed, giving the <strong>Sweetwater</strong> <strong>Creek</strong> watershed a score of 0<br />
in the natural systems evaluation matrix.<br />
8.6.3 Greenways and Trails<br />
Subsection 260.012(1) (2) F.S. (The Florida Greenways and<br />
Trails Act) defines “greenways” as linear open space established<br />
along either a natural corridor such as a riverfront, stream valley,<br />
or ridgeline, or over land along a railroad right-of-way converted<br />
to recreational use, a canal, a scenic road or other route; any<br />
natural or landscaped course for pedestrian of bicycle passage;<br />
an open space connector linking parks, nature reserves, cultural<br />
features, or historic sites with each other and populated areas; or<br />
a local strip or linear park designated as parkway or greenbelt.<br />
The same statute defines “trails” as a linear corridor and any<br />
adjacent support parcel on land or water providing public access<br />
for recreation or authorized alternative modes of transportation.<br />
Greenways can be hard surfaced pathways that permit different recreational uses such as<br />
walking, jogging, skating, and biking, or they can be natural corridors with a simple path along a<br />
stream or riverbank. Many greenways connect destination points such as parks, libraries,<br />
schools, and shopping areas. A utility or drainage ROW, or an abandoned railroad corridor can<br />
be converted to a pedestrian bike or walkway. Conservation areas protecting a community’s<br />
natural resources such as rivers, streams, wetlands, wildlife, and floodways are often included<br />
in greenways. Greenways benefit the community in many ways by providing opportunities for<br />
recreation and alternative transportation, improving environmental protection, providing places<br />
for environmental education, and stimulating economic development. In the <strong>Sweetwater</strong> <strong>Creek</strong><br />
watershed, the Hillsborough County’s Greenway System includes the Town ‘N Country<br />
Greenway.<br />
8-43<br />
<strong>Sweetwater</strong> <strong>Creek</strong> <strong>Watershed</strong> Management <strong>Plan</strong>
EXISTING NATURAL SYSTEMS CONDITIONS<br />
Funding sources for the development of greenways and trails are available from:<br />
1. Recreational Trails Program - The Recreational Trails Program (RCT) is a federally<br />
competitive grant program that provides, renovates, or maintains recreational trails. The<br />
Intermodal Surface Transportation Efficiency Act ISTEA) of 1991 included the National<br />
Recreational Trails Fund Act (NRTFA) and established the National Recreational Trails<br />
Funding Program (NRTFP). The National Highway System Designation Act (NHS Act) of<br />
1995 amended and revived the NRTFA. The Transportation Equity Act for the 21 st<br />
Century (TEA-21) amended the previous legislation and provided six years of funding. In<br />
Florida, the RCT is administered by the FDEP in coordination with the U.S. Department<br />
of Transportation, Federal Highway Administration.<br />
2. Florida Recreation Development and Assistance Program - The Florida Recreation<br />
and Development Assistance Program is a competitive program that provides grants for<br />
acquisition and development of land for public outdoor recreation use.<br />
3. FDOT Transportation Enhancement Program - The Florida Department of<br />
Transportation (FDOT) Transportation Enhancement Program provides funds for<br />
transportation-related activities designed to strengthen the cultural, aesthetic, and<br />
environmental aspects of Florida’s intermodal transportation system. The program<br />
provides for implementation of a variety of projects including bike and pedestrian<br />
facilities. Projects are selected by local metropolitan planning organizations and the<br />
FDOT district offices.<br />
4. Florida Scenic Highways Program - The Florida Scenic Highways Program is<br />
administered by the FDOT. This program works with local governments to identify and<br />
protect scenic roadways throughout the state. Designated corridors, including<br />
associated greenway and trail projects, may be eligible for increased funding<br />
opportunities.<br />
8.6.4 Natural Systems Restoration<br />
The <strong>Sweetwater</strong> <strong>Creek</strong> watershed reflects a variety of land uses that have resulted in the both<br />
the conversion of natural lands to urban, suburban, commercial, and agricultural development<br />
and the degradation of remaining native habitats. Increased future land development will<br />
continue to produce adverse impacts to natural systems. Consequences of development have<br />
included: reduction in biological diversity, overall habitat quality, abundance, and distribution, as<br />
well as habitat fragmentation, species isolation, impairment of water quality, and loss of wildlife<br />
corridors. The watershed is severely impacted, and restoration is the only alternative to recapturing<br />
lost ecological and hydrological services provided by intact plant communities.<br />
Restoration strategies should include additional effort in the following areas: public<br />
environmental education and participation in restoration activities, exotic plant species removal,<br />
and the re-establishment of native habitats where they have been eliminated and/or degraded.<br />
8-44<br />
<strong>Sweetwater</strong> <strong>Creek</strong> <strong>Watershed</strong> Management <strong>Plan</strong>
CHAPTER 8<br />
High quality natural areas are a priority to both the human population and animal populations<br />
within the watershed, and the implementation of a meaningful restoration/protection plan will<br />
produce substantial ecological and aesthetic benefits. Once restoration goals are met, the<br />
County can transition to a preservation/maintenance mode that should involve a stronger<br />
partnership between the public and the County.<br />
Restoration - There are several candidate areas for restoration. Chief among these areas are<br />
the locations at which major roadways cross <strong>Sweetwater</strong> <strong>Creek</strong> where the <strong>Creek</strong> has been<br />
subject to factors that have degraded stream habitat, discouraged wildlife establishment,<br />
allowed the invasion of exotic plant species, resulted in trash accumulation in the channel, and<br />
negatively affected water quality.<br />
Priority restoration measures at these areas include:<br />
1. Diversion and treatment of untreated stormwater runoff;<br />
2. Exotic species removal;<br />
3. Reshaping channel banks to eliminate erosion and undercutting;<br />
4. Trash removal; and<br />
5. Re-establishing desirable native plant species consistent with the original habitat and<br />
compatible with the needs of each transportation facility.<br />
Other candidate areas for restoration include:<br />
1. Lake shores where shoreline vegetation has been completely cleared – Assistance<br />
should be provided to willing lakefront property owners to re-establish desirable<br />
emergent aquatic plants to promote lake fisheries, reduce erosion potential, and protect<br />
lake water quality from fertilizers and pesticides;<br />
2. Continued and expanded support for the Adopt-A-Pond program which is an outstanding<br />
example of involving the public for the benefit of the natural and human environment;<br />
3. Roadway rights-of-way where exotic species have become established – Following the<br />
removal of exotic species, desirable native species should be planted, and a<br />
maintenance program should be implemented to ensure restoration success.<br />
Appropriate signage at each restoration site should be erected for public education<br />
purposes;<br />
4. Restoration of the ecology on the original channel of <strong>Sweetwater</strong> <strong>Creek</strong>. An assessment<br />
should be done to identify channel reaches in which re-shaping of side slopes,<br />
replanting with beneficial wetland plants, and the re-establishment of upland buffers<br />
would be feasible. A plan, including costs and timeline, should be developed for each<br />
feasible project; and<br />
5. Restoration of native habitats on any publicly owned lands within the watershed – A<br />
detailed assessment of public lands, including small parks, land around public buildings,<br />
and schools should be performed in which specific areas needing restoration should be<br />
identified. Areas should be prioritized according to expected benefits to water resources<br />
8-45<br />
<strong>Sweetwater</strong> <strong>Creek</strong> <strong>Watershed</strong> Management <strong>Plan</strong>
EXISTING NATURAL SYSTEMS CONDITIONS<br />
in the watershed, and projects should be undertaken that improve and protect water<br />
quality.<br />
8.7 Regulations Protecting Natural Systems<br />
As part of the development of the <strong>Sweetwater</strong> <strong>Creek</strong> watershed management plan, existing<br />
regulatory mechanisms that protect natural communities within the watershed and throughout<br />
the County were researched and reviewed. Regulations are an important component in the<br />
protection, maintenance, preservation, and conservation of natural lands.<br />
HCEPC Wetland Rule<br />
The Hillsborough County Environmental Protection Commission’s (HCEPC) Chapter 1-11<br />
(Wetlands) Rule provides standards for the identification, protection, maintenance, and<br />
utilization of wetlands in Hillsborough County.<br />
Hillsborough County<br />
Wetlands, uplands, and environmentally sensitive areas are protected by the County Land<br />
Development Code (Ordinance No. 00-21, PART 4.01.00) requirements including set backs,<br />
buffer zones, and other mechanisms. The Natural Resources regulations protect habitats that<br />
are scarce within the county and supports the Endangered Species Act, enforcing protection of<br />
listed species and their habitats.<br />
Environmental Resource Permit<br />
The Environmental Resource Permit (ERP) process is administered by the SWFMWD and The<br />
FDEP under <strong>Part</strong> IV of Chapter 373, Florida Statutes (F.S.) and Chapters 40D-4, 40, 45, and<br />
400, Florida Administrative Code (F.A.C.). This permit provides protection for surface water<br />
bodies, wetland ecosystems, partially through coordination with the Florida Fish and Wildlife<br />
Conservation Commission, NMFS, USFWS, and the USACOE.<br />
Federal Regulation<br />
Federal protection for wetlands is provided under the Section 404 Dredge and Fill Permit<br />
administered by the USACOE and the National Pollutant Discharge Elimination System Permit<br />
(NPDES) administered by the EPA.<br />
Tampa Bay Comprehensive Conservation Management <strong>Plan</strong><br />
The Tampa Bay Estuary Program has developed a Comprehensive Conservation Management<br />
<strong>Plan</strong> that promotes improved land and water management throughout the Tampa Bay<br />
watershed, including the protection and restoration of declining natural communities that serve<br />
as indicators of the health of Tampa Bay.<br />
8-46<br />
<strong>Sweetwater</strong> <strong>Creek</strong> <strong>Watershed</strong> Management <strong>Plan</strong>
CHAPTER 8<br />
Hillsborough County Comprehensive <strong>Plan</strong><br />
County comprehensive plans are mandated by Chapter 163 F.S., as amended by the Local<br />
Government Comprehensive <strong>Plan</strong>ning and Land Development Regulation Act. This act requires<br />
the development of a comprehensive plan by each local government within Florida. Chapter 163<br />
F.S. is further defined by Rule 9J-5, F.A.C., which establishes minimum criteria for each<br />
element of the comprehensive plan. The Hillsborough Comprehensive <strong>Plan</strong> has the following<br />
elements:<br />
1. Coastal management;<br />
2. Conservation and aquifer recharge;<br />
3. Future land use;<br />
4. Transportation;<br />
5. Housing;<br />
6. Recreation and open space;<br />
7. Economically disadvantaged groups;<br />
8. Potable water;<br />
9. Sanitary sewage;<br />
10. Storm water;<br />
11. Solid waste; and<br />
12. Capital improvement projects.<br />
Elements that directly affect natural communities within the <strong>Sweetwater</strong> <strong>Creek</strong> watershed are<br />
coastal management, recreation and open space, potable water, conservation and aquifer<br />
recharge, and capital improvement projects.<br />
8.8 Public Education<br />
Public education is one of the most important components of a watershed management plan.<br />
Public outreach programs and projects can promote the participation and involvement of local<br />
residents, which contributes to the acceptance, approval, and successful implementation of this<br />
watershed management plan.<br />
The following is a summary of current public education and outreach programs throughout the<br />
state that apply to the concerns and goals of the <strong>Sweetwater</strong> <strong>Creek</strong> watershed. More specific<br />
information pertaining to these programs can be found by contacting the responsible agency by<br />
phone or through their web site.<br />
Hillsborough County implements several programs applicable county-wide, including the<br />
<strong>Sweetwater</strong> <strong>Creek</strong> watershed:<br />
1. Officer Snook Program - The Officer Snook Program teaches children about water<br />
pollution and its effect on our rivers, ponds, lakes, and streams. Officer Snook provides a<br />
8-47<br />
<strong>Sweetwater</strong> <strong>Creek</strong> <strong>Watershed</strong> Management <strong>Plan</strong>
EXISTING NATURAL SYSTEMS CONDITIONS<br />
fun and educational coloring book for each student, as well as curriculum guides and<br />
activity books for teachers who want to continue pollution prevention education in their<br />
classrooms.<br />
2. Stormwater Ecologist – This program is designed to give students and teachers the<br />
power to make responsible decisions about stormwater pollution prevention and to<br />
demonstrate how our actions all play a role in the health of the world around us.<br />
Stormwater Ecologist not only talks about making a difference, we’ll actually help you<br />
make one with our hands-on and community projects. This program incorporates<br />
aspects of science, politics, and economics, making it appropriate for a wide range of<br />
classes.<br />
3. Hillsborough County’s Adopt-A-Pond - The Adopt-A-Pond program is a public-private<br />
partnership helping neighborhoods improve their water quality, wildlife habitat value, and<br />
aesthetic value of stormwater ponds. The program is dedicated to improve pond<br />
environments. The program offers free education on stormwater runoff, storm drain<br />
marking kits, free native wetland plants, technical advice on pond management, and the<br />
opportunity to participate in a network of other members of the program. In the<br />
watershed, 24 ponds are included in the Program.<br />
4. Hillsborough County Stream Waterwatch - The Stream Waterwatch program is a<br />
cooperative effort between Hillsborough County, Hillsborough County Community<br />
College, FWC, and the SWFWMD. The goal of this program is to ensure clean and<br />
healthy streams. Volunteers are trained to collect water quality samples, to take field<br />
measurements of physical parameters, and to collect, sort, and identify<br />
macroinvertebrates. Volunteers collect monthly stream samples and measurements.<br />
They also participate in stream clean-ups, restoration projects, and related activities.<br />
5. Hillsborough County Lake Management Program - The Lake Management Program<br />
(LaMP) is a cooperative program involving Hillsborough County, University of Florida<br />
LAKEWATCH, and the University of Florida. Volunteers take monthly samples and learn<br />
about aquatic plants, water quality, and the wildlife that utilize their lakes. Citizens learn<br />
what they can do in their households and yards to improve the health of their lakes.<br />
6. Nature’s Classroom at the Wilderness Park - The Nature’s Classroom is located<br />
within the Wilderness Park, an award winning outdoor educational facility for sixth<br />
graders in Hillsborough County. Nearly 10,000 students and faculty have experienced<br />
the Hillsborough River first hand by viewing animals and plants in their natural habitats.<br />
The SWFWMD’s Hillsborough River Basin Board for flood control and water quality<br />
protection originally purchased the Wilderness Park.<br />
University of Florida/Hillsborough County Cooperative Extension Service<br />
The Cooperative Extension Service (CES) is an educational service of the University of Florida<br />
8-48<br />
<strong>Sweetwater</strong> <strong>Creek</strong> <strong>Watershed</strong> Management <strong>Plan</strong>
CHAPTER 8<br />
and Hillsborough County that provides research-based information to the public through<br />
workshops, publications, and mass media. The CES offers assistance on creating and<br />
maintaining a Florida yard, composting, creating wildlife habitat, xeriscaping, water conservation<br />
with micro-irrigation, butterfly gardening, and landscaping for beginners. Several programs are<br />
implemented in Hillsborough County:<br />
1. Master Gardener Program - The CES offers the Master Gardener Program that<br />
provides gardeners with training and the opportunity to improve their horticultural<br />
knowledge and skills. Through organized volunteer activities, gardeners then share their<br />
experience with the public. Master gardeners help to educate the community by helping<br />
gardeners solve their plant problems, promoting environmental responsibility through<br />
water conservation and pest control, beautifying Hillsborough County by teaching about<br />
appropriate plants for its climate, and working with school and community gardens.<br />
2. Backyard Wildlife Habitat Program - The CES offers the Backyard Wildlife Habitat<br />
Program, which promotes the use of native plants. The program teaches that the right<br />
selection of native plants can provide a natural food source year-round that many native<br />
plants are attracted to. When used correctly the plants will require less water, fertilizer,<br />
and pesticides.<br />
3. Florida Yards and Neighborhoods Program - The CES offers the Florida Yards and<br />
Neighborhoods Program (FYNP). The FYNP is a partnership of concerned citizens,<br />
members of the landscape industry, the University of Florida’s Cooperative Extension<br />
Service, the National Estuary Program, Florida Sea Grant College Program, and<br />
numerous environmental agencies. The program was developed to address serious<br />
problems of pollution and disappearing habitats by enlisting homeowners to help save<br />
our waterways. The program provides special education and outreach activities in the<br />
community by assisting residents to reduce pollution and enhance their environment by<br />
improving home and landscape management.<br />
SWFWMD Environmental Education Programs<br />
SWFWMD implements several programs throughout it 16-county service area that includes<br />
Hillsborough County:<br />
1. Xeriscape - The xeriscape program promotes water conservation through creative<br />
landscaping. Landscapes that conserve water will save the homeowner money on water,<br />
energy, and maintenance bills, and will help preserve valuable fresh water resources<br />
and provide wildlife habitat. The program guides homeowners through a seven-step<br />
process including 1) design, 2) plant selection, 3) improving the soil, 4) wise utilization of<br />
turf, 5) efficient irrigation, 6) using mulch, and 7) maintenance.<br />
2. SWFWMD In-School Education Programs - The In-School Education Program helps<br />
achieve the SWFWMD’s goal of preserving and protecting water resources and related<br />
8-49<br />
<strong>Sweetwater</strong> <strong>Creek</strong> <strong>Watershed</strong> Management <strong>Plan</strong>
EXISTING NATURAL SYSTEMS CONDITIONS<br />
ecosystems through educational materials for teachers and students from Kindergarten<br />
through grade 12.<br />
3. SWFWMD Mini-grants is a program that offers teachers funding to do classroom<br />
projects on water quality, water supply, water conservation, or watersheds. Applications<br />
are available through the SWFWMD at<br />
http://www.swfwmd.state.fl.us/infoed/educators/minigrants/hillsboroughmg.pdf.<br />
4. SWFWMD Teacher workshops provide teachers information on water resources in the<br />
<strong>Sweetwater</strong> <strong>Creek</strong> watershed, as well as hands-on activities and strategies for the best<br />
instructional methods on water issues.<br />
5. Project WET is an inter-disciplinary water education program for teachers and other<br />
educators working with young people in Kindergarten through grade 12. The program<br />
can be integrated into existing curricula of a school, museum, or community<br />
organization. The goal of the project is to facilitate and promote appreciation,<br />
awareness, knowledge, and stewardship of water resources though the development of<br />
classroom-ready teaching aids and the through the establishment of internationally and<br />
state-sponsored Project WET programs. The Project WET Curriculum and Activity Guide<br />
is a collection of over 90 innovative, interdisciplinary activities that are hands-on, easy to<br />
use, and fun. Designed with a commitment to state, provincial, and national education<br />
standards, Project WET activities cover diverse topics and disciplines. The Project WET<br />
Curriculum and Activity Guide activities promote critical thinking and problem-solving<br />
skills. These activities help provide young people with the knowledge and experience<br />
they will need to make informed decisions regarding water resource management.<br />
6. The Envirothon is a problem-solving, natural resource education program for high school<br />
students. Student team to solve problems and conduct hands-on investigations about<br />
forestry, soils, aquatics, wildlife, and current environmental issues. SWFWMD sponsors<br />
an annual Envirothon in Hillsborough County inviting local high schools to compete<br />
against each other in solving problems in various disciplines.<br />
7. Florida Waters Project Teacher’s Guides is a set of activities and background<br />
information designed to encourage students to investigate and explore the water<br />
systems in their communities, to learn more about water issues and land resources in<br />
their communities, and to take an active role in the protection and preservation of our<br />
precious water resources.<br />
8. SWFWMD Water Matters is a set of multi-disciplinary activities and background<br />
information designed to help students learn about the process of water management and<br />
how they can be involved with the process. Water Matters is available to the public.<br />
8-50<br />
<strong>Sweetwater</strong> <strong>Creek</strong> <strong>Watershed</strong> Management <strong>Plan</strong>
CHAPTER 8<br />
9. My Water Activity Book is full of fun activities to help students from kindergarten through<br />
2 nd grade learn about water resources by coloring and completing mazes, word games,<br />
dot-to-dot, and puzzles. This book is available to teachers and students.<br />
10. SWFWMD Splash! Water Education Packet is a colorful, multidisciplinary middle school<br />
packet containing fact and activity sheets on wetlands, the hydrologic cycle,<br />
desalination, water use, water conservation, community planning, and water<br />
management. The packet is free to educators.<br />
11. Water Drops Newsletter is a water resource newsletter available to teachers from grades<br />
3 through 5. Newsletter issues come with a teacher’s guide on water conservation, water<br />
cycle, and a visit to a nature park. The newsletter was designed to assist teachers<br />
discuss water related issues with their students.<br />
12. The <strong>Watershed</strong> Education Resources Box is a collection of puppets, poetry, fiction, and<br />
non-fiction available to teachers to help students understand watersheds and the<br />
importance of watersheds.<br />
13. The <strong>Watershed</strong> Excursion Tabloid includes information about watersheds found<br />
throughout the SWFWMD, explains to students why watersheds are important to<br />
Florida’s ecosystems, and how we can all work to keep our watersheds clean and<br />
healthy.<br />
14. The Water Education Week Publications were created and distributed in conjunction<br />
with the Newspaper In-Education Program. This 16-page newspaper tabloid with<br />
teacher’s guide focuses on a particular water topic each year. Materials are designed for<br />
grades 4 to 7. The booklets on water quality, habitats, water management and use,<br />
technology, and sustainability are available as class sets and are free to educators.<br />
15. The Water From the Ground Up is a full curriculum available to teachers that includes<br />
text, a teacher’s guide, an activity book, and basic District hydrologic information for<br />
students in grades 3 to 5. The curriculum includes topics on surface water and<br />
groundwater sources in west central Florida, water quality, water use, floods, droughts,<br />
and water conservation.<br />
16. The Water Watchers is a video and teacher’s guide available to kindergarten through<br />
grade 3 teachers that includes classic children’s songs with water resource lyrics. It also<br />
features simple experiments to illustrate such concepts as the hydrologic cycle, water<br />
pollution, saltwater intrusion, etc.<br />
8-51<br />
<strong>Sweetwater</strong> <strong>Creek</strong> <strong>Watershed</strong> Management <strong>Plan</strong>
EXISTING NATURAL SYSTEMS CONDITIONS<br />
17. Who Gets the Water? is an interdisciplinary curriculum available to middle school<br />
teachers that provides a basic understanding of the environmental and economic<br />
concepts necessary to make good decisions in the face of limited resources.<br />
Florida Department of Education, Office of Environmental Education, Environmental<br />
Program<br />
The Florida Department of Education has divided Florida into several Environmental Education<br />
Regional Service Areas. The <strong>Sweetwater</strong> <strong>Creek</strong> watershed is within Regional Service IV that<br />
covers Charlotte, De Soto, Glades, Hardee, Hendry, Hernando, Highlands, Hillsborough, Lee,<br />
Manatee, Pasco, Pinellas, Polk, and Sarasota counties. Each regional service area has several<br />
environmental projects, including the promotion of “Teaching Naturally.” This is an<br />
interdisciplinary guide using activities to make education real for students by using the<br />
environment as an integral concept across subject areas for all grade levels. The mission of<br />
Regional Service Projects (RSP) is to assist their region's pre-K through 12 schools, colleges,<br />
and universities in improving teaching and learning through environmental education. The RSP<br />
IV functions include:<br />
• Conducting assessments of educational needs of teachers and students that<br />
environmental education can meet;<br />
• Soliciting and brokering resources to match the needs of teachers, preservice educators,<br />
and students that environmental education can meet;<br />
• Publishing and distributing Regional Resource Guides that cover a broad spectrum of<br />
regional, state, and national resources for educator use;<br />
• Developing and supporting a cadre of skilled facilitators, most of whom are classroom<br />
teachers, to deliver workshops;<br />
• Developing materials and workshops that link environmental education with Sunshine<br />
State Standards;<br />
• Collaborating with Area Centers for Educational Enhancement to improve teaching and<br />
enhance student performance; and<br />
• Assisting post-secondary educators in integrating environmental education concepts and<br />
methods in their teaching.<br />
Materials developed by the program of the Office of Environmental Education are distributed at<br />
no cost to the public.<br />
Florida Fish and Wildlife Conservation Commission implements several programs stateside,<br />
including Hillsborough County and the <strong>Sweetwater</strong> <strong>Creek</strong> watershed:<br />
1. Project WILD is a supplementary, interdisciplinary instructional program for teachers of<br />
kindergarten through high school age students. It is a way for teachers to incorporate<br />
concepts related to people, wildlife, and a healthy environment into major school<br />
subjects and skill areas. WILD activities are organized around a conceptual framework<br />
8-52<br />
<strong>Sweetwater</strong> <strong>Creek</strong> <strong>Watershed</strong> Management <strong>Plan</strong>
CHAPTER 8<br />
that addresses awareness and appreciation of wildlife, human values and wildlife,<br />
wildlife and ecological systems, wildlife conservation, cultural and social interaction with<br />
wildlife, wildlife issues and trends, and responsible human actions. Project WILD is one<br />
of the most widely used conservation and environmental education programs among<br />
educators. It is based on the premise that young people and educators have a vital<br />
interest in learning about our natural world. The program emphasizes on wildlife<br />
because of its intrinsic and ecological values, as well as its importance as a basis for<br />
teaching how ecosystems function. Project WILD addresses the need for human beings<br />
to develop as responsible citizens of our planet.<br />
2. FWC Schoolyard Wildlife Project is an environmental education program that teaches<br />
teachers, parents, and students how to turn school grounds into an effective outdoors<br />
classroom. The Schoolyard Wildlife Project’s resources help incorporate Florida’s<br />
natural history into school curricula to teach environmental awareness, problem-solving,<br />
basic biology, and ecological principles. Two types of hands-on, interactive, one-day<br />
workshops are offered: Schoolyard Activities & Ecology and Schoolyard Ecosystems. A<br />
combination weekend workshop is offered twice a year. The Schoolyard Activities &<br />
Ecology workshop provides teachers with high quality, Florida-specific natural history<br />
and ecology lessons, and natural science explorations. This four- to six-hour workshop<br />
targets educators in grades K-6. The Schoolyard Ecosystems workshop teaches<br />
educators about local ecosystems and how to involve their students in the creation,<br />
restoration, or enhancement of native wildlife habitats on school grounds. This six-hour<br />
workshop targets educators in grades K-12. The Schoolyard Wildlife Activity Guide and<br />
Schoolyard Ecosystems book can be received only by attending the workshop.<br />
3. Florida Wildlife Federation Backyard Wildlife Habitat Program - The Florida Wildlife<br />
Federation, together with the National Wildlife Federation, offers all Florida residents an<br />
opportunity to take part in the Backyard Wildlife Habitat Program. The program’s goal is<br />
to promote and expand gardening for wildlife in Florida. This program promotes the use<br />
of native plants, wildlife habitat creation, water conservation, and the use of fewer<br />
fertilizers and pesticides to result in less water pollution. As a result, the homeowner<br />
trades time-consuming lawn care for hours spent watching birds, butterflies, and small<br />
mammals.<br />
Tampa Audubon Society Audubon Resource Center<br />
The Tampa Audubon Society is a non-profit organization dedicated to preserving Florida's<br />
resources and unique habitats. It is one of 45 chapters in Florida that assist members and other<br />
community leaders in taking on the challenges of local environmental conservation, education,<br />
and advocacy. The Tampa Audubon Society offers conservation education and outreach<br />
programs to students, providing solid, science-based curricula and site-based programs in<br />
subjects as far reaching as aquifer function and wetland conservation. Outdoor and experiencebased<br />
conservation education is the heart of Audubon's work in Tampa Bay area. By giving<br />
children, families, and adults the opportunity to experience Florida's natural resources and<br />
8-53<br />
<strong>Sweetwater</strong> <strong>Creek</strong> <strong>Watershed</strong> Management <strong>Plan</strong>
EXISTING NATURAL SYSTEMS CONDITIONS<br />
identify wildlife and habitat types, the Audubon helps to create and nurture a culture of<br />
conservation.<br />
Within the Tampa Bay area, factors such as the elimination of wetlands development,<br />
decreased water quality, and an increase in population make it essential for residents to<br />
understand the Tampa Bay ecosystem so that growth and development can proceed in<br />
harmony with nature. Being intimately involved with these issues, the Audubon Society has<br />
developed a unique partnership with the Hillsborough County Parks and Recreation<br />
Department. Through this partnership, an Audubon Resource Center (ARC) was established in<br />
April 1998 at Lettuce Lake Park. The purpose of the ARC is to help foster a "culture of<br />
conservation" and an environmental ethic in the Tampa Bay region that will encourage<br />
community involvement as part of the Audubon mission. The Hillsborough River borders the<br />
240-acre urban park and visited by 650,000 people each year, including school classes, clubs,<br />
inner-city youth, minorities, and families.<br />
The ARC at the Lettuce Lake Park is designed to enhance Audubon's education and community<br />
involvement goals and helps citizens develop an appreciation, awareness, and understanding of<br />
the natural world and the interplay of forces that affect living things. The ARC is a multi-faceted<br />
hub for conservation and utilizes guided tours, educational brochures and materials, and handson<br />
activities like nest box building and habitat enhancement to reach its goals. The Center<br />
includes a natural history exhibit, nature store, and resource center full of books and<br />
informational materials. The exhibit shows wildlife of Tampa Bay and the Hillsborough River in<br />
their natural setting, giving students, young and old, a close look at the interrelationship of the<br />
ecosystem.<br />
The attached bibliography includes a list of references used for this study and additional<br />
references that could be cited by readers.<br />
8.9 Bibliography<br />
Australian Commissioner for the Environment. 1988. Rating of stream water quality and health<br />
based on existing vegetation and development activities within a watershed. AOCE. Victoria.<br />
Brown, M.T., J. Schaefer, K. H. Brandt, S. J. Doherty, C.D. Dove, J.P. Dudley, D. A. Eifler, L. D.<br />
Harris, R. F. Noss, and R. W. Wolfe. 1987. An evaluation of the applicability of upland buffers<br />
for the wetlands of the Wekiva Basin. Center for Wetlands, University of Florida, Gainesville,<br />
Florida.<br />
Brown, M.T., J. M. Schaefer, and K. H. Brandt. 1990. Buffer zones for water, wetlands, and<br />
wildlife in east central Florida. Center for Wetlands, University of Florida, Gainesville, Florida.<br />
8-54<br />
<strong>Sweetwater</strong> <strong>Creek</strong> <strong>Watershed</strong> Management <strong>Plan</strong>
CHAPTER 8<br />
Carlisle, V.W., R.E. Caldwell, F. Sodek, III, L.C. Hammond, F.G. Calhoun, M.A. Granger, and<br />
H.L Breland. 1978. Characterization data for selected Florida Soils. Univ. of Florida IFAS.<br />
Gainesville, FL.<br />
Cox, J., R. Kautz, M. MacLaughlin, and T. Gilbert. 1994. Closing the Gap in Florida’s Wildlife<br />
Habitat Conservation System. Florida Fish and Wildlife Conservation Commission (formerly<br />
Florida Game and Fresh Water Fish Commission). Tallahassee, FL.<br />
Cowell, BC. 1973. Aquatic insect survey of the Upper Tampa Bay <strong>Watershed</strong> Project and the<br />
<strong>Sweetwater</strong> <strong>Creek</strong> <strong>Watershed</strong> Project. Report prepared for SWFWMD, Brookeville, FL.<br />
Florida Department of Agricultural and Consumer Services. 1938 – 39. Aerial photos of<br />
Hillsborough County.<br />
Florida Department of Transportation. 1999. Florida land use, cover and forms classification<br />
system. Florida Department of Transportation State Topographic Bureau Thematic Mapping<br />
Section.<br />
Florida Fish and Wildlife Conservation Commission (formerly Florida Game and Fresh Water<br />
Fish Commission). 1992. Final report: Aquatic and Terrestrial Wildlife Survey in the Lake Tarpon<br />
<strong>Watershed</strong>. FFWCC. Tallahassee, FL.<br />
Florida Fish and Wildlife Conservation Commission (formerly Florida Game and Fresh Water<br />
Fish Commission). Jan, 2004. Florida's Endangered Species, Threatened Species and Species<br />
of Special Concern, Official Lists. FFWCC. Tallahassee, FL.<br />
Florida Land Boundary Information system. 2003. General Land Office Township plats and<br />
survey notes. http://labins.data.org\.<br />
Florida Natural Areas Inventory. 1997. Matrix of habitats and distribution by county of<br />
rare/endangered species of Florida.<br />
Florida Natural Areas Inventory. 1990. The natural communities of Florida. FDEP.<br />
Tallahassee. FL.<br />
Harper, R.M. 1921. Thirteenth Annual Report: The Geography of Central Florida. Florida State<br />
Geological Survey. Tallahassee, FL.<br />
Harris, L D. 1991. The need, rationale and implementation of wildlife dispersal corridors. Issue<br />
IV in a series of papers for the S.W.I.M. Model Ordinance Project. Surface Water Improvement<br />
and Management Program of the Southwest Florida Water Management District, Brooksville,<br />
Florida.<br />
8-55<br />
<strong>Sweetwater</strong> <strong>Creek</strong> <strong>Watershed</strong> Management <strong>Plan</strong>
EXISTING NATURAL SYSTEMS CONDITIONS<br />
Maher, D. 1990. The Florida panther and private lands. Conservation Biology. 4:1-4.<br />
McElfresh, R., J. Inglis, and B. Brown. 1980. Gray squirrel usage of hardwood ravines within<br />
pine plantations. Proceedings of the Louisiana State University Forestry Symposium.<br />
Myers, R. L. and J. J. Ewel (eds.). 1990. Ecosystems of Florida. University of Central Florida<br />
Press.<br />
Miller, S. H, and J. H. Schaefer. 1998. Hardwood hammock fragments: relationships between<br />
human population growth and wildlife species richness. Fla. Game and Fresh Water Fish<br />
Comm. Final Report. Tallahassee. 90pp + vi.<br />
National Resources Conservation Service (formerly, Soil Conservation Service). 1915, 1958,<br />
and 1989. Soil Survey of Hillsborough County, Florida.<br />
Soil Conservation Society of America. 1987. Twenty-six Ecological Communities of Florida.<br />
SCSOA. Gainesville, FL.<br />
Southwest Florida Water Management District Ecologic Evaluation Section. 2004. Minimum and<br />
Guidance Levels for Crescent Lake in Hillsborough County, FL. SWFWMD. Brooksville, FL.<br />
Southwest Florida Water Management District Ecologic Evaluation Section. 2005. Directory of<br />
Lakes. SWFWMD. Brooksville, FL.<br />
Southwest Florida Water Management District Land Resources Department. Dec, 2004. Florida<br />
Forever Work <strong>Plan</strong> Annual <strong>Update</strong> - 2005. SWFWMD. Brooksville, FL.<br />
United States Code of Federal Regulations, Title 50, <strong>Part</strong>s 17.11 and 17.12. October 1, 1997.<br />
Endangered and Threatened Wildlife and <strong>Plan</strong>ts.<br />
United States Department of Agriculture. 1916. Field operations of the Bureau of Soils. 18 th<br />
Annual Report – Soil Survey of Hillsborough County. USDA. Washington, DC.<br />
United States Department of Agriculture. 1958. Soil Survey of Hillsborough County. USDA.<br />
Washington, DC.<br />
United States Department of Agriculture. 1983. Soil Survey of Hillsborough County. USDA.<br />
Washington, DC.<br />
University of South Florida. Florida Center for Community Design + Research. 2005.<br />
Hillsborough Water Atlas. http://map.wateratlas.usf.edu/website/hills\.<br />
8-56<br />
<strong>Sweetwater</strong> <strong>Creek</strong> <strong>Watershed</strong> Management <strong>Plan</strong>
CHAPTER 8<br />
Wolfe, S. H., and R.D. Drew, eds. 1990. An ecological characterization of the Tampa Bay<br />
watershed. U.S. Fish and Wildlife Service Biological Report 90(20).<br />
8.10 List of Common and Scientific Names for <strong>Plan</strong>ts and Animals<br />
Mentioned in Report<br />
Trees<br />
Australian pine, Casuarina equisetifolia<br />
Bald cypress, Taxodium distichum<br />
Bluejack oak, Quercus incana<br />
black gum, Nyssa sylvatica var sylvatica<br />
Brazilian pepper, Schinus terebinthifolius<br />
Carolina holly, Ilex ambigua<br />
Carolina willow, Salix caroliniana<br />
castor bean, Ricinus communis<br />
chinaberry tree, Melia azedarach<br />
Chinese tallow tree, Sapium sebiferum<br />
dahoon, Ilex cassine<br />
laurel oak, Quercus laurifolia<br />
lobllolly bay, Gordonia lasianthus<br />
loblolly pine, Pinus taeda<br />
longleaf pine, Pinus palustris<br />
Pond cypress, Taxodium ascendens<br />
punk tree, Melaleuca quinquenervia<br />
red maple, Acer rubrum<br />
sand live oak, Quercus geminata<br />
slash pine, Pinus elliottii<br />
southern red maple, Acer rubrum<br />
swamp bay, Persea palustris<br />
sweetbay, Magnolia virginiana<br />
Turkey oak, Quercus laevis<br />
Shrubs<br />
Beautyberry, Callicarpa Americana<br />
Buttonbush, Cephalanthus occidentalis<br />
Darrow’s blueberry, Vaccinium darrowii<br />
Fetterbush, Lyonia lucida<br />
Gallberry, Ilex glabra<br />
Gopher apple, Licania michauxii<br />
saw palmetto, Serenoa repens<br />
shiny blueberry, Vaccinium myrsinites<br />
8-57<br />
<strong>Sweetwater</strong> <strong>Creek</strong> <strong>Watershed</strong> Management <strong>Plan</strong>
EXISTING NATURAL SYSTEMS CONDITIONS<br />
staggerbush, Lyonia ferruginea<br />
tarflower, Bejaria racemosa<br />
titi, Cyrilla racemosa<br />
Virginia willow, Itea virginiana<br />
Wax myrtle (southern bayberry), Myrica cerifera<br />
Herbs<br />
Adam’s needle, Yucca filamentosa<br />
air potato, Dioscorea bulbifera<br />
alligator flag (fire flag), Thalia geniculata<br />
Alligator weed, Alternanthera philoxeroides<br />
Arrowhead, Sagittaria lancifolia<br />
ball moss, Tillandsia recurvata<br />
Beak rush, Rhyncospora sp.<br />
bladderwort, Utricularia purpurea<br />
bladderwort, Utricularia inflata<br />
bog buttons, Lachnocaulon anceps<br />
bushy bluestem, Andropogon glomeratus<br />
Cardinal airplant, Tillandsia fasciculata<br />
Carolina elephant’s foot, Elephantous carolinianus<br />
Cattail, Typha, latifolia<br />
Cattail, Typha domingensis<br />
Chinese ladder brake, Pteris vittata<br />
Cinnamon fern, Osmunda cinnamomea<br />
cogon grass, Imperata cylindrical/I. brasiliensis,<br />
drumheads, Polygala cruciata<br />
duckweed, Spirodela punctata<br />
dwarf pawpaw, pygmaea<br />
eastern milk pea, Glactia regularis<br />
false nettle, Boehmeria cylindrica<br />
fire flag (alligator flag), Thalia geniculata<br />
giant airplant, Tillandsia utriculata<br />
golden polypody, Phlebodium aureum<br />
goldenrod, Solidago fistulosa.<br />
greenvein ladies’ tresses, Spiranthes praecox<br />
maidencane, Panicum hemitomon<br />
marsh fern, Thelypteris palustris<br />
early whitetop fleabane, Erigeron vernus<br />
meadow beauty, Rhexia sp.<br />
meadow spikemoss, Selaginalla apoda<br />
netted chain fern, Woodwardia areolata<br />
parrot’s feather, Myriophyllum heterophyllum<br />
Pink sundew, Drosera capillaris<br />
8-58<br />
<strong>Sweetwater</strong> <strong>Creek</strong> <strong>Watershed</strong> Management <strong>Plan</strong>
CHAPTER 8<br />
redroot, Lachnanthes caroliana<br />
royal fern, Osmunda regalis<br />
sand cordgrass, Spartina bakeri<br />
sawgrass, Cladium jamaicensis<br />
skunk vine, Paederia foetida<br />
sky-blue lupine, Lupinus diffusus<br />
southern needleleaf, Tillandsia simulate<br />
Southern shield fern, Thelypteris kunthii<br />
Small butterwort, Pinguicula pumila<br />
Soft rush, Juncus effuses<br />
Spanish moss, Tillandsia usneoides<br />
Spatterdock, Nuphar luteum<br />
spike rush, Eleocharis sp.<br />
Spring ladies’ tresses, Spiranthes vernalis<br />
St John’s wort, Hypericum fasciculatum<br />
toothed mid-sorus fern, Blechnum serrulatum<br />
tropical soda apple, Solanum viarum<br />
Virginia chain fern, Woodwardia virginica<br />
Water hoarhound, Lycopus rubellus<br />
water hyacinth, Eichhornia crassipes<br />
Water lettuce, Pistia stratoides<br />
whitetop sedge, Rhynchospora colorata<br />
white water lily, Nyphaea odorata<br />
wild taro, Colocasia esculenta<br />
wiregrass, Aristida beyrichiana<br />
yellow butterwort, Pinguicula lutea<br />
yellow-eyed grass, Xyris sp.<br />
ANIMAL SPECIES<br />
Reptiles<br />
American alligator, Alligator mississippiensis<br />
Birds<br />
Little blue heron, Egretta caerulea<br />
Snowy egret, Egretta thula<br />
Tricolored heron, Egretta tricolor<br />
White ibis, Eudocimus albus<br />
Wood stork, Mycteria americana<br />
8-59<br />
<strong>Sweetwater</strong> <strong>Creek</strong> <strong>Watershed</strong> Management <strong>Plan</strong>
CHAPTER 9: WATER SUPPLY<br />
9.1 Overview<br />
The combination of increased water demand with the highly karstic nature of the watershed’s<br />
geology has resulted in the development of a number of critical issues relating to water supply,<br />
including:<br />
• lowered average water levels and increased fluctuations in lakes and wetlands<br />
• declines in average elevations of the potentiometric surface and the water table<br />
• increased annual fluctuations in the elevations of the potentiometric surface and the water<br />
table<br />
• reduced streamflows in <strong>Sweetwater</strong> <strong>Creek</strong><br />
• saltwater contamination of coastal groundwater sources due to saline intrusion and<br />
upconing in coastal areas<br />
• reduced reliability of private water supply wells<br />
• increased sinkhole occurrence<br />
• contamination of groundwater resources by septic tanks and stormwater runoff<br />
As a result of these issues, increased emphasis has been placed on the development of alternative<br />
water supply sources, reuse, off-line reservoirs, surface water withdrawals, aquifer storage and<br />
recovery, and water conservation programs in the region. In 2002, an estimated 36% of the<br />
County’s water demand was supplied by surface waters, a figure that is 3% higher than in 1993.<br />
This entire amount was derived from the Hillsborough River Reservoir system which provides the<br />
majority of the City of Tampa’s water supply. The reservoir system includes the Hillsborough<br />
River, Sulphur Springs, and the Tampa Bypass Canal. Groundwater resources occur throughout<br />
the county; however, higher quality groundwater is typically found with increasing distances from<br />
the coast.<br />
Sinkhole formation occurs throughout the county with most occurrences reported in northern and<br />
western Hillsborough County. The Northwest Hillsborough County area is considered to be an area<br />
of “very numerous” sinkhole formation, particularly the cover – collapse category of sinkholes that<br />
occur abruptly. The Florida Department of Environmental Protection (FDEP) Sinkhole Database<br />
(2006) lists a total of 84 sinkholes have been reported in the Northwest Hillsborough area, many of<br />
which occurred in the vicinity of the Cosme, Section 21, and Eldridge – Wilde Wellfields. For<br />
example, within 1 month of increasing the pumping rate at Section 21 wellfield, 64 new sinkholes<br />
formed within a 1-mile radius of the wellfield. Most of the sinkholes were formed in the vicinity of<br />
well 21-10, which was pumping at nearly twice the rate of the other wells. Neighboring areas also<br />
noticed dramatic declines in lake levels and dewatering of wetland areas.<br />
9-1 <strong>Sweetwater</strong> <strong>Creek</strong> <strong>Watershed</strong> Management <strong>Plan</strong>
WATER SUPPLY<br />
At this point it is recognized that sinkholes can occur as a result of natural geologic phenomena<br />
and by the influence of human activities including groundwater pumping, well construction, building<br />
construction, etc. The <strong>Sweetwater</strong> <strong>Creek</strong> watershed is located in an area of “highest hazard” for<br />
sinkhole formation.<br />
The entire Northwest Hillsborough <strong>Watershed</strong> area lies within the Northern Tampa Bay Water Use<br />
Caution Area (NTBWUCA), an area that includes Pinellas County, western and central<br />
Hillsborough County, and western and southern Pasco County. This designation was created in<br />
1989 by the Southwest Florida Water Management District (SWFWMD) in response to the impacts<br />
observed in connection with groundwater withdrawals and the anticipated future increases in water<br />
demand in the area. Through this designation, the District developed a resource assessment and<br />
recovery strategy to be implemented through a combination of regulatory measures, conservation<br />
and supply projects, and voluntary compliance. The components of the assessment and recovery<br />
strategy are enunciated in Rule 40D-8, Florida Administrative Code (F.A.C.) and included:<br />
• “All water use permittees within the Area are addressed by this Rule 40D-80.073, F.A.C.<br />
However, Tampa Bay Water ….. facilities account for the majority of water withdrawals<br />
within the Area. For this reason, these facilities are the primary focus of the portion of the<br />
recovery strategy encompassed by this Rule 40D-80.073, F.A.C. Other users ….. are<br />
addressed in 40D-80.073(5), F.A.C.”<br />
• “Recovery to Wetland and Lake Minimum Levels for wetlands and lakes described in and<br />
established in 40D-8 …. is the objective of this Rule 40D-80.073, F.A.C.”<br />
• “…the Floridan Aquifer Recovery Management Levels set forth in Table 80-1 below shall be<br />
used as long-term guidelines for allocating withdrawals within the Operations <strong>Plan</strong>,<br />
submitted to the District by TBW pursuant to the Agreement, and shall be reevaluated in<br />
2010.”<br />
• Based on that analysis and evaluation, on or before December 31, 2010, the District will<br />
initiate rulemaking to revise the MFLs…as necessary; adopt rules to implement the existing<br />
or the New MFLs…; and incorporate a second phase to this Recovery Strategy.<br />
The Interim Recovery monitoring effort focuses on addressing other (non –Tampa Bay Water)<br />
water use, supplemental hydration of lakes and wetlands, and new applications for water use. The<br />
portion of the District's recovery strategy embodied within this Rule is the first regulatory phase of a<br />
long-term approach toward eventual attainment of the Minimum Flows and Levels Program goals.<br />
All users, including public water supply utilities, are required to incorporate conservation measures<br />
as a means of reversing detrimental environmental trends such as lake level declines and adverse<br />
wetland impacts. A number of planning efforts have been developed to protect and enhance water<br />
supplies in the Northwest Hillsborough watersheds. These include:<br />
9-2<br />
<strong>Sweetwater</strong> <strong>Creek</strong> <strong>Watershed</strong> Management <strong>Plan</strong>
CHAPTER 9<br />
Hillsborough County Comprehensive <strong>Plan</strong> (Conservation and Aquifer Recharge Element) – The<br />
purpose of the Conservation and Aquifer Recharge Element of the County’s Comprehensive <strong>Plan</strong><br />
is to provide a plan and policy direction for the preservation, conservation, and management of the<br />
natural resources of Hillsborough County. The plan provides guidelines for future governmental<br />
programs and decisions related to the protection and enhancement of the County's natural<br />
environment, as well as the public health, safety and welfare. The objective of the Conservation<br />
and Aquifer Recharge Element is to ensure that the air, land, water and living resources of<br />
Hillsborough County remain an asset, rather than become a liability, to the quality of life of all<br />
existing and future inhabitants.<br />
Hillsborough County Water Resources Team Goals – The mission of the Hillsborough County<br />
Water Resource Team is to address water supply and natural resource protection issues, as they<br />
relate to projects proposed or operated in Hillsborough County by Tampa Bay Water. Specifically,<br />
the Water Resource Team is to:<br />
• Pro-actively coordinate with Tampa Bay Water to develop new and innovative water supply<br />
projects that are sensitive to the protection of natural resources<br />
• Protect the County's environmental resources from adverse impacts that may result from<br />
water supply development projects undertaken by Tampa Bay Water<br />
• Evaluate the water supply projects proposed by Tampa Bay Water for public health,<br />
ecological sustainability and cost effectiveness, in order to influence Tampa Bay Water to<br />
improve the projects in those areas where deficiencies exist<br />
• Evaluate the operation of Tampa Bay Water's existing water supply projects and<br />
recommend actions to protect the County's environmental resources from adverse impacts<br />
• Evaluate related proposed plans, rules and other initiatives undertaken by the Southwest<br />
Florida Water Management District and the Florida Department of Environmental Protection<br />
with the aim of protecting the County's environmental resources and safeguarding the<br />
quality of life for citizens of Hillsborough County<br />
• Recommend action to the Board of County Commissioners and the Hillsborough County<br />
Environmental Protection Commission that will safeguard the rights of the County, its<br />
citizenry and the Environmental Protection Commission<br />
Southwest Florida Water Management District Water Management <strong>Plan</strong> (DWMP) - The 2005<br />
District Water Management <strong>Plan</strong> (<strong>Plan</strong>) was accepted by the Governing Board in July 2005 and<br />
represented the second five-year update of the District’s “comprehensive plan.” The <strong>Plan</strong> serves as<br />
a guide to the District in carrying out all its water resource management responsibilities, including<br />
those for Water Supply, Flood Protection, Water Quality and Natural Systems, and also reflects the<br />
District’s Management Services support activities. It plays a significant role in ensuring<br />
coordination and consistency of District planning and management, as well as helping to link the<br />
District’s activities with the planning and management activities of local governments and other<br />
agencies.<br />
9-3<br />
<strong>Sweetwater</strong> <strong>Creek</strong> <strong>Watershed</strong> Management <strong>Plan</strong>
WATER SUPPLY<br />
Southwest Florida Water Management District Northern Tampa Bay Water Resources<br />
Assessment Project (NTBWRAP) and Northern Tampa Bay Phase II Program (NTB II) - The<br />
Northern Tampa Bay Water Use Caution Area was designated in 1989, and it precipitated the<br />
expansion and development of projects to collect data and assess water resource conditions. In<br />
1996, the District published the final report of a multi-year study which assessed the regional water<br />
resources of the Northern Tampa Bay area. This study, known as the Northern Tampa Bay Water<br />
Resources Assessment Project, was an effort to better understand the current state of the water<br />
resources of the area, as well as to provide the foundation for future, more detailed, hydrogeologic<br />
and biologic studies.<br />
Since that time, the District has entered into a <strong>Part</strong>nership Agreement with Tampa Bay Water and<br />
its member governments to reduce groundwater withdrawals in the area from 158 mgd to 90 mgd<br />
by <strong>2007</strong>. Additionally, the District has established a Minimum Flows and Levels Rule (40D-8),<br />
which includes minimum levels for cypress wetlands, lakes, and aquifers.<br />
As a follow-up to previous hydrologic and biologic analyses performed in the Northern Tampa Bay<br />
area, the Southwest Florida Water Management District has launched a new program known as<br />
the Northern Tampa Bay Phase II program (NTB II). NTB II consists of a series of technical<br />
projects in Northern Tampa Bay to support the ongoing development of minimum flows and levels,<br />
water resources recovery, water use permitting, and environmental resource permitting.<br />
Southwest Florida Water Management District’s Northwest Hillsborough Basin Board – The<br />
basin board has approved a total of $6,831,519 for water supply-related projects for FY2006, many<br />
of which directly affect the region of northwest Hillsborough covered in this report.<br />
Tampa Bay Water’s Master Water <strong>Plan</strong> - Originally approved in 1995 and revised several times<br />
since then, this plan is currently aimed at providing a total capacity of 111 million gallons per day<br />
(mgd) of water supply by 2008 and reducing demand through conservation. The Master Water<br />
<strong>Plan</strong> is the blueprint to meet long-term drinking water needs for the people of the Tampa Bay<br />
region. This strategic plan studies, analyzes and compares water supply options. The options<br />
proven to be technically feasible, environmentally sound and economical are selected and<br />
implemented by Tampa Bay Water's Board of Directors (Figures 9-1A and 9-1B).<br />
The first configuration of the Master Water <strong>Plan</strong> project is nearing completion, with many of the<br />
projects having been implemented in the 2002 – 2005 timeframe. This group of water supply<br />
projects will meet regional water demands through 2012. Currently, Tampa Bay Water is working<br />
on a second configuration of projects to meet future demand in 2012 and beyond.<br />
9-4<br />
<strong>Sweetwater</strong> <strong>Creek</strong> <strong>Watershed</strong> Management <strong>Plan</strong>
CHAPTER 9<br />
Figure 9-1A Tampa Bay Water Existing Facilities<br />
(Source: Tampa Bay Water, 2006)<br />
Figure 9-1B Tampa Bay Water Future Infrastructure<br />
(Source: Tampa Bay Water, 2006)<br />
9-5<br />
<strong>Sweetwater</strong> <strong>Creek</strong> <strong>Watershed</strong> Management <strong>Plan</strong>
WATER SUPPLY<br />
9.2 Groundwater Use<br />
Hydrogeologic Setting - The project area constitutes a hydrogeologic transition zone between the<br />
northern and southern regions of the SWFWMD’s 16-county service area. The surficial aquifer is<br />
composed of unconsolidated deposits of fine-grained sand, silt, and clayey sands having an<br />
average thickness of 30 feet. The elevation of the water table ranges from 5 feet NGVD to<br />
approximately 50 feet NGVD in the northern portion of Northwest Hillsborough County. In the<br />
<strong>Sweetwater</strong> <strong>Creek</strong> watershed, the water table ranges from 10 – 50 feet NGVD. Groundwater<br />
derived from this aquifer is used most often for lawn irrigation and livestock watering as the aquifer<br />
produces yields that typically range around 20 gallons per minute. While of no significance for<br />
direct use for potable supply, the surficial aquifer is important in the northeastern portion of the<br />
project area as a source of recharge for the Upper Floridan Aquifer via vertical leakage across the<br />
semi-confining unit, a vertical zone composed of clays of a thickness ranging from 1.0 to 85 feet<br />
that is discontinuous across the project area. In the <strong>Sweetwater</strong> <strong>Creek</strong> watershed, recharge to the<br />
Upper Floridan is generally low as most of the watershed is in a discharge area; however, the<br />
northeastern portion of the watershed is located in an area in which recharge to the Upper Floridan<br />
is 1 – 10 inches/year. The Upper Floridan Aquifer, composed of a continuous series of carbonate<br />
units, ranges from 1000 feet to 1100 feet thick in the project area; in the <strong>Sweetwater</strong> <strong>Creek</strong><br />
watershed, the thickness of the Upper Floridan is approximately 1000 feet. The Upper Floridan is<br />
very close to the land surface in some areas, and in the <strong>Sweetwater</strong> <strong>Creek</strong> watershed, the limerock<br />
of the Upper Floridan comes to within 10 feet of the land surface. Because of the Upper Floridan’s<br />
close proximity to land surface in the northeastern portion of the watershed and in view of the<br />
recharge potential in that area, the opportunity for contamination of the Upper Floridan is high<br />
there. In the central and southern regions of the watershed, where recharge to Upper Floridan is<br />
virtually absent, the groundwater contamination potential ranges from low to moderate.<br />
No major public water supply facilities are located within the <strong>Sweetwater</strong> <strong>Creek</strong> watershed, but<br />
there are numerous private, low-production domestic supply wells in the watershed (Figure 9-2).<br />
In the Hillsborough County portion of the NTBWUCA, the estimated withdrawal of groundwater<br />
amounted to 92.6 million gallons per day (mgd) in 2002, while the permitted groundwater quantities<br />
totaled 116.2 mgd. Over the period 1993 – 2002, actual withdrawals from the four public supply<br />
facilities that are located in the Northwest Hillsborough area (Cosme-Odessa, Eldridge-Wilde,<br />
Northwest Hillsborough, and Section 21) have ranged from a low of 51.4 mgd in 1993 to a high of<br />
59.3 mgd in 2000 (Figure 9-3). Groundwater withdrawals over that period have shown a very slight<br />
increasing trend, although the increase is not statistically significant. For comparison, in all of<br />
Hillsborough County, a total of 174.8 mgd was utilized for potable supply (47.5%), agriculture<br />
(38.9%), industrial and commercial uses (6.3%), recreational and aesthetic uses (5.9%), and<br />
mining/dewatering (1.3%).<br />
9-6<br />
<strong>Sweetwater</strong> <strong>Creek</strong> <strong>Watershed</strong> Management <strong>Plan</strong>
Legend<br />
Roads<br />
Hydrography<br />
County Boundary<br />
Subbasins<br />
WATER<br />
Wellfields<br />
Dispersed Wellfields<br />
Water Use Permit Withdrawal Points<br />
Section 21<br />
Wellfield<br />
ESTES, LAKE<br />
Old US Hwy 41<br />
/<br />
ROCKET, LAKE<br />
CHAPMAN LAKE<br />
Lake Magdalene Blvd<br />
PLATT LAKE<br />
LONG LAKE<br />
Ehrlich Rd<br />
MAGDALENE, LAKE<br />
Bearss Ave<br />
I-275<br />
Nebraska Ave<br />
BAY LAKE<br />
Fletcher Ave<br />
GEORGE LAKE<br />
Linebaugh Ave<br />
CITRUS PARK LAKE<br />
CASEY, LAKE<br />
Gunn Hwy<br />
Dale Mabry Hwy<br />
ELLEN, LAKE<br />
Lake Ellen Dr<br />
LIPSEY, LAKE<br />
CARROLL, LAKE<br />
BOAT LAKE<br />
Busch Blvd<br />
Waters Ave<br />
Anderson Rd<br />
0 6,000 12,000 Feet<br />
Wellfield and Well Locations in the <strong>Sweetwater</strong> <strong>Creek</strong> <strong>Watershed</strong><br />
Figure<br />
9-2
WATER SUPPLY<br />
Pumpage from Northwest Hillsborough Wellfields, 1993-2002<br />
62<br />
60<br />
58<br />
56<br />
54<br />
MGD<br />
52<br />
50<br />
48<br />
46<br />
44<br />
1993 1994 1995 1996 1997 1998 1999 2000 2001 2002<br />
Year<br />
Figure 9-3 Groundwater Withdrawals-Northwest Hillsborough Public Supply Facilities<br />
(Source: SWFWMD, Estimated Water Use, 2002)<br />
Currently, the average production limit for the public supply facilities in the Northwest Hillsborough<br />
area totals 57.5 mgd (Table 9-1).<br />
Table 9-1<br />
Average Production Limits (mgd) for the Public Supply Facilities<br />
in the Northwest Hillsborough Area<br />
WATER SUPPLY FACILITY AVERAGE PRODUCTION DESTINATION OF WATER PUMPED<br />
LIMIT (MGD)<br />
Eldridge – Wilde wellfield 26.5 SK Keller pumping station<br />
Northwest Regional wellfield 10 Cosme treatment plant and NW<br />
Hillsborough treatment facility<br />
Cosme-Odessa 11 Cosme treatment plant<br />
Section 21 10 Lake Park treatment plant<br />
TOTAL 57.5<br />
9-8<br />
<strong>Sweetwater</strong> <strong>Creek</strong> <strong>Watershed</strong> Management <strong>Plan</strong>
CHAPTER 9<br />
Total per capita water use for the period, 1993 – 2002, ranged from a low of 105 gallons per capita<br />
per day (gpcd) in 1998 to a high of 154 gpcd in 1995 for both surface and groundwater sources<br />
(Figure 9-4). Per capita water use showed a slight decreasing trend over that period, but it was not<br />
statistically significant. In 2003, Hillsborough County utilized approximately 70% of its reuse<br />
capacity. On a per capita basis, the actual rate of reuse amounted to 30.54 gpcd, while the reuse<br />
capacity equaled 43.4 gpcd.<br />
TBW/ Northwest Hillsborough Per Capita Water Consumption, 1993-2002<br />
180<br />
160<br />
140<br />
120<br />
Gallons Per Day<br />
100<br />
80<br />
60<br />
40<br />
20<br />
0<br />
1993 1994 1995 1996 1997 1998 1999 2000 2001 2002<br />
Year<br />
TBW/ Northwest Hillsborough<br />
Figure 9-4 Per Capita Water Use in the NTBWUCA<br />
(Source: SWFWMD, Estimated Water Use, 2002)<br />
Figure 9-5 shows the cumulative rainfall (inches) and the “variance from normal” (NOAA) for the<br />
period between May 2005 through April 2006 for Tampa International Airport (TIA), while Table 9-2<br />
lists other rainfall stations that are located within the NTBWUCA and operated by SWFWMD. The<br />
TIA station reports an above-normal rainfall condition equaling 2.7 inches at that location.<br />
However, due to the nature of rainfall over a large geographic area, the rainfall surplus for the area<br />
as a whole as represented by the nine rainfall stations listed in Table 9-2, the rainfall amounts to<br />
0.7 inches over the April 2005 – March 2006 time period. In addition, the average rainfall amount<br />
for March 2006 in the Northwest Hillsborough area was 0.13 inches, which represents a departure<br />
from the normal March rainfall amount totaling -3.24 inches. Since January, 2006, the departure<br />
from normal for the time period January – March was 1.49 inches.<br />
9-9<br />
<strong>Sweetwater</strong> <strong>Creek</strong> <strong>Watershed</strong> Management <strong>Plan</strong>
WATER SUPPLY<br />
Figure 9-5 Rainfall and Departure from Normal for the Tampa International Airport<br />
(Source: SWFWMD, Estimated Water Use, 2002)<br />
Table 9-2 Rainfall Stations in the Northwest Hillsborough Area<br />
(Source: SWFWMD)<br />
TYPE SITE SITE NAME LATITUDE LONGITUDE<br />
RNF 313 E-101 (ROMP TR 13-3) 280355.05 823818.34<br />
RNF 390 CRESCENT LAKE 280918.04 823552.34<br />
RNF 394 ISLAND FORD 280909.04 823614.34<br />
RNF 395 BAY LAKE 280410.05 822958.33<br />
RNF 440 LAKE COMO ET 281056.03 822811.33<br />
RNF 503 LAKE HANNA 280830.02 822648.92<br />
RNF 538 ELDRIDGE-WILDE 2N 281011.04 823905.34<br />
RNF 561 ST PETE 42 281036.03 823056.33<br />
RNF 582 ST PETE JACKSON 26 A RAIN 280733.04 823057.33<br />
9-10<br />
<strong>Sweetwater</strong> <strong>Creek</strong> <strong>Watershed</strong> Management <strong>Plan</strong>
CHAPTER 9<br />
Groundwater levels in the Northwest Hillsborough area as represented by three monitoring wells,<br />
(EWWF 11 FLDN, EWWF 2S DEEP, AND COSME 3-FLDN) indicate that groundwater elevations<br />
for March 2006 are declining from those observed in April 2006, but they have not reached the<br />
historical low for March (Table 9-3).<br />
Table 9-3<br />
Comparison of Groundwater Elevations (NGVD)<br />
in the Northwest Hillsborough Area<br />
(Source: SWFWMD. Hydrologic Conditions Report – March 2006)<br />
WELL<br />
WATER LEVEL<br />
MARCH 2006<br />
CHANGE FROM<br />
PRIOR MONTH<br />
MARCH<br />
HISTORICAL<br />
LOW LEVEL<br />
LOW LEVEL<br />
FOR PERIOD<br />
OF RECORD<br />
COSME 3 FLDN 21.47 -5.45 20.77 10.94<br />
EWWF 11 FLDN 14.32 -2.57 7.33 0.31<br />
EWWF 2S DEEP 16.45 -2.29 6.62 -1.16<br />
The Northern Tampa Bay Phase II (NTB II) project was initiated by SWFWMD as an outgrowth of<br />
the 1989 declaration of the NTBWUCA and the Northern Tampa Bay Water Resource Assessment<br />
Project (WRAP) which was completed in 1996. This study will continue through 2010 and will<br />
include assessments of the biological and hydrological conditions in Northern Tampa Bay to<br />
support the development of minimum flows and levels, water resource recovery, water use<br />
permitting, and environmental resource permitting. NTB II consists of a series of technical projects<br />
in Northern Tampa Bay to support the ongoing development of minimum flows and levels, water<br />
resources recovery, water use permitting, and environmental resource permitting.<br />
The goal of the NTB II project is to enhance the data collection effort, implement projects for the<br />
assessment of water supply needs, and to develop a water resources recovery strategy. As of<br />
2005, 30 nested groundwater monitoring sites have been installed and 50 new wetland monitoring<br />
sites have been established, many of them in the Northwest Hillsborough area. These projects<br />
include detailed assessments of water resources and involve intensive data collection and<br />
monitoring to characterize hydrologic conditions and determine the effects of water withdrawals<br />
(SWFWMD, 2000).<br />
9-11<br />
<strong>Sweetwater</strong> <strong>Creek</strong> <strong>Watershed</strong> Management <strong>Plan</strong>
WATER SUPPLY<br />
9.3 Surface Water Use<br />
The majority of the Northwest Hillsborough area relies on groundwater for its water supply, but the<br />
<strong>Sweetwater</strong> <strong>Creek</strong> and Lower <strong>Sweetwater</strong> <strong>Creek</strong> watersheds together with a portion of the<br />
Rocky/Brushy <strong>Creek</strong> watershed are within the service area of the City of Tampa for which the<br />
primary water source is Hillsborough River Reservoir. In 2002, the Northwest Hillsborough area<br />
was supplied with 54.998 mg for public supply from wellfields in the area; in that same year, a total<br />
of 85.477 mg was provided from surface water sources.<br />
Lakes and Streams - In the <strong>Sweetwater</strong> <strong>Creek</strong> watershed, there are 37 names lakes of which 16<br />
have surface areas > 10 acres (Table 9-4). The larger lakes in the watershed are: Carroll, Ellen,<br />
Magdalene, and White Trout. Lakes in the <strong>Sweetwater</strong> <strong>Creek</strong> watershed are not utilized for<br />
potable supply, but they are used for irrigation of lawns and some citrus groves in the area.<br />
Table 9-4<br />
Lakes in the <strong>Sweetwater</strong> <strong>Creek</strong> <strong>Watershed</strong> having Surface Areas >10 acres<br />
LAKE ACRES LAKE ACRES<br />
Bay 36 George 21<br />
Bird 23 Lipsey 35<br />
Boat 34 Little Bay 12<br />
Carroll 191 Lord 12<br />
Chapman 17 Magdalene 238<br />
Ellen 53 Platt 63<br />
Estes 13 West 17<br />
Gass 19 White Trout 77<br />
In the <strong>Sweetwater</strong> <strong>Creek</strong> watershed, there are two named streams: <strong>Sweetwater</strong> <strong>Creek</strong>, which is<br />
also referred to as Channel G along its lower reach; and Channel H, most of which is an artificial<br />
canal built in the 1960s. The channel of <strong>Sweetwater</strong> <strong>Creek</strong> has been greatly modified by diversion,<br />
straightening, and deepening, a process that began after 1916 and was well along by 1938.<br />
9-12<br />
<strong>Sweetwater</strong> <strong>Creek</strong> <strong>Watershed</strong> Management <strong>Plan</strong>
CHAPTER 9<br />
Major alterations were done in the 1960’s, as part of a Soil Conservation Service (now NRCS)<br />
Upper Tampa Bay Project. The <strong>Creek</strong> now serves as an urban drainage facility. <strong>Sweetwater</strong> <strong>Creek</strong><br />
is not used for potable supply, and its use for landscape irrigation is extremely limited due to its<br />
intermittent flow characteristics along most of its length.<br />
The <strong>Sweetwater</strong> <strong>Creek</strong> watershed as a whole contributes flow to Rocky <strong>Creek</strong> via Channel G.<br />
Rocky <strong>Creek</strong> contributes flow to Old Tampa Bay north of the Courtney Campbell Causeway by<br />
means of the original Rocky <strong>Creek</strong> channel and the man-made Channel A. Therefore, <strong>Sweetwater</strong><br />
<strong>Creek</strong> watershed no longer has a direct estuarine component of its own.<br />
Reservoirs - Reservoirs are artificial impoundments of water constructed in association with<br />
agricultural and residential development in the watershed; residential reservoirs are managed to<br />
provide aesthetic or stormwater management functions. In the <strong>Sweetwater</strong> <strong>Creek</strong> watershed, there<br />
are over 24 named surface water management facilities that participate in the County’s Adopt-A-<br />
Pond program (Table 9-5) and numerous, unnamed such ponds; all are associated with residential<br />
properties. While not natural lakes, these surface water bodies are numerous enough to contribute<br />
to the watershed’s water resources in recharge, water quality, and flood abatement.<br />
Table 9-5<br />
Stormwater Ponds in the Adopt-A-Pond Program<br />
POND<br />
POND<br />
Adair Family<br />
Deer <strong>Creek</strong><br />
Dorothy Thomas School<br />
East Village<br />
Greco-Sherman Group<br />
Hunters lake<br />
Lake Chapman Subdivision<br />
Lake Ellen Circle<br />
Lake Ellen Woods<br />
Lake Magdalene Woods<br />
Lake Morley Improvements<br />
Lakeville<br />
Magdalene Reserve<br />
Manor Oaks<br />
Mossvale Lane<br />
Oakview Terrace<br />
Pico Pond<br />
Reynoldswood Pond<br />
Tarawood<br />
The Manors at White Trout<br />
Thompson East<br />
Twelve Oaks Lake<br />
Twelve Oaks - smaller<br />
Windsor Park<br />
9-13<br />
<strong>Sweetwater</strong> <strong>Creek</strong> <strong>Watershed</strong> Management <strong>Plan</strong>
WATER SUPPLY<br />
9.4 Water Supply Issues / Areas of Concern<br />
With the recent occurrence of widespread drought within the region, many concerns have been<br />
raised as to how the future water supply needs will be met. In recent years, several projects have<br />
been proposed and initiated to meet the future water needs of the region. However, it remains to<br />
be seen whether these new projects will provide sufficient water without causing significant<br />
adverse impacts on the environment. Several studies have documented the decline in water levels<br />
of wetlands, lakes as well as groundwater (SWFWMD, 1996). The demand for water will continue<br />
to increase as population grows and both groundwater and surface water supply needs increase.<br />
Furthermore, with increasing development in the region, there will be less permeable land available<br />
for the rainfall to replenish the groundwater.<br />
9.4.1 Aquifer Recharge<br />
Approximately half of the Northwest Hillsborough area occupies lands where recharge to the<br />
Floridan Aquifer occurs at a rate varying from 1.0 inch to 10 inches per year. This area includes the<br />
northeastern region of the <strong>Sweetwater</strong> <strong>Creek</strong> watershed. The remainder of the Northwest<br />
Hillsborough area is a discharge area that discharges from the Floridan aquifer at an estimated<br />
rate of 1 to 5 inches per year (SWFWMD, 1996). Figure 9-6 presents the recharge and discharge<br />
rates within the Northwest Hillsborough area. Protection of recharge areas in the watershed is<br />
critical to the preservation of the regional groundwater sources and meeting regional water supply<br />
demands.<br />
Several management and regulatory strategies have been undertaken in recent years to enhance<br />
aquifer recharge in the Northwest Hillsborough area, which include the following:<br />
• Optimization and expansion of existing aquifer storage and recovery systems<br />
• Delineation of recharge/discharge relationship<br />
• Identification of sites for wetlands, lake, and aquifer rehydration<br />
• Identification of opportunities to re-engineer stormwater management systems to enhance<br />
groundwater recharge and improve water quality in waterbodies used for drinking water<br />
• Identification of opportunities to use reclaimed water for rehydration<br />
• Improvement of wellhead protection ordinances to include recharge areas and land use<br />
ordinances<br />
• Modification of Environmental Resource Permit (ERP) regulations to enhance aquifer<br />
recharge<br />
• Modification of local, state, and District regulations to maintain and enhance groundwater<br />
recharge<br />
9-14<br />
<strong>Sweetwater</strong> <strong>Creek</strong> <strong>Watershed</strong> Management <strong>Plan</strong>
Legend<br />
Roads<br />
Hydrography<br />
County Boundary<br />
WATER<br />
Recharge / Discharge<br />
DISCHARGE/1 TO 5<br />
DISCHARGE/GREATER THAN 5<br />
DISCHARGE/LESS THAN 1<br />
RECHARGE/1 TO 10<br />
RECHARGE/GREATER THAN 10<br />
RECHARGE/LESS THAN 1<br />
ESTES, LAKE<br />
Old US Hwy 41<br />
{<br />
ROCKET, LAKE<br />
CHAPMAN LAKE<br />
Lake Magdalene Blvd<br />
PLATT LAKE<br />
LONG LAKE<br />
Ehrlich Rd<br />
MAGDALENE, LAKE<br />
Bearss Ave<br />
I-275<br />
Nebraska Ave<br />
BAY LAKE<br />
Fletcher Ave<br />
GEORGE LAKE<br />
Linebaugh Ave<br />
CITRUS PARK LAKE<br />
CASEY, LAKE<br />
Gunn Hwy<br />
Dale Mabry Hwy<br />
ELLEN, LAKE<br />
Lake Ellen Dr<br />
LIPSEY, LAKE<br />
CARROLL, LAKE<br />
BOAT LAKE<br />
Busch Blvd<br />
Waters Ave<br />
Anderson Rd<br />
0 6,000 12,000 Feet<br />
Generalized recharge or discharge rate of the Floridian Aquifer System (in/yr)<br />
Figure<br />
9-6
WATER SUPPLY<br />
9.4.2 Impacts Due to Water Withdrawals<br />
The literature describing the effects of groundwater withdrawal on wetland hydroperiods and lake<br />
stages dates to 1971. Since that time, the nature of the impacts to wetlands has been documented<br />
in wetlands both in and around major wellfields (Rochow, 1998). Generally, symptoms of wetland<br />
health decline (e.g., replacement of aquatic plant species by upland species, tree-fall, soil<br />
subsidence, loss of wetland-dependent wildlife) have occurred in the vicinity of large-scale<br />
groundwater withdrawals (e.g., Section 21, Cosme, Northwest Regional, and Eldridge – Wilde<br />
Wellfields). As a Water Use Permit (WUP) condition, permit holders have been required to monitor<br />
water levels and ecological indicators of wetland viability, and annual reports have been prepared<br />
describing wetland hydrobiological conditions since the mid-1970s. The link has been made<br />
between groundwater withdrawals and reduced hydroperiod in area wetlands. Under the NTB II<br />
project, the SWFWMD has established many more wetland monitoring sites, and recovery strategy<br />
has been developed.<br />
The recovery strategy involves:<br />
• District and Tampa Bay Water (TBW) water level monitoring<br />
• District and TBW biologic monitoring (WAPs)<br />
• TBW annual assessment of wellfields (annual reports)<br />
• District Minimum Flows and Levels (MFL) monitoring<br />
• Environmental Monitoring <strong>Plan</strong> (EMP) referrals to the Operations <strong>Plan</strong><br />
During the first several years of pumpage from the three wellfields in the project area, wetlands<br />
within the wellfield’s zone of influence exhibited signs of wetland health decline including the<br />
replacement of wetland vegetation with upland species. These ecological changes were attributed<br />
to sustained groundwater production as well as below normal rainfall conditions. From about 1986<br />
to 1993, overall annual pumpage rates for the wellfields were reduced by nearly 40% compared to<br />
the original production period. Recent pumpage data from the area’s three wellfields, however,<br />
indicates that the production in the wellfields has increased but not significantly.<br />
Several management strategies have been proposed/undertaken to minimize the impacts due to<br />
water withdrawals, which include the following:<br />
• Development of operation and management plans to minimize environmental impacts for all<br />
permitted water users<br />
• Implementation of projects associated with the NTBWUCA<br />
• Investigation for alternative sources of water<br />
• Development and implementation of aggressive water conservation and water reuse<br />
programs<br />
• Continuation of cooperative funding to encourage development of alternative water sources<br />
• Continuation of regulatory requirements/incentives for alternative water sources<br />
9-16<br />
<strong>Sweetwater</strong> <strong>Creek</strong> <strong>Watershed</strong> Management <strong>Plan</strong>
CHAPTER 9<br />
9.4.3 Minimum Flows and Levels<br />
Chapter 373.042 (2) F.S., requires the SWFWMD to adopt minimum flows and levels on streams,<br />
lakes and aquifer water levels throughout the District. By statute the District must prioritize the<br />
adoption of minimum levels in areas of Hillsborough, Pinellas, and Pasco counties which are<br />
experiencing or are expected to experience adverse impacts because of groundwater withdrawals.<br />
In response to this charge, the District has proposed minimum levels in lakes, wetlands, and<br />
aquifers in priority areas including the Northwest Hillsborough area.<br />
Establishment of minimum flows and levels (MFLs) constitutes defining the minimum flow regime<br />
and water levels necessary to prevent significant environmental impacts to lakes, wetlands,<br />
streams, and aquifers. The Hillsborough County Comprehensive <strong>Plan</strong> (Coastal Management<br />
Element) requires cooperation between the County and the SWFWMD to ensure that the minimum<br />
freshwater flows needed to support natural, optimal diversity and productivity in estuarine areas<br />
are scientifically determined and maintained. To date in the Northwest Hillsborough area, levels<br />
have been set by the District on 15 wetlands, seven wells, and 15 lakes. Lakes having Minimum<br />
Levels adopted by SWFWMD’s Governing Board include: Alice, Calm, Church, Crescent, Echo,<br />
Garden, Horse, Jackson, Juanita, Little Moon, Mound, Rainbow, Sunset, and Taylor.<br />
In addition, Lakes Raleigh and Rogers are scheduled for MFL development in 2006, and Brooker<br />
<strong>Creek</strong> is scheduled in the 2011 – 2018 timeframe.<br />
The key management strategies of the MFL program include:<br />
• Prioritization of areas where determination of minimum flows and levels are needed<br />
• Development of scientific justification for establishing minimum flows and levels<br />
• Development of action plan and permitting strategies to work toward achieving the<br />
minimum flows and levels where existing levels are below the minimum levels<br />
Water supply issues are being addressed by SWFWMD, TBW, the City of Tampa, and<br />
Hillsborough County in order to balance the protection of water resources with sustainable<br />
development. New sources of potable water are being developed by Tampa Bay Water member<br />
governments, and projects implemented through these efforts will address improvements to water<br />
supplies in concert with water quality, flooding, and natural systems restoration.<br />
9-17<br />
<strong>Sweetwater</strong> <strong>Creek</strong> <strong>Watershed</strong> Management <strong>Plan</strong>
WATER SUPPLY<br />
9.5 BIBLIOGRAPHY<br />
The attached bibliography includes a list of references used for this study and additional references<br />
that could be cited by readers.<br />
Florida Department of Environmental Protection. 2006. Sinkhole Database. Florida Bureau of<br />
Geology. Tallahassee, FL.<br />
Northwest Hillsborough Basin Board. October 7, 2006. <strong>Plan</strong>ning Workshop. SWFWMD.<br />
Brooksville, FL.<br />
Rochow, T. F. 1998. The effects of water table level changes on freshwater marsh and cypress<br />
wetlands in the northern Tampa Bay region. Environmental Section Technical Report 1998-1.<br />
Southwest Florida Water Management District. Brooksville, Florida.<br />
Southwest Florida Water Management District. September 7, 2005. Recovery Analysis for Northern<br />
Tampa Bay. SWFWMD. Brooksville, FL.<br />
Southwest Florida Water Management District. 2002. Estimated Water Use in the Southwest<br />
Florida Water Management District. SWFWMD. Brooksville, FL.<br />
Southwest Florida Water Management District. 2000. Preliminary <strong>Plan</strong> for Expansion of the<br />
Regional Network of Floridan and Surficial Aquifer Monitor Wells for Northern Tampa Bay.<br />
Southwest Florida Water Management District. 1999. Hillsborough River Comprehensive<br />
<strong>Watershed</strong> Management <strong>Plan</strong>. Final Draft. Brooksville, Florida.<br />
Southwest Florida Water Management District. 1996. Northern Tampa Bay Water Resource<br />
Assessment Project, Volume 1, Surface Water/Groundwater Interrelationships. SWFWMD.<br />
Brooksville, FL.<br />
Southwest Florida Water Management District. 1996. Northern Tampa Bay Water Resource<br />
Assessment Project, Volume 2, Saline Water Intrusion and Water Quality. SWFWMD. Brooksville,<br />
FL.<br />
Southwest Florida Water Management District. 1996. Northern Tampa Bay Water Resource<br />
Assessment Project, Appendices A – F. SWFWMD. Brooksville, FL.<br />
Southwest Florida Water Management District, 1988. Groundwater Resource Availability<br />
Inventory: Hillsborough County, Florida. Brooksville, FL.<br />
9-18<br />
<strong>Sweetwater</strong> <strong>Creek</strong> <strong>Watershed</strong> Management <strong>Plan</strong>
CHAPTER 9<br />
Tampa Bay Water. 2006. New Water <strong>Plan</strong>: Prepared for the Southwest Florida Water<br />
Management District. Quarterly Report.<br />
Tihansky, A.B., 1999, Sinkholes, West-Central Florida, in Galloway, D., Jones, D.R., and<br />
Ingebritsen, S.E., eds., Land Subsidence in the United States: USGS Circular 1182, p. 121-140.<br />
Univ. of South Florida. 2006. Hillsborough Water Atlas. http://www.hillsboroughwateratlas.usf.edu.<br />
USF. Tampa, FL.<br />
Water Reuse Work Group. June, 2003 rev. 05MAY2006. Water Reuse for Florida. FDEP.<br />
Tallahassee, FL.<br />
9-19<br />
<strong>Sweetwater</strong> <strong>Creek</strong> <strong>Watershed</strong> Management <strong>Plan</strong>
CHAPTER 10: POLLUTANT LOADING AND<br />
REMOVAL MODEL<br />
10.1 Overview<br />
Potential water quality impacts resulting from stormwater runoff in the <strong>Sweetwater</strong> <strong>Creek</strong><br />
watershed were evaluated using the Pollutant Loading and Removal Model previously<br />
developed by Parsons Engineering Science, Inc. in conjunction with the Hillsborough County<br />
Public Works/Stormwater Management Section. The model was developed to:<br />
• Estimate the potential water quality impacts resulting from the most current (2004) land<br />
use mapping and soils conditions<br />
• Evaluate the reduction in potential loading due to the existing best management<br />
practices (BMP) within the watershed<br />
• Evaluate future water quality conditions based on potential improvements or alternatives<br />
within a given watershed<br />
This chapter discusses the process used to delineate the areas treated by existing Best<br />
Management Practices (BMPs) and an estimate of their overall effectiveness in reducing<br />
pollutant loading within the watershed using the above-mentioned model. The gross pollutant<br />
loading within the watershed was estimated based on the 2004 land use and soils<br />
characteristics. Gross pollutant loading was estimated by assuming no treatment of stormwater<br />
runoff, and is indicative of the potential of various land uses to yield contaminants into the<br />
environment. From this gross loading, the reduction in loading due to the existing BMPs was<br />
subtracted to approximate the net pollutant loading within the watershed. Analyses were<br />
conducted at both watershed and subbasin levels.<br />
10.2 Pollutant Loading and Removal Model<br />
The Pollutant Loading and Removal Model has three main components: calculation of gross<br />
pollutant loads, estimation of net loads based on existing treatment, and evaluation of the<br />
treatment level-of-service based on individual hydrologic units (Figure 10-1). For the purposes<br />
of these analyses, the hydrologic units of interest are the subwatershed and subbasin. In the<br />
model, land use and hydrologic soil characteristics were used to determine runoff<br />
characteristics. A gross pollutant load for each subbasin was calculated as the product of the<br />
runoff volume and the stormwater event mean concentrations (EMC) for each pollutant and land<br />
use of interest. Six EMC values were measured during previous stormwater characterization<br />
studies performed by Hillsborough County, and later submitted as part of the County's National<br />
Pollutant Discharge Elimination System (NPDES) permit.<br />
10-1<br />
<strong>Sweetwater</strong> <strong>Creek</strong> <strong>Watershed</strong> Management <strong>Plan</strong>
POLLUTANT LOADING AND REMOVAL MODEL<br />
Note:<br />
1. Ratio of net load (treated) to untreated<br />
single family residential (SFR)<br />
2. Level of Service Criteria:<br />
A) Net Load 20% or less of SFR<br />
B) Net Load 20-40% of SFR<br />
C) Net Load 40-70% of SFR<br />
D) Net Load 70-100% of SFR<br />
E) Net Load > 100% of SFR<br />
Figure 10-1 Hillsborough County Pollutant Loading and Removal Model<br />
(Source: Parsons Engineering Science, Inc.)<br />
Net pollutant loads were estimated at the subbasin level based on the treatment provided by<br />
existing BMPs and the land use for which the BMP was implemented. The treatment level-ofservice<br />
for each subbasin, described in greater detail in the following chapter, is based on<br />
comparing the net pollutant loads to a benchmark condition. This benchmark is represented by<br />
the extent of loading that would occur if the subbasins were designated as low/medium density<br />
residential land use with no stormwater treatment.<br />
10-2 <strong>Sweetwater</strong> <strong>Creek</strong> <strong>Watershed</strong> Management <strong>Plan</strong>
CHAPTER 10<br />
The 12 different parameters (pollutants) that are evaluated in the model are listed in Figure 10-<br />
2.<br />
Figure 10-2<br />
Pollutants Evaluated in the Pollutant Loading and Removal Model<br />
10.2.1 Land Use<br />
The percentage of impervious land surface area is typically determined by land use composition<br />
(e.g., transportation = roads = high proportion of impervious area). The degree of<br />
imperviousness can then be used to estimate the volume of runoff expected from various<br />
subbasins within a watershed. The 2004 land use coverage provided by the Southwest Florida<br />
Water Management District (SWFWMD) was used in this modeling effort to determine land use<br />
types in each subbasin.<br />
10-3 <strong>Sweetwater</strong> <strong>Creek</strong> <strong>Watershed</strong> Management <strong>Plan</strong>
POLLUTANT LOADING AND REMOVAL MODEL<br />
The land use categories evaluated for the pollutant loading model include:<br />
• Low/medium density residential<br />
• High density residential<br />
• Light industrial<br />
• Agricultural<br />
• Commercial<br />
• Institutional<br />
• Highway/Utility<br />
• Recreational<br />
• Open land, and<br />
• Extractive (mining)/disturbed<br />
Figure 10-3 illustrates the distribution of the land use categories within the <strong>Sweetwater</strong> <strong>Creek</strong><br />
watershed. Acreages and percentages of land uses based on these general categories for the<br />
watershed are summarized in Table 10-1.<br />
Table 10-1<br />
<strong>Sweetwater</strong> <strong>Creek</strong> <strong>Watershed</strong> 2004 Land Use Distribution<br />
Land Use<br />
Total Square<br />
Miles Acreage Percentage<br />
Agricultural 602,793 149 1.1%<br />
Barren Land 40,937 10 0.1%<br />
Commercial, Industrial, or Institutional 8,886,165 2,196 16.2%<br />
High Density Residential 15,584,044 3,851 28.4%<br />
Low/Medium Density Residential 12,359,608 3,054 22.5%<br />
Open Land 1,501,402 371 2.7%<br />
Recreational 1,082,590 268 2.0%<br />
Transportation, Communication, and Utilities 1,854,216 458 3.4%<br />
Upland Forested 1,026,295 254 1.9%<br />
Upland Non-Forested 577,023 143 1.1%<br />
Water 6,488,579 1,603 11.8%<br />
Wetlands 4,904,311 1,2122 8.9%<br />
TOTAL 54,907,963 13,568 100.0%<br />
10-4 <strong>Sweetwater</strong> <strong>Creek</strong> <strong>Watershed</strong> Management <strong>Plan</strong>
Legend<br />
Roads<br />
Hydrography<br />
Agricultural<br />
Barren Land<br />
Commercial, Industrial, or Institutional<br />
High Density Residential<br />
Low/Medium Density Residential<br />
Open Land<br />
Recreational<br />
Transportation, Communication, and Utilities<br />
Upland Forested<br />
Upland Non-Forested<br />
0 4,500 9,000 Feet<br />
Water<br />
Wetlands<br />
Land Use in the <strong>Sweetwater</strong> <strong>Creek</strong> <strong>Watershed</strong> (2004)<br />
Figure<br />
10-3
POLLUTANT LOADING AND REMOVAL MODEL<br />
10.2.2 Soil Characteristics<br />
Soil type is another important component of runoff calculations since different soils have varying<br />
capacities for infiltration. In addition, the distribution of soils can vary significantly throughout a<br />
watershed. Hydrologic soil groups are typically used to classify soils based on runoff potential.<br />
Soils are grouped into four hydrologic soil groups (A through D), which reflect varying levels of<br />
infiltration rates and soil moisture capacities. Descriptions of these soil groups are as follows:<br />
• Group A (low runoff potential): Soils with high infiltration rates even when thoroughly<br />
wetted and which have a high rate of water transmission. The soils under this group<br />
have a typical maximum infiltration rate of 10 in/hr when dry and 0.5 in/hr when<br />
saturated.<br />
• Group B (moderately low runoff potential): Soils that have moderate infiltration rates<br />
when thoroughly wetted and a moderate rate of water transmission. The soils under this<br />
group have a typical maximum infiltration rate of 8 in/hr when dry and 0.4 in/hr when<br />
saturated.<br />
• Group C (moderately high runoff potential): Soils that have a slow infiltration rate when<br />
thoroughly wetted and a slow rate of water transmission. The soils under this group have<br />
a typical maximum infiltration rate of 5 in/hr when dry and 0.25 in/hr when saturated.<br />
• Group D (high runoff potential): Soils having very slow infiltration rates when thoroughly<br />
wetted and a very slow rate of water transmission. The soils under this group have a<br />
typical infiltration rate of 3 in/hr when dry and 0.10 in/hr when saturated.<br />
Some wet soils that can be adequately drained may have dual hydrologic soil group<br />
classifications (e.g., B/D). The first designation is based on the drained condition, and the<br />
second letter designation is based on the undrained or natural condition. Figure 10-4 illustrates<br />
the distribution of the soil hydrologic groups within the <strong>Sweetwater</strong> <strong>Creek</strong> watershed. Table 10-2<br />
presents a summary of the percent coverages of each of the hydrologic groups in the<br />
watershed.<br />
Table 10-2<br />
<strong>Sweetwater</strong> <strong>Creek</strong> <strong>Watershed</strong> Soil Hydrologic Group Distribution<br />
Soil Hydrologic Group Acreage Percentage<br />
A 165 1.22%<br />
B/D 7,196 53.03%<br />
C 2,901 21.38%<br />
D 1,997 14.72%<br />
Water 1,310 9.65%<br />
Total 13,570 100.00%<br />
10-6 <strong>Sweetwater</strong> <strong>Creek</strong> <strong>Watershed</strong> Management <strong>Plan</strong>
Legend<br />
Roads<br />
Hydrography<br />
County Boundary<br />
Subbasins<br />
Hydrologic Soil Group<br />
A<br />
B/D<br />
C<br />
D<br />
Water<br />
Old US Hwy 41<br />
Lake Magdalene Blvd<br />
Ehrlich Rd<br />
Bearss Ave<br />
I-275<br />
Nebraska Ave<br />
Fletcher Ave<br />
Lake Ellen Dr<br />
Linebaugh Ave<br />
Gunn Hwy<br />
Dale Mabry Hwy<br />
Busch Blvd<br />
Waters Ave<br />
Anderson Rd<br />
0 6,000 12,000 Feet<br />
Hydrologic Soil Group Distribution in the <strong>Sweetwater</strong> <strong>Creek</strong> <strong>Watershed</strong><br />
Figure<br />
10-4
POLLUTANT LOADING AND REMOVAL MODEL<br />
Runoff volume calculations were based on the application of runoff coefficients by soil and land<br />
use type. Most of the coefficients, listed by land use, can be found in the Florida Department of<br />
Transportation (FDOT) Drainage Manual. Runoff coefficients used in this analysis are<br />
summarized in Table 10-3.<br />
10.2.3 Basin Delineation<br />
During the hydraulic analyses described earlier, the <strong>Sweetwater</strong> <strong>Creek</strong> watershed was divided<br />
into 308 subbasins representing approximately 13,570 acres (Figure 10-5). The model<br />
described was run at the subbasin level (to provide a fine level of detail) by comparing<br />
hydrologic, hydraulic, and runoff water quality characteristics of the watershed. The subbasins<br />
range in size from approximately 0.2 acres to more than 695 acres with an average size of<br />
about 44 acres.<br />
10.2.4 Event Mean Concentrations (EMC)<br />
Pollutant loading analyses were based on the same group of parameters required for NPDES<br />
permitting of stormwater discharges for Hillsborough County, as listed in Table 10-4. The annual<br />
load of a specific constituent generated from each subbasin during cumulative annual rainfall<br />
events were calculated as the product of the annual runoff volume times the corresponding<br />
event mean concentration (EMC). The EMC is the mean concentration of a chemical parameter<br />
expected in the stormwater runoff discharged from a particular land use category during a<br />
typical (average) storm event. The calculated constituent mass represents the pollutant load.<br />
For watershed analyses in Hillsborough County, the EMC values reported in the County’s<br />
NPDES permit applications for stormwater discharges and supporting documents were used<br />
where available. For land use categories or parameters not reported by Hillsborough County,<br />
EMC data from other studies in Florida were used.<br />
EMC values were available for many land uses for numerous pollutants including five-day<br />
biological oxygen demand (BOD5), total suspended solids (TSS), total kjeldahl nitrogen (TKN),<br />
nitrite plus nitrate (NO2+NO3), total nitrogen (TN), total and dissolved phosphorous (TP and<br />
TDP), oil and grease, cadmium (Cd), copper (Cu), lead (Pb), and zinc (Zn). Normalized EMC<br />
data (EMC values multiplied by runoff coefficients) for total nitrogen, total phosphorus, and total<br />
suspended solids are also shown graphically in Figures 10-6 through 10-8. Given land<br />
segments of equal area, the charts can be used to identify those land uses and associated soil<br />
types which contribute significant loads for these parameters. For example, highway/utility are<br />
clearly shown to have the greatest impact on TSS loading. Likewise, agriculture and high<br />
density residential will be expected to contribute the majority of the TP loading when compared<br />
with the other land use categories with similar area and soil characteristics.<br />
10-8 <strong>Sweetwater</strong> <strong>Creek</strong> <strong>Watershed</strong> Management <strong>Plan</strong>
CHAPTER 10<br />
Table 10-3<br />
Runoff Coefficients by Land Use Category and Soil Type<br />
Hydrologic Group<br />
FLUCCS Code Land Use A B/D C D<br />
1100 Low/Medium Density Residential 0.267 0.322 0.379 0.43<br />
1200 Low/Medium Density Residential 0.267 0.322 0.379 0.43<br />
1300 High Density Residential 0.5 0.566 0.634 0.7<br />
1400 Commercial 0.45 0.549 0.651 0.75<br />
1410 Commercial 0.45 0.549 0.651 0.75<br />
1420 Commercial 0.45 0.549 0.651 0.75<br />
1430 Commercial 0.45 0.549 0.651 0.75<br />
1440 Commercial 0.45 0.549 0.651 0.75<br />
1450 Commercial 0.45 0.549 0.651 0.75<br />
1460 Light Industrial 0.5 0.599 0.701 0.8<br />
1500 Light Industrial 0.5 0.599 0.701 0.8<br />
1600 Extractive (Mining)/Disturbed 0.05 0.05 0.05 0.05<br />
1700 Institutional 0.45 0.549 0.651 0.75<br />
1800 Recreational 0.1 0.166 0.234 0.3<br />
1900 Open Land 0.1 0.166 0.234 0.3<br />
2000 Agricultural 0.15 0.233 0.318 0.4<br />
2100 Agricultural 0.15 0.233 0.318 0.4<br />
2140 Agricultural 0.15 0.233 0.318 0.4<br />
2200 Agricultural 0.15 0.233 0.318 0.4<br />
2300 Agricultural 0.15 0.233 0.318 0.4<br />
2400 Agricultural 0.15 0.233 0.318 0.4<br />
2500 Agricultural 0.15 0.233 0.318 0.4<br />
2550 Agricultural 0.15 0.233 0.318 0.4<br />
2600 Agricultural 0.15 0.233 0.318 0.4<br />
3100 Open Land 0.1 0.166 0.234 0.3<br />
3200 Open Land 0.1 0.166 0.234 0.3<br />
3300 Open Land 0.1 0.166 0.234 0.3<br />
4000 Upland Forest 0.05 0.05 0.05 0.05<br />
4100 Upland Forest 0.05 0.05 0.05 0.05<br />
4110 Upland Forest 0.05 0.05 0.05 0.05<br />
4120 Upland Forest 0.05 0.05 0.05 0.05<br />
4200 Upland Forest 0.05 0.05 0.05 0.05<br />
4340 Upland Forest 0.05 0.05 0.05 0.05<br />
4400 Upland Forest 0.05 0.05 0.05 0.05<br />
5000 Water 1 1 1 1<br />
5100 Water 1 1 1 1<br />
5200 Water 1 1 1 1<br />
5300 Water 1 1 1 1<br />
5400 Water 1 1 1 1<br />
6000 Wetland Non-Forested 0.2 0.2 0.2 0.2<br />
6100 Wetland Forest 0.1 0.1 0.1 0.1<br />
6110 Wetland Forest 0.1 0.1 0.1 0.1<br />
6120 Wetland Forest 0.1 0.1 0.1 0.1<br />
6150 Wetland Forest 0.1 0.1 0.1 0.1<br />
6200 Wetland Forest 0.1 0.1 0.1 0.1<br />
6210 Wetland Forest 0.1 0.1 0.1 0.1<br />
6300 Wetland Forest 0.1 0.1 0.1 0.1<br />
6400 Wetland Non-Forested 0.1 0.1 0.1 0.1<br />
6410 Wetland Non-Forested 0.1 0.1 0.1 0.1<br />
6420 Wetland Non-Forested 0.1 0.1 0.1 0.1<br />
6430 Wetland Non-Forested 0.1 0.1 0.1 0.1<br />
6440 Wetland Non-Forested 0.1 0.1 0.1 0.1<br />
6500 Wetland Non-Forested 0.1 0.1 0.1 0.1<br />
6510 Wetland Non-Forested 0.1 0.1 0.1 0.1<br />
6520 Wetland Non-Forested 0.1 0.1 0.1 0.1<br />
6530 Wetland Non-Forested 0.1 0.1 0.1 0.1<br />
7100 Wetland Non-Forested 0.1 0.1 0.1 0.1<br />
7400 Extractive (Mining)/Disturbed 0.05 0.05 0.05 0.05<br />
8000 Highway/Utility 0.5 0.599 0.701 0.8<br />
8100 Highway/Utility 0.5 0.599 0.701 0.8<br />
8200 Highway/Utility 0.5 0.599 0.701 0.8<br />
8300 Highway/Utility 0.5 0.599 0.701 0.8<br />
10-9 <strong>Sweetwater</strong> <strong>Creek</strong> <strong>Watershed</strong> Management <strong>Plan</strong>
Legend<br />
Roads<br />
Hydrography<br />
County Boundary<br />
<strong>Sweetwater</strong> <strong>Creek</strong> Subbasin Boundary<br />
400004 Subbasin Number<br />
Linebaugh Ave<br />
410246410249<br />
411122<br />
411127<br />
411125<br />
411080<br />
411120<br />
411074<br />
411115411116<br />
411075<br />
411066<br />
411110<br />
410855<br />
411065 411111<br />
411060 411135<br />
410854 411070<br />
410856<br />
411130<br />
410852 410857<br />
410660<br />
410900411025411042<br />
411046<br />
410665 410832<br />
411040 411048<br />
410682 410657<br />
410850 411020<br />
411044<br />
CHAPMAN LAKE<br />
410680410670<br />
410830<br />
410870 411010<br />
410840<br />
410684 410650<br />
410865410880<br />
410633<br />
410810 410847<br />
411015<br />
410635<br />
410860411700<br />
410801<br />
410631<br />
410800<br />
410639<br />
410620<br />
411710<br />
410630PLATT LAKE<br />
411720<br />
410607410610<br />
411730<br />
410645<br />
410637<br />
410600<br />
410590<br />
410583<br />
411589<br />
411986 412990410582<br />
411987 412960 410581 410580<br />
411981411960<br />
412980<br />
411587<br />
411975 410540 MAGDALENE, LAKE<br />
411983 410535<br />
410560<br />
411920410530<br />
410570 410585<br />
410501 410510410548<br />
410584<br />
BAY LAKE<br />
410586<br />
410500<br />
410503<br />
410480410470<br />
410469 415545<br />
415550<br />
419970<br />
415540<br />
419942<br />
410466<br />
419935 419965 410460<br />
415530<br />
419960<br />
410462 415520<br />
419926419920<br />
415515<br />
419928<br />
419929 419910 410430<br />
410299 410335<br />
410450<br />
Gunn Hwy<br />
Fletcher Ave<br />
Dale Mabry Hwy<br />
Waters Ave<br />
Ehrlich Rd<br />
Lake Ellen Dr<br />
Busch Blvd<br />
Lake Magdalene Blvd<br />
CARROLL, LAKE<br />
415500<br />
410247<br />
410348<br />
410245 410248<br />
410345<br />
410346<br />
415505<br />
410295<br />
410344 415400<br />
410244<br />
410278 410291410330<br />
410338 415320 415350<br />
410320<br />
410277410276<br />
415307<br />
410300<br />
415300<br />
415600<br />
410250<br />
410242<br />
WHITE TROUT LAKE<br />
410188 410240 414368410255<br />
414366<br />
410235<br />
CITRUS PARK LAKE<br />
414365<br />
415280 415277<br />
410185<br />
415185<br />
410210<br />
410218<br />
415270415279<br />
410238<br />
415210<br />
414360 414362 415150<br />
415199<br />
413980 410165<br />
415170<br />
410190<br />
410217<br />
414540414760<br />
415200<br />
414359<br />
410170<br />
415195<br />
414530<br />
413966<br />
410150<br />
413968 413962 413960<br />
410148<br />
414357 414570 414850<br />
414720<br />
413964<br />
410145<br />
410140<br />
414590<br />
413940<br />
414155<br />
414592<br />
414351 414520 414710<br />
413946 413944<br />
414354<br />
414150 414250 414582 414700<br />
413913413912<br />
413930 410100<br />
410130<br />
414650<br />
413910<br />
414343<br />
410070<br />
414100<br />
414350<br />
414670<br />
413911<br />
414300 414600<br />
414680<br />
414660<br />
410010 410055410065<br />
413900 410122410126<br />
414345<br />
410060 410104410106<br />
414450<br />
410040 414301<br />
410050<br />
410072<br />
410030<br />
410071<br />
410410<br />
Old US Hwy 41<br />
Bearss Ave<br />
I-275<br />
Nebraska Ave<br />
Anderson Rd<br />
0 6,000 12,000 Feet<br />
Subbasin Divisions in the <strong>Sweetwater</strong> <strong>Creek</strong> <strong>Watershed</strong><br />
Figure<br />
10-5
Table 10-4 Event mean concentration (EMC) values by land use in Hillsborough County<br />
NPDES Conventional WQ (mg/l)<br />
NO 3<br />
Land Use BOD 5<br />
TSS TKN +NO 2<br />
TN TP TDP<br />
NPDES Metals (mg/l)<br />
Oil and<br />
Grease Cd Cu Pb Zn<br />
Low/Medium Density Residential 1.00 19.00 1.082 0.281 1.363 0.401 0.282 1.080 0.001 0.013 0.008 0.022<br />
High Density Residential 2.60 29.00 1.368 0.679 2.047 1.337 0.552 1.073 0.001 0.047 0.006 0.058<br />
Light Industrial 2.87 18.20 2.088 0.187 2.275 0.332 0.187 3.663 0.001 0.024 0.006 0.096<br />
Agricultural 18.30 12.70 2.167 0.803 2.970 2.349 1.223 0.500 0.013 0.041 0.003 0.017<br />
Commercial 2.67 22.92 1.645 0.387 2.032 0.279 0.157 0.650 0.001 0.018 0.004 0.026<br />
Institutional 2.67 22.92 1.645 0.387 2.032 0.279 0.157 0.650 0.001 0.018 0.004 0.026<br />
Highway/Utility 24.00 261.00 2.990 1.140 4.130 0.120 0.300 0.400 0.040 0.103 0.960 0.410<br />
Recreational 3.80 11.10 2.090 0.508 2.598 0.050 0.130 0.900 0.007 0.041 0.006 0.004<br />
Open Land 3.80 11.10 2.090 0.508 2.598 0.050 0.130 0.900 0.001 0.001 0.001 0.006<br />
Extractive (Mining)/Disturbed 28.94 13.20 3.500 0.030 3.530 0.194 0.134 0.900 0.001 0.001 0.001 0.006<br />
Upland Forest 0 0 0 0 0 0 0 0 0 0 0 0<br />
Wetland Forest 0 0 0 0 0 0 0 0 0 0 0 0<br />
Wetland Non-Forested 0 0 0 0 0 0 0 0 0 0 0 0<br />
Water 0 0 0 0 0 0 0 0 0 0 0 0<br />
Note:<br />
1. FLUCCS code (FDOT 1985) ending in "0" indicates Level 1 (includes all subcategories).<br />
2. Stormwater characterization stations for NPDES permit (Hills. Co., 1993); "NA" - not analyzed.<br />
NPDES parameters: BOD5, COD, TSS, TDS, TKN, NO3+NO2, TP, DP, O&G; cadmium, copper, lead, zinc.<br />
All EMC values without footnotes were obtained from samples collected for the Hills. Co. NPDES Permit Application (1994).<br />
For parameters not detected in all samples, EMCs were calculated using one-half the reporting limit for nondetects.<br />
"BDL" - indicates below detection limits for all Hills. Co. samples collected for a particular land use.<br />
For pollutants not reported by Hills. Co. (1994), additional sources were used as noted:<br />
a. Average values used by Hillsborough Co. (1994) (from Smith and Lord (1990), provided in Wanielista and Yousef (1993).<br />
b. Literature value reported as EMC in Hillsborough Co. 1994.<br />
c. Calculated value from Sarasota County stormwater samples.<br />
d. Orange County, 1993.<br />
e. Surrogate based on 1/2 DL for values reported as BDL.<br />
f. EMCs for open land use were assumed to be less than or equal EMCs for recreational land use.<br />
g. Total nitrogen (TN) estimated as the sum of NH 3 + organic-N (TKN) and oxidized-N (NO 2 +NO 3 ).<br />
EMCs reported as representative of agricultural land use were used for all subcategories of agricultural land use (e.g., pastures, crops, and groves).
Total Nitrogen Loading Potential by Land Use and Hydrologic Group<br />
Figure<br />
10-6
Total Phosphorus Loading Potential by Land Use and Hydrologic Group<br />
Figure<br />
10-7
Total Suspended Solids Loading Potential by Land Use and Hydrologic Group<br />
Figure<br />
10-8
CHAPTER 10<br />
Literature reviews performed by Parsons Engineering Science, Inc. for the Northwest<br />
Hillsborough and Pemberton/Baker <strong>Creek</strong> watershed reports in 1999 included comparisons of<br />
pollutant values in Hillsborough County to other Florida and national studies. Summaries of<br />
these comparisons are provided in the following paragraphs:<br />
• “BOD5 data found in Hillsborough County samples tend to be lower, or similar, than<br />
those found in other areas in Florida, except for agriculture. The agriculture EMC for<br />
BOD5 is approximately five times larger than other values reported in Florida. In general,<br />
Hillsborough County agricultural land use EMCs for a number of parameters, tend to be<br />
much higher than those reported elsewhere in Florida. For most parameters, these<br />
elevated EMCs increase estimated load calculations significantly where agricultural land<br />
use is found.”<br />
• “Nitrogen from residential land uses tends to be higher in Florida and Hillsborough<br />
County than nationally due to the increased application of lawn fertilizer by homeowners<br />
and golf course managers. Slightly higher TKN and TP values for multi-family sites may<br />
reflect more intensive landscape maintenance for these land uses. Commercial land<br />
uses also have nitrogen values that are higher than national averages. This may reflect<br />
primarily atmospheric deposition, as studies in Florida have shown that commercial sites<br />
produce elevated nitrogen loads even if little green area is present. Phosphorous runoff<br />
tends to be lower in Florida than the U.S. average, although data from Hillsborough<br />
County studies differs somewhat. Phosphorous runoff from residential and commercial<br />
land uses are higher than Florida average, while runoff from industrial land uses are<br />
similar to Florida and national averages. As with nitrogen, elevated loads from multifamily<br />
land uses could reflect more intensive landscape maintenance. The Hillsborough<br />
County data indicate that total nitrogen and total phosphorus EMCs for the agricultural<br />
land use are 74 and 586 percent higher, respectively, than that for low/medium family<br />
residential uses. The total nitrogen EMC is similar to that found for other locations in<br />
Florida. However, the EMC for total phosphorus is six times as high as the average EMC<br />
found for various agricultural sites in Florida. This situation makes agriculture one of the<br />
main contributors of nutrient loadings.”<br />
• “TSS data for Hillsborough County are comparable to other Florida locations and lower<br />
than U.S. averages. TSS results from soil erosion, with construction sites a major<br />
contributor along with agricultural practices. Additional primary sources of TSS include<br />
vehicle emissions and atmospheric deposition.”<br />
• “Lead data for Hillsborough County are lower than other locations in Florida and across<br />
the U.S. Relatively low lead concentrations may reflect fate and transport characteristics<br />
of the particular systems sampled and/or decreased emissions due to the use of<br />
unleaded gasoline. Copper data for Hillsborough County are higher than other locations<br />
in Florida, but similar to the nationwide average. Relatively high values were observed<br />
for residential land uses. Transportation-related activities, particularly releases from<br />
brake linings, have been identified as primary sources for copper. Copper is also a<br />
common element in algaecides and fungicides, and many fertilizers contain copper. Zinc<br />
data are much lower for Hillsborough County and Florida in general than the rest of the<br />
10-15 <strong>Sweetwater</strong> <strong>Creek</strong> <strong>Watershed</strong> Management <strong>Plan</strong>
POLLUTANT LOADING AND REMOVAL MODEL<br />
U.S. Sources of zinc include industrial processes, transportation-related activities,<br />
atmospheric deposition and fertilizers. Relatively low zinc concentrations may reflect fate<br />
and transport characteristics of the particular systems sampled and/or the presence of<br />
fewer industrial processing facilities in Hillsborough County than other parts of the U.S.”<br />
10.2.5 Existing Stormwater Treatment<br />
The type and coverage of BMPs providing stormwater treatment were also determined to<br />
estimate net pollutant loads from each subbasin. BMP coverage data was developed for each<br />
aggregate land use within each subbasin based on existing Environmental Resource Permit<br />
(ERP) data (Figure 10-9) provided by the SWFWMD and photo-interpretation of digital<br />
orthophotography. BMPs used to reduce loads generated by various land uses included wet<br />
ponds, percolation ponds (dry retention basins), grassed swales, infiltration trenches, on-line<br />
retention, off-line retention/detention, wet detention with natural wetlands, and<br />
infiltration/exfiltration. Table 10-5 provides the estimated removal efficiencies of a BMP for a<br />
given pollutant.<br />
Table 10-5<br />
Estimated Pollutant Removal Efficiencies for Typical Stormwater BMPs<br />
BMP Type BOD 5 TSS TKN NO 3 +NO 2 TN TP TDP Oil &<br />
Wet Detention 60% 1 85% 1 30% 1 80%<br />
Percolation 80% 1 80% 1 80% 1 80%<br />
1<br />
1<br />
Grease<br />
Cd Cu Pb Zn<br />
30% 1 65% 1 80% 3 35% 2 75% 2 65% 1 75% 1 85% 1<br />
80% 1 80% 1 80% 3 80% 3 80% 3 80% 1 80% 1 80% 1<br />
Infiltration Trench 75% 4 60% 4 65% 4 65% 4<br />
Grass Swale 60% 4 10% 4 15%<br />
4<br />
10% 4 20% 4 70% 4 60% 4<br />
On-Line Retention 1 40% 1 85% 1 15% 1 95%<br />
1<br />
40% 1 50% 1 10% 1 25% 1 50% 1 70% 1<br />
Off-line<br />
Retention/Detention 80% 1 90% 1 60% 1 85% 1 65% 1 75% 1 85% 1<br />
(Dual Ponds) 1<br />
Wet Detention with 60% 1 80% 1 30% 1 80%<br />
1<br />
30% 1 65% 1 80% 1 35% 1 75% 1 65% 1 75% 1 85% 1<br />
Natural Wetlands<br />
Infiltration/Exfiltration 90% 1 90% 1 70% 1 70% 1 70% 1 60% 1<br />
Source:<br />
1<br />
Harper, H.H. 1999. Pollutant removal efficiencies for typical stormwater management systems in Florida.<br />
Florida Water Resources Journal.<br />
2<br />
Kadlec, R.H. and R.L. Knight, 1996. "Treatment Wetlands." CTC Press, Inc. Boca Raton, Florida.<br />
3<br />
USEPA, 1993. "Guidance specifying management measures for sources of nonpoint pollution in coastal waters."<br />
U.S. Environmental Protection Agency, Office of Water, Washington, D.C.<br />
4<br />
Parsons Engineering Science, Inc. Unpublished Data.<br />
10-16 <strong>Sweetwater</strong> <strong>Creek</strong> <strong>Watershed</strong> Management <strong>Plan</strong>
Legend<br />
Roads<br />
Hydrography<br />
County Boundary<br />
Subbasins<br />
WATER<br />
ERPs<br />
ESTES, LAKE<br />
Old US Hwy 41<br />
ROCKET, LAKE<br />
CHAPMAN LAKE<br />
Lake Magdalene Blvd<br />
PLATT LAKE<br />
LONG LAKE<br />
Ehrlich Rd<br />
MAGDALENE, LAKE<br />
Bearss Ave<br />
I-275<br />
Nebraska Ave<br />
BAY LAKE<br />
Fletcher Ave<br />
GEORGE LAKE<br />
Linebaugh Ave<br />
CITRUS PARK LAKE<br />
CASEY, LAKE<br />
Gunn Hwy<br />
Dale Mabry Hwy<br />
ELLEN, LAKE<br />
Lake Ellen Dr<br />
LIPSEY, LAKE<br />
CARROLL, LAKE<br />
BOAT LAKE<br />
Busch Blvd<br />
Waters Ave<br />
Anderson Rd<br />
0 6,000 12,000 Feet<br />
Location of ERPs in the <strong>Sweetwater</strong> <strong>Creek</strong> <strong>Watershed</strong><br />
Figure<br />
10-9
POLLUTANT LOADING AND REMOVAL MODEL<br />
For each land use within a subbasin, a percent coverage of the area treated by a particular BMP<br />
was estimated and delineated as a polygon within a BMP coverage file created in ESRI®<br />
ArcMap TM . Efforts were made to use regularly published electronic data, and to digitize the<br />
resulting treatment areas so that they could be revised as new data to become available in the<br />
future. The following GIS data layers were used to create the necessary BMP inputs for the<br />
pollutant loading model.<br />
1. Land use (2004) from SWFWMD;<br />
2. Soils (1990) from the United States Department of Agriculture/Natural Resource<br />
Conservation Service (formerly USDA/SCS) Soil Survey Maps;<br />
3. Subbasin boundaries as described in Section 10.2.3;<br />
4. Digital orthophotos obtained from SWFWMD (2004); and<br />
5. ERP data from SWFWMD (2002).<br />
The percent of treated area within a subbasin for a particular land use was estimated by utilizing<br />
all of the available resources to pinpoint treatment ponds, treatment ditches and other<br />
recognized treatment practices. For this model, only those treatment areas that were man-made<br />
were considered. Although natural wetlands and depressions may offer some level of treatment,<br />
they were not considered. Treatment areas were first located by overlaying ERP data and 2004<br />
orthophotography using ESRI® ArcMap TM software. Figure 10-10 illustrates a typical BMP<br />
identified using the digital orthophotographs and ERP data.<br />
To aid in the identification of treatment areas, the orthophotos were verified against the land use<br />
coverage. Subsequently, all three data layers were viewed together (ERP, orthophotos and land<br />
use layers) to determine treatment area boundaries and confirm the type of treatment used<br />
(Figure 10-11). Once the 621 treatment areas were outlined in GIS, they were digitized in<br />
ESRI® ArcMap TM (Figure 10-12).<br />
There are several advantages of digitizing the treatment areas, including the following:<br />
1. Modeling results are reproducible;<br />
2. Treatment polygons may be geographically overlaid on other GIS coverages (e.g.,<br />
soils, land-use, potentiometric surface, etc.);<br />
3. Digitized information can be used in future analyses including characterizing the<br />
effects of land use changes; and<br />
4. Treatment polygons can be added or deleted to reflect changes in the level of<br />
treatment. For example, when a property is developed or new regulations come into<br />
effect, the treatment characteristics of the area may significantly change.<br />
After the treatment areas were identified, a final GIS layer was developed through a series of<br />
intersections and unions of layers containing the treatment areas, soils, land use and subbasin<br />
boundaries. As a result, each polygon in the final layer had specific soil, land use and treatment<br />
characteristics.<br />
10-18 <strong>Sweetwater</strong> <strong>Creek</strong> <strong>Watershed</strong> Management <strong>Plan</strong>
Identification of BMPs Using Digital Orthography and ERP Data<br />
Figure<br />
10-10
Identification of Treatment Areas<br />
Figure<br />
10-11
Legend<br />
Roads<br />
Hydrography<br />
County Boundary<br />
Subbasins<br />
WATER<br />
BMPs<br />
ESTES, LAKE<br />
Old US Hwy 41<br />
ROCKET, LAKE<br />
CHAPMAN LAKE<br />
Lake Magdalene Blvd<br />
PLATT LAKE<br />
LONG LAKE<br />
Ehrlich Rd<br />
MAGDALENE, LAKE<br />
Bearss Ave<br />
I-275<br />
Nebraska Ave<br />
BAY LAKE<br />
Fletcher Ave<br />
GEORGE LAKE<br />
Linebaugh Ave<br />
CITRUS PARK LAKE<br />
CASEY, LAKE<br />
Gunn Hwy<br />
Dale Mabry Hwy<br />
ELLEN, LAKE<br />
Lake Ellen Dr<br />
LIPSEY, LAKE<br />
CARROLL, LAKE<br />
BOAT LAKE<br />
Busch Blvd<br />
Waters Ave<br />
Anderson Rd<br />
0 6,000 12,000 Feet<br />
Location of BMPs in the <strong>Sweetwater</strong> <strong>Creek</strong> <strong>Watershed</strong><br />
Figure<br />
10-12
POLLUTANT LOADING AND REMOVAL MODEL<br />
In order to ascertain the percentage of coverage of each BMP for each type of land use and soil<br />
within a subbasin, the information provided by the final GIS layer was incorporated into a<br />
database. The database was then used to query for areas of unique combinations of subbasin,<br />
land use and hydrologic soil group. This database was also used to obtain information regarding<br />
the percentage of area being treated by a particular BMP for each type of land use within a<br />
subbasin. The pollutant loading model provided by the County requires that land uses be<br />
grouped in specific classifications and input data files (Excel® files) in structured formats. To<br />
accomplish this, a series of Excel® macro programs were created to aggregate land use, assign<br />
appropriate hydrologic classifications, and appropriately format the model input files.<br />
Spreadsheet calculations were also performed to verify query results, and to ensure that the<br />
land use and hydrologic classifications match those of the model and appropriate soils<br />
information.<br />
BMPs identified in the <strong>Sweetwater</strong> <strong>Creek</strong> watershed were either retention ponds or grass<br />
swales. Distinct concentrations of ERP locations were observed in the northern and southern<br />
portions of the watershed, mainly located along Waters Avenue, Dale Mabry Highway, and Old<br />
US Highway 41. BMPs identified throughout the watershed also seem to cluster around the<br />
northern and southern parts of the <strong>Sweetwater</strong> <strong>Creek</strong> watershed. Many BMPs identified in this<br />
area belong to many densely populated residential neighborhoods situated within the<br />
watershed.<br />
It is important to note that the pollutant loads generated from this modeling effort are based on<br />
the 2004 aerial photography and 2004 land use information. Recently proposed and constructed<br />
developments and BMPs that are not accounted for in the 2004 land use or present on the 2004<br />
aerial photography were not included in this analysis. Since all of the coverages used for the<br />
model are in digital format, this information can be updated relatively easily as new land use<br />
data and aerial photography becomes available.<br />
10-22 <strong>Sweetwater</strong> <strong>Creek</strong> <strong>Watershed</strong> Management <strong>Plan</strong>
CHAPTER 10<br />
10.3 Pollutant Loads<br />
The EPA Simple Method (US EPA, 1992) was used in the pollutant loading model to calculate<br />
loads. According to the Simple Method, non-point source pollutant loads are calculated using<br />
the following formula:<br />
L I = (0.227)(P)(CF)(Rv I )(C I )(A I )<br />
where:<br />
L I = annual pollutant load per basin (lb/yr)<br />
P = annual average precipitation (in/yr)<br />
Rv I = weighted average runoff coefficient based on impervious area<br />
C I = event mean concentration of pollutant (mg/L)<br />
A I = catchment area contributing to outfall (acres)<br />
CF = correction factor for storms that do not produce runoff<br />
(assumed CF=0.9, 10 percent of storms do not produce runoff)<br />
The runoff characteristics discussed above were used with EMC values for specific land uses to<br />
calculate gross pollutant loads. All EMCs, runoff coefficients, and BMP efficiency values were<br />
incorporated into lookup tables provided with the model. Data generated in GIS by the union of<br />
subbasin area, hydrologic soils groups, and land use were then used to estimate average<br />
annual runoff. This runoff value was calculated as the product of the annual rainfall amount<br />
times the corresponding weighted runoff coefficient for a given subbasin. A correction factor of<br />
0.9 was used to account for the numerous small rainfall events (possibly less than 0.1 inch) that<br />
occur throughout the year but do not result in any runoff as a result of abstraction. The<br />
contribution from each subbasin in terms of stormwater runoff volume was then calculated by<br />
multiplying the runoff coefficient times the average annual rainfall value for the Tampa Bay area<br />
(52.4 inches x correction factor or 0.9 = 47.16 inches).<br />
10.3.1 Gross Pollutant Loads<br />
Estimates of gross pollutant loads were calculated for each subbasin within the entire<br />
watershed using the 2004 land use and hydrologic soils information. These calculations were<br />
performed assuming no existing stormwater treatment within any of the subwatersheds<br />
throughout the project area.<br />
10.3.2 Annual Net Pollutant Loads<br />
Estimates of annual net pollutant loads were subsequently calculated for each subbasin in the<br />
<strong>Sweetwater</strong> <strong>Creek</strong> watershed using the 2004 land use and hydrologic soils information and the<br />
stormwater treatment BMP coverage file. These calculations typically resulted in lower pollutant<br />
10-23 <strong>Sweetwater</strong> <strong>Creek</strong> <strong>Watershed</strong> Management <strong>Plan</strong>
POLLUTANT LOADING AND REMOVAL MODEL<br />
loading values for those subbasins that received one or more of the eight types of stormwater<br />
treatment. Net pollutant loads are summarized for the watershed level in Table 10-6. Net<br />
pollutant loads at the subbasin level are provided in Table 10-1 in the Appendix for Chapter 10.<br />
Table 10-6<br />
Net Pollutant Loads for the <strong>Watershed</strong> Level<br />
for <strong>Sweetwater</strong> <strong>Creek</strong> <strong>Watershed</strong> (lb/yr)<br />
NO3<br />
Oil and<br />
BOD5 TSS TKN +NO2 TN TP TDP Grease Cd Cu Pb Zn<br />
195,819 1,674,495 81,575 22,990 103,480 37,877 20,378 63,387 201 1,842 2,888 3,044<br />
To further analyze net pollutant loading spatially, loading data was incorporated into GIS and<br />
color coded to show areas of high pollutant loading potential on an annual basis. A select<br />
number of parameters were chosen based on existing concerns within the <strong>Sweetwater</strong> <strong>Creek</strong><br />
watershed. Those parameters included total suspended solids (TSS – which can limit<br />
penetration of light, causing problems for submerged aquatic vegetation), total nitrogen (TN –<br />
which can result in eutrophic conditions), and total phosphorus (TP – which can result in<br />
eutrophic conditions). Figures 10-13 through 10-15 illustrate the subbasins TSS, TN, and TP<br />
annual loading per acre.<br />
Total Suspended Solids<br />
Total suspended solids loading values were greatest in subbasins that contained high density<br />
residential and highway/utility land uses (Figure 10-13). <strong>Sweetwater</strong> <strong>Creek</strong> watershed is<br />
characterized by highly developed areas; occurrence of natural land use types is rare. It<br />
contains a number of densely populated neighborhoods, large commercial and industrial<br />
polygons, and a number of major highways. These land uses are characterized by large<br />
impervious surface area (such as roads, buildings, parking lots, etc.), which have relatively high<br />
runoff coefficients and pollutant loads. It appears that the areas exhibiting the greatest TSS<br />
loads are clustered around high density residential and highway/utility land uses. Figure 10-7<br />
previously illustrated that the highway/utility land use category exhibit the highest degree of<br />
loading for TSS out of all other land use types. Although, only 3.67% of the <strong>Sweetwater</strong> <strong>Creek</strong><br />
watershed land use coverage is comprised of the highway/utility land use category, it is<br />
responsible for over 40% of the TSS loading into the waterbodies of the <strong>Sweetwater</strong> <strong>Creek</strong><br />
watershed. Majority of the watershed area (over 50%) is comprised of various residential land<br />
use types that cumulatively cause over 45% of the total TSS load.<br />
The high percentage of coverage for highway/utility and high density residential land uses within<br />
the watershed and their high EMC values make these areas a significant contributor of TSS<br />
pollution. Table 10-7 compares the TSS loading for different types of land uses in the<br />
<strong>Sweetwater</strong> <strong>Creek</strong> watershed.<br />
10-24 <strong>Sweetwater</strong> <strong>Creek</strong> <strong>Watershed</strong> Management <strong>Plan</strong>
Legend<br />
Roads<br />
Hydrography<br />
Subbasins<br />
County Boundary<br />
Subbasin TSS Loading (lb/yr/ac)<br />
3.55 - 36.18<br />
36.19 - 63.67<br />
63.68 - 90.08<br />
90.09 - 125.62<br />
125.63 - 162.00<br />
162.01 - 214.63<br />
214.64 - 306.62<br />
306.63 - 415.23<br />
415.24 - 557.05<br />
557.06 - 1387.68<br />
Ehrlich Rd<br />
Lake Magdalene Blvd<br />
MAGDALENE, LAKE<br />
ESTES, LAKE<br />
Old US Hwy 41<br />
ROCKET, LAKE<br />
CHAPMAN LAKE<br />
LONG LAKE<br />
PLATT LAKE<br />
Bearss Ave<br />
I-275<br />
Nebraska Ave<br />
<br />
BAY LAKE<br />
Fletcher Ave<br />
GEORGE LAKE<br />
Linebaugh Ave<br />
CITRUS PARK LAKE<br />
CASEY, LAKE<br />
Gunn Hwy<br />
Dale Mabry Hwy<br />
ELLEN, LAKE<br />
Lake Ellen Dr<br />
LIPSEY, LAKE<br />
CARROLL, LAKE<br />
BOAT LAKE<br />
Busch Blvd<br />
Waters Ave<br />
Anderson Rd<br />
0 6,000 12,000 Feet<br />
Note:<br />
Results of the NPS Pollutant Loading<br />
and Removal model are based on<br />
2004 Land Use and<br />
2006 Aerial Photography<br />
obtained from the SWFWMD.<br />
Subbasin Loads for TSS (lb/yr/ac) in the <strong>Sweetwater</strong> <strong>Creek</strong> <strong>Watershed</strong><br />
Figure<br />
10-13
Legend<br />
Roads<br />
Hydrography<br />
Subbasins<br />
County Boundary<br />
Subbasin TN Loading (lb/yr/ac)<br />
0.67 - 3.12<br />
3.13 - 4.58<br />
4.59 - 5.65<br />
5.66 - 6.79<br />
6.80 - 8.35<br />
8.36 - 9.99<br />
10.00 - 11.78<br />
11.79 - 14.70<br />
14.71 - 19.74<br />
19.75 - 26.60<br />
Ehrlich Rd<br />
Lake Magdalene Blvd<br />
MAGDALENE, LAKE<br />
ESTES, LAKE<br />
Old US Hwy 41<br />
ROCKET, LAKE<br />
CHAPMAN LAKE<br />
LONG LAKE<br />
PLATT LAKE<br />
Bearss Ave<br />
I-275<br />
Nebraska Ave<br />
<br />
BAY LAKE<br />
Fletcher Ave<br />
GEORGE LAKE<br />
Linebaugh Ave<br />
CITRUS PARK LAKE<br />
CASEY, LAKE<br />
Gunn Hwy<br />
Dale Mabry Hwy<br />
ELLEN, LAKE<br />
Lake Ellen Dr<br />
LIPSEY, LAKE<br />
CARROLL, LAKE<br />
BOAT LAKE<br />
Busch Blvd<br />
Waters Ave<br />
Anderson Rd<br />
0 6,000 12,000 Feet<br />
Note:<br />
Results of the NPS Pollutant Loading<br />
and Removal model are based on<br />
2004 Land Use and<br />
2006 Aerial Photography<br />
obtained from the SWFWMD.<br />
Subbasin Loads for TN (lb/yr/ac) in the <strong>Sweetwater</strong> <strong>Creek</strong> <strong>Watershed</strong><br />
Figure<br />
10-14
Legend<br />
Roads<br />
Hydrography<br />
Subbasins<br />
County Boundary<br />
Subbasin TP Loading (lb/yr/ac)<br />
0.05 - 0.51<br />
0.52 - 0.98<br />
0.99 - 1.33<br />
1.34 - 1.75<br />
1.76 - 2.38<br />
2.39 - 3.34<br />
3.35 - 4.78<br />
4.79 - 6.83<br />
6.84 - 10.40<br />
10.41 - 14.49<br />
Ehrlich Rd<br />
Lake Magdalene Blvd<br />
MAGDALENE, LAKE<br />
ESTES, LAKE<br />
Old US Hwy 41<br />
ROCKET, LAKE<br />
CHAPMAN LAKE<br />
LONG LAKE<br />
PLATT LAKE<br />
Bearss Ave<br />
I-275<br />
Nebraska Ave<br />
<br />
BAY LAKE<br />
Fletcher Ave<br />
GEORGE LAKE<br />
Linebaugh Ave<br />
CITRUS PARK LAKE<br />
CASEY, LAKE<br />
Gunn Hwy<br />
Dale Mabry Hwy<br />
ELLEN, LAKE<br />
Lake Ellen Dr<br />
LIPSEY, LAKE<br />
CARROLL, LAKE<br />
BOAT LAKE<br />
Busch Blvd<br />
Waters Ave<br />
Anderson Rd<br />
0 6,000 12,000 Feet<br />
Note:<br />
Results of the NPS Pollutant Loading<br />
and Removal model are based on<br />
2004 Land Use and<br />
2006 Aerial Photography<br />
obtained from the SWFWMD.<br />
Subbasin Loads for TP (lb/yr/ac) in the <strong>Sweetwater</strong> <strong>Creek</strong> <strong>Watershed</strong><br />
Figure<br />
10-15
POLLUTANT LOADING AND REMOVAL MODEL<br />
Table 10-7<br />
TSS Contribution from Various Land Uses<br />
within the <strong>Sweetwater</strong> <strong>Creek</strong> <strong>Watershed</strong><br />
Land Use<br />
Acreage<br />
TSS<br />
Loading<br />
(lb/yr)<br />
Percent of<br />
Land Use<br />
Cover<br />
Percent of<br />
TSS<br />
Loading<br />
Agricultural 194 7,267 1.43% 0.43%<br />
Commercial 1,242 131,395 9.15% 7.85%<br />
Extractive (Mining)/Disturbed 83 206 0.61% 0.01%<br />
High Density Residential 3,766 554,346 27.74% 33.11%<br />
Highway/utility 499 685,089 3.67% 40.91%<br />
Institutional 134 17,833 0.99% 1.06%<br />
Light Industrial 648 63,490 4.78% 3.79%<br />
Low/Medium Density Residential 3,195 199,713 23.53% 11.93%<br />
Open Land 535 10,496 3.94% 0.63%<br />
Recreational 274 4,660 2.02% 0.28%<br />
Upland Forest 222 0 1.64% 0.00%<br />
Water 1,634 0 12.04% 0.00%<br />
Wetland Forest 790 0 5.82% 0.00%<br />
Wetland Non-Forested 358 0 2.64% 0.00%<br />
Grand Total 13,576 1,674,495 100.00% 100.00%<br />
Lowest TSS loading values were found in subbasins having less development or within<br />
subbasins containing some types of water quality treatment system. Subbasins located to the<br />
north of the <strong>Sweetwater</strong> <strong>Creek</strong> watershed contain such land use types as wetlands, upland<br />
forest, recreational, and open space. These areas and subbasins surrounding Lake Magdalene,<br />
located to the north of Waters Avenue, show the lowest TSS loads in the watershed. A plot of<br />
total TSS loads at the subbasin level (Figure 10-13) provides a more detailed spatial<br />
representation of real loading rates.<br />
Total Nitrogen<br />
Total nitrogen loading values were greatest in the south central portion of the <strong>Sweetwater</strong> <strong>Creek</strong><br />
watershed, as well as in the subbasins located along major highways (Figure 10-14). The land<br />
uses represent a mixture of mostly high density residential, industrial, highway/utility, and<br />
commercial and services land use types, with small areas of upland forests and wetlands. As<br />
depicted in Figure 10-5, the land uses that contribute significant TN loading include<br />
highway/utility, light industrial, commercial, institutional, agricultural, and high-density<br />
residentials. Residential land use, representing a little over 50% of the abovementioned<br />
subbasins, contributes over 57%, while highway/utility land use adds an additional 12.8% of the<br />
total TN loads. Table 10-8 illustrates the percentages of land uses and the respective<br />
contribution of TN loading into the subbasins.<br />
10-28 <strong>Sweetwater</strong> <strong>Creek</strong> <strong>Watershed</strong> Management <strong>Plan</strong>
CHAPTER 10<br />
Lowest loading values were found within subbasins containing undeveloped land use, such as<br />
upland forests, wetlands, and open space. A plot of total nitrogen loads at the subbasin level<br />
(Figure 10-14) provides a more detailed spatial representation of areal loading rates. The TN<br />
loading values are greatest throughout the southern portion of the <strong>Sweetwater</strong> <strong>Creek</strong><br />
watershed, with highest values occurring in subbasins characterized by highway/utility and high<br />
density residential land uses.<br />
Table 10-8<br />
TN Contribution from Various Land Uses<br />
within the <strong>Sweetwater</strong> <strong>Creek</strong> <strong>Watershed</strong><br />
Land Use<br />
Acreage<br />
TN<br />
Loading<br />
(lb/yr)<br />
Percent of<br />
Land Use<br />
Cover<br />
Percent of TN<br />
Loading<br />
Agricultural 194 1,775 1.43% 1.72%<br />
Commercial 1,242 13,920 9.15% 13.45%<br />
Extractive (Mining)/Disturbed 83 109 0.61% 0.11%<br />
High Density Residential 3,766 44,384 27.74% 42.89%<br />
Highway/utility 499 13,242 3.67% 12.80%<br />
Institutional 134 1,648 0.99% 1.59%<br />
Light Industrial 648 8,894 4.78% 8.59%<br />
Low/Medium Density Residential 3,195 15,463 23.53% 14.94%<br />
Open Land 535 2,707 3.94% 2.62%<br />
Recreational 274 1,338 2.02% 1.29%<br />
Upland Forest 222 0 1.64% 0.00%<br />
Water 1,634 0 12.04% 0.00%<br />
Wetland Forest 790 0 5.82% 0.00%<br />
Wetland Non-Forested 358 0 2.64% 0.00%<br />
Grand Total 13,576 103,480 100.00% 100.00%<br />
Total Phosphorus<br />
Similarly, for total phosphorus, the greatest loading values were calculated for the southern and<br />
central parts of the <strong>Sweetwater</strong> <strong>Creek</strong> watershed (Figure 10-15). Residential areas are the<br />
major contributors of total phosphorus in these subbasins, accounting for over 86% of the total<br />
loading. The areas depicting the highest TP loadings within the <strong>Sweetwater</strong> <strong>Creek</strong> watershed<br />
can be linked to the individual neighborhoods. For example, subbasins in the southwestern<br />
corner of the watershed belong to the Town-and-Country Park, while two clusters of bright-red<br />
polygons located in the center of the watershed belong to Carrollwood and Rosemount village<br />
communities.<br />
Table 10-9 compares the contributions of the land uses to total phosphorus loading within these<br />
subwatersheds. Lower loading values were found in subbasins containing land uses other than<br />
residential, including subbasins to the north and south of the <strong>Sweetwater</strong> <strong>Creek</strong> watershed. The<br />
plot of total phosphorus loads at the subbasin level (Figure 10-15) provides a more detailed<br />
spatial representation of areal loading rates.<br />
10-29 <strong>Sweetwater</strong> <strong>Creek</strong> <strong>Watershed</strong> Management <strong>Plan</strong>
POLLUTANT LOADING AND REMOVAL MODEL<br />
Table 10-9<br />
TP Contribution from Various Land Uses<br />
within the <strong>Sweetwater</strong> <strong>Creek</strong> <strong>Watershed</strong><br />
Land Use<br />
Acreage<br />
TP<br />
Loading<br />
(lb/yr)<br />
Percent of<br />
Land Use<br />
Cover<br />
Percent of TP<br />
Loading<br />
Agricultural 194 1,391 1.43% 3.67%<br />
Commercial 1,242 1,842 9.15% 4.86%<br />
Extractive (Mining)/Disturbed 83 5 0.61% 0.01%<br />
High Density Residential 3,766 28,227 27.74% 74.52%<br />
Highway/utility 499 370 3.67% 0.98%<br />
Institutional 134 224 0.99% 0.59%<br />
Light Industrial 648 1,267 4.78% 3.34%<br />
Low/Medium Density Residential 3,195 4,475 23.53% 11.81%<br />
Open Land 535 51 3.94% 0.13%<br />
Recreational 274 25 2.02% 0.07%<br />
Upland Forest 222 0 1.64% 0.00%<br />
Water 1,634 0 12.04% 0.00%<br />
Wetland Forest 790 0 5.82% 0.00%<br />
Wetland Non-Forested 358 0 2.64% 0.00%<br />
Grand Total 13,576 37,877 100.00% 100.00%<br />
10.4 Assessment of Pollutant Loading Model<br />
For the purposes of this study, no statistical correlation between the existing water quality<br />
information and pollutant loading results predicted by the model was conducted. However,<br />
during other studies (Hillsborough River <strong>Watershed</strong> Management <strong>Plan</strong>, Ayres Associates Inc,<br />
2002) the same Hillsborough County NPS Pollutant Loading and Removal model was used to<br />
generate pollutant loading information which was later compared to the existing water quality<br />
conditions in the Hillsborough River watershed. In that study, it was concluded that the model<br />
appears to estimate loads within reasonable accuracy for isolated drainage areas where there<br />
are no extraneous factors that affect flow (e.g., dams, surface water withdrawals, etc.).<br />
Pollutant loads generated by the model used in the Hillsborough River <strong>Watershed</strong> study were<br />
also compared to modeling results for the Upper Hillsborough River Diagnostic <strong>Watershed</strong><br />
Assessment project (Limno-Tech, Inc, 1997). The methodology used to estimate areal loads in<br />
the Limno-Tech study involved the use of EPA’s Stormwater Management Model (SWMM)<br />
output to develop estimates of pollutant loads at the subbasin level for total phosphorus, total<br />
nitrogen, and total suspended solids. These values were divided by each subbasin’s area to<br />
estimate unit area load values. Due to the differences in methodology and<br />
subbasin/subwatershed delineations, only general comparisons were made between the model<br />
output of the Hillsborough River <strong>Watershed</strong> study and the Limno-Tech assessment.<br />
10-30 <strong>Sweetwater</strong> <strong>Creek</strong> <strong>Watershed</strong> Management <strong>Plan</strong>
CHAPTER 10<br />
Generally, the two models were in agreement in that the greatest total phosphorus and nitrogen<br />
loads occur in the developed areas near Tampa (Hillsborough River below S-155), <strong>Plan</strong>t City,<br />
and western Polk County (Itchepackesassa <strong>Creek</strong> subwatershed), although the model used in<br />
the Hillsborough River <strong>Watershed</strong> study identified additional areas where elevated loads are<br />
expected to occur. Actual areal loading rates for most parameters were approximately ten times<br />
lower in the Limno-Tech study which was based on time-variable hydrodynamic calculations<br />
using actual flows for the year 1987. Changes in land use and differences in rainfall between<br />
1987 and 1995 may partially account for the significant difference in loading values between the<br />
two studies.<br />
During this study, the NPS modeling procedure was nearly identical to the procedure used<br />
during the Hillsborough River <strong>Watershed</strong> project, therefore, the statement about the model<br />
accuracy is assumed to remain true for this study as well.<br />
10.5 BIBLIOGRAPHY<br />
The attached bibliography includes a list of references used for this study and additional<br />
references that could be cited by readers.<br />
Ayres Associates Inc. 2002. Hillsborough River <strong>Watershed</strong> Management <strong>Plan</strong>. Final Report.<br />
Hillsborough County, Florida.<br />
Harper, H.H. 1999. Pollutant removal efficiencies for typical stormwater management systems in<br />
Florida. Florida Water Resources Journal.<br />
Kadlec, R.H. and R.L. Knight, 1996. "Treatment Wetlands." CTC Press, Inc. Boca Raton,<br />
Florida.<br />
Limno-Tech, Inc. 1997. Upper Hillsborough River Diagnostic <strong>Watershed</strong> Assessment. Final<br />
Report. Southwest Florida Water Management District, Tampa, Florida.<br />
Parsons Engineering Science, Inc. Unpublished Data.<br />
US EPA, 1993. "Guidance specifying management measures for sources of nonpoint pollution<br />
in coastal waters." U.S. Environmental Protection Agency, Office of Water, Washington, D.C.<br />
10-31 <strong>Sweetwater</strong> <strong>Creek</strong> <strong>Watershed</strong> Management <strong>Plan</strong>
CHAPTER 11: WATER QUALITY TREATMENT<br />
LEVEL OF SERVICE<br />
11.1 Overview<br />
This chapter describes the results of the pollutant loading analysis performed in Chapter 10. Based<br />
on these results, a water quality treatment level of service was determined at the subbasin and<br />
watershed levels within the <strong>Sweetwater</strong> <strong>Creek</strong> watershed. This type of analysis will facilitate<br />
prioritization of water quality improvement alternatives (projects) for the <strong>Sweetwater</strong> <strong>Creek</strong><br />
watershed.<br />
Water quality treatment levels-of-service (LOS) criteria were used as part of this watershed study<br />
to allow comparisons of existing and proposed stormwater treatment conditions to pollutant loading<br />
goals and to help prioritize alternatives throughout the watershed.<br />
Excess nitrogen can stimulate algal growth resulting in reduced light penetration through the water<br />
column and subsequent shading and loss of seagrass. The nitrogen reduction goal is based on<br />
loads generated by several potential inputs including point sources, atmospheric deposition, and<br />
non-point source runoff from various land uses. The intent of this management effort is to protect<br />
water quality and, ultimately, valuable natural resources in the <strong>Sweetwater</strong> <strong>Creek</strong> watershed. Other<br />
factors that affect light availability in the bay are also of concern, including excess total suspended<br />
solids (TSS) loads.<br />
11.2 Water Quality Treatment Level of Service<br />
The identification of problem areas and pollutant load reduction goals is an important step in<br />
protecting the river, reservoir, lakes, and groundwater within the watershed, as well as the<br />
downstream estuary. For this analysis, three specific pollutants were identified and discussed in<br />
greater detail due to their importance in local water (quality) management programs. These<br />
parameters include total suspended solids (TSS), total phosphorus, and total nitrogen. In addition,<br />
based on specific concerns, some subbasins required assessment of other parameters, including<br />
heavy metals and bacteria. The results of this modeling effort and the implementation of<br />
alternatives proposed in later chapters of this report will be an important step in restoring and<br />
protecting the surface water within the <strong>Sweetwater</strong> <strong>Creek</strong> watershed.<br />
The modeling effort in this plan focuses on land use and soil conditions as a basis for evaluating<br />
sources of pollutant loads and does not include any routing of pollutants. For comparison<br />
purposes, pollutant loads based on stormwater runoff from single family (low to medium density)<br />
residential land use were selected as the standard (benchmark) for comparison.<br />
11-1 <strong>Sweetwater</strong> <strong>Creek</strong> <strong>Watershed</strong> Management <strong>Plan</strong>
WATER QUALITY TREATMENT LEVEL OF SERVICE<br />
In this manner, the calculation of pollutant loads is consistent with the concept of standard<br />
residential unit (SRU) sometimes used for stormwater utility assessments.<br />
The procedure to identify a treatment LOS designation for each subbasin consisted of the following<br />
steps:<br />
1. Net pollutant loads were calculated for each pollutant of interest based on 2004 land uses,<br />
soils, and existing stormwater treatment best management practices (BMPs) (completed in<br />
Chapter 10);<br />
2. Benchmark pollutant loads were calculated for each pollutant based on the assumption that<br />
100% of the watershed area was developed for low/medium residential land uses and there<br />
is no existing stormwater treatment;<br />
3. Ratios of net load/gross load were calculated; and<br />
4. Criteria described below were applied to each subbasin for each pollutant to determine the<br />
LOS for the subbasin.<br />
Based on the following ranges, water quality LOS criteria were defined as a score from A through<br />
F:<br />
• LOS A, net load equivalent to 20% or less of untreated single family residential. A LOS<br />
equal to A for a subbasin would indicate the presence of a high percentage of<br />
undisturbed natural systems, or high percentages of developed areas treated with<br />
BMPs capable of removing pollution levels to those representing natural systems. Areas<br />
where typical land uses (residential) exhibit stormwater treatment levels above the<br />
minimum required per 62-40.432(5) F.A.C. (Water Policy) would also receive LOS A.<br />
• LOS B, net load equivalent to between 20 and 40% of untreated single family<br />
residential areas. A LOS equal to B would indicate the presence of BMPs with removal<br />
efficiencies consistent with those representing adequately designed and maintained<br />
conditions and a relatively even mix of developed and natural land uses.<br />
• LOS C, net load equivalent to between 40 and 70% of untreated single family<br />
residential areas. A LOS equal to C would indicate the presence of treatment systems<br />
showing removal efficiencies consistent with those representing average to poorly<br />
maintained conditions and a greater percentage of developed versus natural land uses.<br />
• LOS D, net load equivalent to between 70 and 100% of untreated single family<br />
residential areas. A LOS equal to D would indicate minimal treatment of sub-basin<br />
discharges and relatively high percentage of developed land uses.<br />
11-2<br />
<strong>Sweetwater</strong> <strong>Creek</strong> <strong>Watershed</strong> Management <strong>Plan</strong>
CHAPTER 11<br />
• LOS F, net load equal to or greater than 100% of untreated single family residential<br />
areas. A LOS equal to F would indicate no treatment for sub-basin discharges, or the<br />
presence of extensive areas of land uses producing larger pollution loads per unit area<br />
than typical residential land uses.<br />
11.2.1 Water Quality Level-of-Service Pollutant Load Calculations<br />
Benchmark pollutant loads were calculated for each pollutant based on the assumption that 100%<br />
of the watershed area was developed for low/medium residential land uses and no existing<br />
stormwater treatment existed in any of the subbasins. Appendix 11-1 provides a summary of the<br />
benchmark loads by subbasin for <strong>Sweetwater</strong> <strong>Creek</strong> watershed.<br />
11.2.2 Water Quality Level-of-Service Scores<br />
Based on the criteria described above, the treatment level of service designation were developed<br />
for each parameter for each subbasin, which are summarized in the Appendix 11-2. As mentioned<br />
earlier, the three most important parameters of concern in this watershed are total suspended<br />
solids, total nitrogen, and total phosphorus. The observations on these three parameters are<br />
discussed in detail in the following section.<br />
Total Suspended Solids<br />
Total suspended solids (TSS) LOS values tend to be the highest in areas dominated by existing<br />
natural systems, such as wetlands, upland forests, and rangeland (Figure 11-1). These land uses<br />
do not contribute any loads based on the model’s EMC value input dataset. However, <strong>Sweetwater</strong><br />
<strong>Creek</strong> watershed is characterized by densely developed areas. The majority of the watershed area<br />
includes such land uses as high and medium/low density residential, commercial and services,<br />
industrial, and highway/utilities. On an areal basis, a number of subbasin clusters with LOS scores<br />
of C and higher are located in the northern and central portions of the watershed. These subbasins<br />
include areas of undeveloped land, such as wetlands, small forested areas, and ponds. The area<br />
to the north of the watershed includes Avila Golf and Country Club, while the area with higher TSS<br />
LOS scores located closer to the center of the <strong>Sweetwater</strong> <strong>Creek</strong> watershed incorporates open<br />
land and small areas of wetlands located to the east of the Citrus Park Lake. Overall, the<br />
proportion of subbasins with high TSS LOS scores in the <strong>Sweetwater</strong> <strong>Creek</strong> watershed is<br />
significantly lower when compared to the proportion of similar subbasins within other watersheds in<br />
the Old Tampa Bay region (with exception of the Lower <strong>Sweetwater</strong> <strong>Creek</strong> watershed). The<br />
<strong>Sweetwater</strong> <strong>Creek</strong> watershed is much heavier polluted than most watersheds in the northwest<br />
Hillsborough County region.<br />
The remaining subbasins are dominated by the scores of F and D and are primarily characterized<br />
by high density residential, transportation and utilities, commercial and services, and industrial land<br />
uses. Developed land uses are characterized by relatively large impervious surface area (such as<br />
roads, buildings, parking lots, etc.), which have relatively high runoff coefficients and TSS loads.<br />
11-3<br />
<strong>Sweetwater</strong> <strong>Creek</strong> <strong>Watershed</strong> Management <strong>Plan</strong>
Note:<br />
Results of the NPS Pollutant Loading<br />
and Removal model are based on<br />
2004 Land Use and<br />
2006 Aerial Photography<br />
obtained from the SWFWMD.<br />
<br />
ESTES, LAKE<br />
Old US Hwy 41<br />
ROCKET, LAKE<br />
CHAPMAN LAKE<br />
Lake Magdalene Blvd<br />
PLATT LAKE<br />
LONG LAKE<br />
Ehrlich Rd<br />
MAGDALENE, LAKE<br />
Bearss Ave<br />
I-275<br />
Nebraska Ave<br />
BAY LAKE<br />
Fletcher Ave<br />
GEORGE LAKE<br />
Linebaugh Ave<br />
CITRUS PARK LAKE<br />
CASEY, LAKE<br />
Gunn Hwy<br />
Dale Mabry Hwy<br />
ELLEN, LAKE<br />
Lake Ellen Dr<br />
LIPSEY, LAKE<br />
CARROLL, LAKE<br />
BOAT LAKE<br />
Busch Blvd<br />
Legend<br />
Anderson Rd<br />
Waters Ave<br />
Roads<br />
Hydrography<br />
Subbasins<br />
County Boundary<br />
Level of Service: TSS<br />
A<br />
B<br />
C<br />
D<br />
F<br />
0 6,000 12,000 Feet<br />
Water Quality Treatment Level of Service by Subbasin for <strong>Sweetwater</strong> <strong>Creek</strong> <strong>Watershed</strong>: TSS<br />
Figure<br />
11-1
CHAPTER 11<br />
As was indicated in Chapter 10, EMC values for highways/utilities land use category are the<br />
highest out of all other land uses. According to the Hillsborough County NPS Pollutant Loading<br />
and Removal Model, this land use contributes approximately 261mg of total suspended solids per<br />
every liter or runoff.<br />
<strong>Sweetwater</strong> <strong>Creek</strong> watershed encompasses a number of major roads, including Gunn Highway,<br />
Anderson Highway, Dale Mabry Highway, Old US Highway 41, Linebaugh Avenue, Ehrlich Road,<br />
and Fletcher Avenue, as well as a dense network of smaller roads. The watershed also contains<br />
several large residential neighborhoods, such as Avila, Carrollwood, Magdalene Shores Estates,<br />
North Lakes, Town-N-Country Park, Whispering Oaks, and Woodbriar Village, as well as many<br />
smaller residential subdivisions. All of these subdivisions are densely populated and contribute<br />
substantial amounts of TSS and other pollutants into the watershed every year.<br />
Total Nitrogen<br />
Total nitrogen LOS values were also highest within occasional subbasin clusters containing<br />
existing natural systems (wetlands and uplands) (Figure 11-2). These land uses do not contribute<br />
any loads based on the model’s EMC value input dataset. Similarly to the distribution of TSS<br />
scores, only a small number of subbasins exhibiting scores higher than D occurred throughout the<br />
watershed for TN. This is mainly due to additional contributions of total nitrogen from random areas<br />
of agricultural land use and large coverage of the residential land use. Once again, areas with<br />
higher LOS scores for TN occurred in the north of <strong>Sweetwater</strong> <strong>Creek</strong> watershed, to the north of<br />
Lake Magdalene, and in the central eastern part of the watershed surrounding Casey Lake.<br />
The remaining areas incorporated within the <strong>Sweetwater</strong> <strong>Creek</strong> watershed had predominantly F<br />
scores. Low scores occur primarily due to extensive high density residential land uses contained<br />
within various residential subdivisions that dominate the <strong>Sweetwater</strong> <strong>Creek</strong> watershed. Additional<br />
TN contribution comes from other types of development that dominate the watershed, such as<br />
highway/utilities, commercial and services, and industrial. The distribution of poor scores was<br />
consistent with total nitrogen loading calculations for representative stations based on actual<br />
concentration and discharge data described in Chapter 7.<br />
Total Phosphorus<br />
A number of subbasins containing concentration of LOS scores higher than C for total phosphorus<br />
are located in the northern portion of the watershed (subbasins surrounding Chapman Lake),<br />
southern portion of the watershed (Citrus Park Lake) and the central eastern area of the watershed<br />
(Casey Lake) (Figure 11-3). These areas are comprised of a variety of land uses, such as<br />
commercial and services, highway/utility, upland forests, recreational, and others. Other groups of<br />
subbasins with LOS scores of C and higher are located in the area surrounding Platt Lake, to the<br />
north of Bearss Avenue and to the south of Lake Magdalene Boulevard.<br />
11-5<br />
<strong>Sweetwater</strong> <strong>Creek</strong> <strong>Watershed</strong> Management <strong>Plan</strong>
Note:<br />
Results of the NPS Pollutant Loading<br />
and Removal model are based on<br />
2004 Land Use and<br />
2006 Aerial Photography<br />
obtained from the SWFWMD.<br />
<br />
ESTES, LAKE<br />
Old US Hwy 41<br />
ROCKET, LAKE<br />
CHAPMAN LAKE<br />
Lake Magdalene Blvd<br />
PLATT LAKE<br />
LONG LAKE<br />
Ehrlich Rd<br />
MAGDALENE, LAKE<br />
Bearss Ave<br />
I-275<br />
Nebraska Ave<br />
BAY LAKE<br />
Fletcher Ave<br />
GEORGE LAKE<br />
Linebaugh Ave<br />
CITRUS PARK LAKE<br />
CASEY, LAKE<br />
Gunn Hwy<br />
Dale Mabry Hwy<br />
ELLEN, LAKE<br />
Lake Ellen Dr<br />
LIPSEY, LAKE<br />
CARROLL, LAKE<br />
BOAT LAKE<br />
Busch Blvd<br />
Legend<br />
Anderson Rd<br />
Waters Ave<br />
Roads<br />
Hydrography<br />
Subbasins<br />
County Boundary<br />
Level of Service: TN<br />
A<br />
B<br />
C<br />
D<br />
F<br />
0 6,000 12,000 Feet<br />
Water Quality Treatment Level of Service by Subbasin for <strong>Sweetwater</strong> <strong>Creek</strong> <strong>Watershed</strong>: TN<br />
Figure<br />
11-2
Note:<br />
Results of the NPS Pollutant Loading<br />
and Removal model are based on<br />
2004 Land Use and<br />
2006 Aerial Photography<br />
obtained from the SWFWMD.<br />
<br />
ESTES, LAKE<br />
Old US Hwy 41<br />
ROCKET, LAKE<br />
CHAPMAN LAKE<br />
Lake Magdalene Blvd<br />
PLATT LAKE<br />
LONG LAKE<br />
Ehrlich Rd<br />
MAGDALENE, LAKE<br />
Bearss Ave<br />
I-275<br />
Nebraska Ave<br />
BAY LAKE<br />
Fletcher Ave<br />
GEORGE LAKE<br />
Linebaugh Ave<br />
CITRUS PARK LAKE<br />
CASEY, LAKE<br />
Gunn Hwy<br />
Dale Mabry Hwy<br />
ELLEN, LAKE<br />
Lake Ellen Dr<br />
LIPSEY, LAKE<br />
CARROLL, LAKE<br />
BOAT LAKE<br />
Busch Blvd<br />
Legend<br />
Anderson Rd<br />
Waters Ave<br />
Roads<br />
Hydrography<br />
Subbasins<br />
County Boundary<br />
Level of Service: TP<br />
A<br />
B<br />
C<br />
D<br />
F<br />
0 6,000 12,000 Feet<br />
Water Quality Treatment Level of Service by Subbasin for <strong>Sweetwater</strong> <strong>Creek</strong> <strong>Watershed</strong>: TP<br />
Figure<br />
11-3
WATER QUALITY TREATMENT LEVEL OF SERVICE<br />
The remaining areas are dominated by F scores due to the extensive presence of highly developed<br />
land uses. Once again, <strong>Sweetwater</strong> <strong>Creek</strong> watershed is a home to many major residential<br />
subdivisions such as Avila, Carrollwood, Magdalene Shores Estates, North Lakes, Town-N-<br />
Country Park, Whispering Oaks, and Woodbriar Village, which affect the quality of runoff water.<br />
Overall Water Quality<br />
The overall LOS score for the entire <strong>Sweetwater</strong> <strong>Creek</strong> watershed is an F (using an average score<br />
for all parameters combined). The scores of F and D for total nitrogen, total phosphorus, and TSS<br />
dominated the entire watershed. The <strong>Sweetwater</strong> <strong>Creek</strong> watershed is heavily developed and<br />
primarily comprised of various types of residential, commercial and services, industrial, and<br />
highway/utility land uses. These land uses contribute large quantities of a mixture of pollutants into<br />
surface water bodies. The overall low LOS score for the entire watershed (F) indicates that most<br />
subbasins have been developed and extensive contiguous natural systems do not exist in the<br />
watershed.<br />
Unless appropriate treatment measures are implemented, continued loading to surface waters in<br />
the watershed, and eventually, into Old Tampa Bay may result in significant water quality<br />
degradation in the future. Efforts to reduce loading of pollutants to the <strong>Sweetwater</strong> <strong>Creek</strong>,<br />
channels, lakes, sinkholes, and groundwater should be incorporated into future management<br />
activities for the watershed. Future efforts to reduce pollutant loading may include implementation<br />
of local and regional stormwater best management practices (BMP’s - wet detention ponds, baffle<br />
boxes, alum treatment, etc.), low impact development, source reduction (e.g., education programs<br />
for home and business owners to reduce fertilizers and illicit discharges), improved wastewater<br />
treatment practices (extending centralized sewer systems to areas treated by on-site disposal<br />
systems or septic tanks), and restoration/conservation of natural lands and riparian buffer areas to<br />
reduce current and future pollutant loads.<br />
In order to determine the magnitude of pollutant load reduction needed to achieve an LOS score of<br />
A, differences between net loads (from Chapter 10) and benchmark loads that would result in an<br />
LOS score of A were calculated (Table 11-1). It was observed that average reductions of pollutants<br />
would need to be very high (>89%) for all 12 parameters to achieve A LOS scores. Considering the<br />
removal efficiencies of the available stormwater BMPs, achievement of these goals may be<br />
impossible. For example, the <strong>Sweetwater</strong> <strong>Creek</strong> watershed exhibited low LOS scores for total<br />
nitrogen. Figure 11-4 compares the percent reduction of TN loading in the Lower <strong>Sweetwater</strong><br />
<strong>Creek</strong> watershed necessary to achieve an LOS score of A with the removal efficiencies of various<br />
BMPs. The load reduction required to achieve an LOS score of A in this subwatershed is over<br />
86%. Even with the best BMP available in the model for total nitrogen (percolation), such reduction<br />
cannot be achieved. This means that if all of the runoff for the watershed is treated through<br />
percolation ponds, only 80% reduction in loading would be realized as opposed to the higher<br />
percent reduction that would be necessary to achieve an LOS A designation.<br />
11-8<br />
<strong>Sweetwater</strong> <strong>Creek</strong> <strong>Watershed</strong> Management <strong>Plan</strong>
CHAPTER 11<br />
Table 11-1<br />
Estimated Pollutant Loads (lbs/year/acre) and Percent Reductions<br />
needed to equal LOS A loads for <strong>Sweetwater</strong> <strong>Creek</strong> <strong>Watershed</strong><br />
NO3<br />
Oil and<br />
BOD5 TSS TKN +NO2 TN TP TDP Grease Cd Cu Pb Zn<br />
Benchmark Loads 3.85 73.14 4.16 1.08 5.25 1.54 1.09 4.16 0.00 0.05 0.03 0.08<br />
Allowable Load to<br />
Achieve LOS A 0.77 14.55 0.83 0.22 1.04 0.31 0.22 0.83 0.00 0.01 0.01 0.02<br />
Net Loads Based<br />
on Existing Land<br />
Use and<br />
Treatment 14.42 123.34 6.01 1.69 7.62 2.79 1.50 4.67 0.01 0.14 0.21 0.22<br />
Percent<br />
Reduction<br />
Required to<br />
Achieve LOS A 95% 88% 86% 87% 86% 89% 86% 82% 95% 93% 97% 92%<br />
Load Reduction<br />
Required to<br />
Achieve LOS A 13.66 108.79 5.18 1.48 6.58 2.48 1.29 3.84 0.01 0.13 0.21 0.21<br />
<strong>Sweetwater</strong> <strong>Creek</strong> <strong>Watershed</strong> - TN Reductions<br />
100%<br />
90%<br />
80%<br />
70%<br />
60%<br />
50%<br />
40%<br />
30%<br />
20%<br />
10%<br />
0%<br />
Reduction<br />
Required to<br />
Achieve LOS<br />
A for TN<br />
Wet<br />
Detention<br />
Percolation Grass Swale On-Line<br />
Retention<br />
Off-Line<br />
Retention /<br />
Detention<br />
(Dual Ponds)<br />
Wet<br />
Detention<br />
with Natural<br />
Wetlands<br />
Infiltration /<br />
Exfiltration<br />
Alum<br />
Treatment<br />
Figure 11-4 Comparison of the Reduction required to achieve an LOS A Designation<br />
with the removal efficiencies of various best management practices for TN<br />
11-9<br />
<strong>Sweetwater</strong> <strong>Creek</strong> <strong>Watershed</strong> Management <strong>Plan</strong>
CHAPTER 12: PUBLIC MEETING<br />
The first public meeting was held on December<br />
14, 2005 at Sickles High School (Hillsborough<br />
County, Florida). The meeting began at<br />
approximately 6:30 p.m. and ended at<br />
approximately 8:30 p.m. EDT.<br />
A handout containing the project description,<br />
project history, and a list of project contacts<br />
was made available to the public (Appendix 12-<br />
1), along with comment forms.<br />
The format of the public meeting was relatively<br />
informal and was conducted for the purposes<br />
of sharing information about the project and<br />
providing the public with information about the<br />
state of water quality in the Brooker <strong>Creek</strong>,<br />
Double Branch, Rocky/Brushy <strong>Creek</strong>,<br />
<strong>Sweetwater</strong>, and Lower <strong>Sweetwater</strong><br />
watersheds. The meeting agenda included the<br />
following topics:<br />
• Introduction<br />
• Goals and objectives of the project<br />
• Description and purpose of the project<br />
• Brief description of other similar<br />
projects currently conducted in the<br />
area<br />
• Description of the current state of<br />
water quality within the project area.<br />
• Questions and answers<br />
• Answering individual questions at<br />
the stations.<br />
The first portion of the meeting was in the<br />
form of a speech, which helped acquaint<br />
the local residents with the water quality<br />
state of their watersheds and the<br />
objectives of the project. A number of<br />
poster-sized maps were positioned<br />
around the room.<br />
12-1 <strong>Sweetwater</strong> <strong>Creek</strong> <strong>Watershed</strong> Management <strong>Plan</strong>
PUBLIC MEETING<br />
They included:<br />
• Goals and objectives of the project.<br />
• Detailed location map of the project<br />
area.<br />
• Aerial photography map of the<br />
project area.<br />
• Brooker <strong>Creek</strong> watershed: location<br />
of selected water quality sampling<br />
stations and TSI and dissolved<br />
oxygen concentration graphs for<br />
those locations.<br />
• Double Branch watershed: location<br />
of selected water quality sampling<br />
stations and TSI and dissolved<br />
oxygen concentration graphs for those locations.<br />
• Rocky/Brushy <strong>Creek</strong> watershed: location of selected water quality sampling stations and TSI<br />
and dissolved oxygen concentration graphs for those locations.<br />
• <strong>Sweetwater</strong> <strong>Creek</strong> watershed: location of selected water quality sampling stations and TSI<br />
and dissolved oxygen concentration graphs for those locations.<br />
• Lower <strong>Sweetwater</strong> <strong>Creek</strong> watershed: location of selected water quality sampling stations and<br />
TSI and dissolved oxygen concentration graphs for those locations.<br />
Two laptops with GIS capabilities were connected to projectors. One of them contained a GIS<br />
database with the following data layers: aerial photography, land use (1999), ELAPP, watershed<br />
and subbasin boundary, lakes, water quality stations, CIPs, culverts, and bridge locations. Knowing<br />
the name of a lake or a street intersection, an interested resident could obtain a variety of<br />
information about a specific area of<br />
concern. The second laptop was<br />
geared with WaterQual, a software<br />
capable of quickly analyzing and<br />
graphically presenting water quality<br />
data for different contaminants. By<br />
obtaining the name of a water quality<br />
station from either the GIS database<br />
or one of the posters, an interested<br />
resident had an ability to view<br />
various historical and recent water<br />
quality data trends for a specific<br />
location.<br />
12-2<br />
<strong>Sweetwater</strong> <strong>Creek</strong> <strong>Watershed</strong> Management <strong>Plan</strong>
CHAPTER 12<br />
Following the Hillsborough County<br />
personnel presentation regarding the<br />
general description of the project, as well as<br />
the state of water quality in the<br />
aforementioned watersheds, the floor was<br />
opened for questions. The residents of the<br />
area asked a number of interesting<br />
questions regarding various concerns. One<br />
participant asked about the impacts of<br />
leaking septic systems on water quality in<br />
the watershed. She also requested<br />
additional information regarding the<br />
preventive maintenance of her septic<br />
system that could prevent bacteria from entering ground and surface waters. Another resident<br />
requested additional description of the TMDL process. Other questions were pointing at the<br />
sufficiency of existing regulations for accidental or deliberate release of chemicals.<br />
After the question and answer session,<br />
residents were encouraged to look at the<br />
posters and utilize the laptop stations that<br />
presented additional information about<br />
water quality in the area. Hillsborough<br />
County and Ayres Associates staff<br />
assumed positions at different stations<br />
around the room and spent the next hour<br />
answering individual questions of the<br />
meeting participants.<br />
For further information about the state of<br />
the watershed, the public was encouraged<br />
to visit the Hillsborough County<br />
<strong>Watershed</strong> Atlas website at<br />
http://www.hillsborough.wateratlas.usf.edu.<br />
12-3<br />
<strong>Sweetwater</strong> <strong>Creek</strong> <strong>Watershed</strong> Management <strong>Plan</strong>