woolworths holdings limited results
woolworths holdings limited results
woolworths holdings limited results

You also want an ePaper? Increase the reach of your titles
YUMPU automatically turns print PDFs into web optimized ePapers that Google loves.
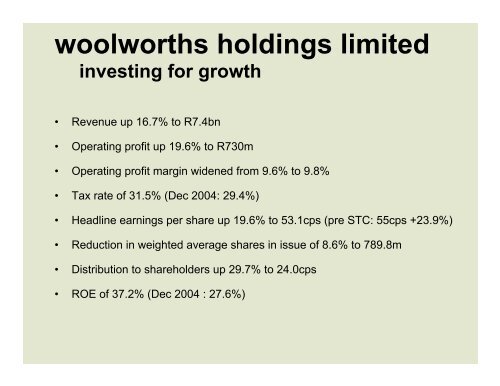
<strong>woolworths</strong> <strong>holdings</strong> <strong>limited</strong><br />
investing for growth<br />
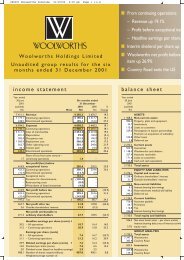
• Revenue up 16.7% to R7.4bn<br />
• Operating profit up 19.6% to R730m<br />
• Operating profit margin widened from 9.6% to 9.8%<br />
• Tax rate of 31.5% (Dec 2004: 29.4%)<br />
• Headline earnings per share up 19.6% to 53.1cps (pre STC: 55cps +23.9%)<br />
• Reduction in weighted average shares in issue of 8.6% to 789.8m<br />
• Distribution to shareholders up 29.7% to 24.0cps<br />
• ROE of 37.2% (Dec 2004 : 27.6%)
<strong>woolworths</strong> <strong>holdings</strong> <strong>limited</strong><br />
trading environment – south africa<br />
Fundamental structural change in South African economy continues<br />
• Economic growth supporting job creation<br />
• Expected tax cuts and social grants<br />
• Continued low inflation environment<br />
• Stable interest rates<br />
Retail<br />
• Good Christmas trading period<br />
• Overall softening retail sales growth rate<br />
• More competitive credit environment
<strong>woolworths</strong> <strong>holdings</strong> <strong>limited</strong> <strong>results</strong><br />
income statement<br />
Dec 2005 Dec 2004* % Chg<br />
Rm<br />
Rm<br />
Revenue 7,415.3 6,353.1 16.7%<br />
Turnover 6,995.0 6,016.6 16.3%<br />
Cost of merchandise 4,710.1 4,036.0 16.7%<br />
Gross Profit 2,284.9 1,980.6 15.4%<br />
Other revenue 420.3 336.5 24.9%<br />
Expenses 1,974.9 1,706.7 15.7%<br />
Operating profit 730.3 610.4 19.6%<br />
Finance costs 113.8 62.0 83.5%<br />
Pre share repurchase 77.3 62.0<br />
As a result of share repurchase 36.5 -<br />
Net profit before tax 616.5 548.4 12.4%<br />
Tax 194.2 161.0 20.6%<br />
Net profit after tax 422.3 386.7 9.0%<br />
Gross margin - on turnover 32.7% 32.9%<br />
Operating margin - on revenue 9.8% 9.6%<br />
ROE 37.2% 27.6%<br />
*Prior year figures restated
<strong>woolworths</strong> <strong>holdings</strong> <strong>limited</strong> <strong>results</strong><br />
expenses analysis<br />
25.0%<br />
R132.9m R337.2m R805.1m R699.7m R1,974.9m<br />
20.0%<br />
21.6%<br />
15.0%<br />
10.0%<br />
11.6%<br />
14.1%<br />
15.7%<br />
5.0%<br />
7.5%<br />
0.0%<br />
Depreciation Occupancy Employment Other Total
<strong>woolworths</strong> <strong>holdings</strong> <strong>limited</strong> <strong>results</strong><br />
adoption of IFRS<br />
Dec-05<br />
Rm<br />
Dec-04<br />
Rm<br />
IFRS adjustments 2.3 ( 10.8)<br />
Share based payments ( 8.1) ( 4.8)<br />
Depreciation on properties & motor vehicles 2.7 3.5<br />
Foreign exchange translation differences 2.0 1.6<br />
Provisioning for doubtful debts 5.7 ( 11.1)<br />
Non-IFRS adjustment for operating leases ( 11.5) ( 16.7)<br />
Tax effect of the above adjustments 0.9 7.4<br />
Outside shareholders effect of the above adjustments 0.1 0.2<br />
Net effect ( 8.2) ( 19.9)<br />
Weighted average shares in issue (millions) 789.8 869.7<br />
Impact on HEPS (cents per share) ( 1.0) ( 2.3)
<strong>woolworths</strong> <strong>holdings</strong> <strong>limited</strong> <strong>results</strong><br />
HEPS and dividend cover<br />
cps<br />
60<br />
50<br />
40<br />
30<br />
20<br />
10<br />
0<br />
3.1<br />
3.1<br />
2.8<br />
2.5<br />
2.2<br />
40.2<br />
33.5<br />
20.9<br />
7.5 10.5 13.0<br />
44.4<br />
53.1<br />
24.0<br />
18.5<br />
Dec 2001 Dec 2002 Dec 2003 Dec 2004 Dec 2005<br />
*<br />
Cover (x)<br />
3.5<br />
3<br />
2.5<br />
2<br />
1.5<br />
1<br />
0.5<br />
0<br />
HEPS DPS Dividend cover<br />
• HEPS compound annual growth rate: 27.4% (5 years)<br />
*Prior year HEPS restated
<strong>woolworths</strong> <strong>holdings</strong> <strong>limited</strong> <strong>results</strong><br />
balance sheet<br />
Dec 2005 Dec 2004* % Chg<br />
Rm<br />
Rm<br />
Assets<br />
Property, plant and equipment 1,421.2 1,262.4 12.6%<br />
Investment property 72.2 56.7 27.3%<br />
Export partnerships 62.4 164.4 -62.0%<br />
Inventory 865.7 801.4 8.0%<br />
Financial services assets 4,010.6 3,388.4 18.4%<br />
Accounts receivable 1,284.4 927.2 38.5%<br />
Cash 282.8 170.9 65.5%<br />
7,999.3 6,771.4 18.1%<br />
Equity and liabilities<br />
Shareholders funds 2,343.3 2,914.9 -19.6%<br />
Accounts payable and deferred tax 2,773.2 2,327.8 19.1%<br />
Borrowings 2,882.8 1,528.7 88.6%<br />
7,999.3 6,771.4 18.1%<br />
Debt ratio 36.0% 22.6%<br />
*Prior year figures restated
<strong>woolworths</strong> <strong>holdings</strong> <strong>limited</strong> <strong>results</strong><br />
cash flow<br />
Dec 2005 Dec 2004<br />
Rm<br />
Rm<br />
Cash inflow from trading 515.1 494.8<br />
Net interest received 232.9 225.5<br />
Working Capital movements 90.0 -118.1<br />
Increase in borrowings 216.0 407.1<br />
1,054.0 1,009.3<br />
Utilised by :<br />
Tax paid -228.9 -170.3<br />
Distribution paid -282.3 -221.8<br />
Capex -303.6 -207.9<br />
Proceeds from disposal/investment income 94.0 0.7<br />
Financial service assets -336.7 -456.4<br />
Shares issued 48.3 46.4<br />
Other loans -44.8 -<br />
-1,054.0 -1,009.3
<strong>woolworths</strong> <strong>holdings</strong> <strong>limited</strong> <strong>results</strong><br />
cash flow (cont.)<br />
growth in <strong>woolworths</strong> financial<br />
services assets R366.5m<br />
Personal Loans- R72.7m<br />
(Dec 04: R95.7m)<br />
WW Card, R197.8m<br />
(Dec 04: R302.9m)<br />
VISA- R95.9m<br />
(Dec 04: 57.8m)
<strong>woolworths</strong> <strong>holdings</strong> <strong>limited</strong> <strong>results</strong><br />
cash flow (cont.)<br />
Dec 04 capex spend: R292.7m<br />
projected to Jun 06: R655.5m<br />
Other – R71.2m<br />
Retail – R159.8m<br />
Other – R190.9m<br />
Retail – R350.7m<br />
IT- R61.7m<br />
IT- R113.9m
<strong>woolworths</strong> <strong>holdings</strong> <strong>limited</strong> <strong>results</strong><br />
return on equity / wacc<br />
Number<br />
of shares<br />
40.0%<br />
35.0%<br />
30.0%<br />
25.0%<br />
20.0%<br />
15.0%<br />
10.0%<br />
5.0%<br />
0.0%<br />
95.9m<br />
82.4m<br />
33.1m<br />
17.5%<br />
16.3%<br />
13.8% 13.8%<br />
11.3% 11.3%<br />
12.3% 18.3% 24.7% 27.4% 33.5% 37.2%<br />
Jun-01 Jun-02 Jun-03 Jun-04 Jun-05 Dec-05<br />
120<br />
100<br />
80<br />
60<br />
40<br />
20<br />
0<br />
ROE WACC Share buy-back
<strong>woolworths</strong> retail <strong>results</strong><br />
income statement (excluding financial services)<br />
Dec 2005 Dec 2004 * % Chg Jun 2005 *<br />
Rm Rm Rm<br />
Revenue 6,511.2 5,559.1 17.1% 11,288.4<br />
Turnover 6,482.5 5,539.6 17.0% 11,227.0<br />
Cost of merchandise 4,479.6 3,813.7 17.5% 7,738.9<br />
Gross Profit 2,002.9 1,725.9 16.0% 3,488.1<br />
Other revenue 28.7 19.5 47.2% 61.4<br />
Expenses 1,498.9 1,304.1 14.9% 2,690.8<br />
Operating profit 532.7 441.3 20.7% 858.7<br />
Finance costs - - -<br />
Net profit before tax 532.7 441.3 20.7% 858.7<br />
Tax 172.2 135.0 27.6% 242.6<br />
Net profit after tax 360.5 306.3 17.7% 616.1<br />
Gross margin - on turnover 30.9% 31.0% 30.9%<br />
Operating margin - on revenue 8.2% 7.9% 7.6%<br />
ROE 72.0% 77.1% 71.7%<br />
*Prior year figures restated
<strong>woolworths</strong> retail <strong>results</strong><br />
balance sheet (excluding financial services)<br />
Dec 2005 Dec 2004 * Jun 2005 *<br />
Rm Rm Rm<br />
Assets<br />
Property, plant and equipment, investments,<br />
deferred tax, loans and goodwill 1,828.3 1,671.1 1,688.0<br />
Inventory 711.0 705.4 563.0<br />
Accounts receivable 759.4 549.8 528.9<br />
Cash 225.7 121.2 163.5<br />
3,524.4 3,047.5 2,943.4<br />
Equity and liabilities<br />
Shareholders funds 1,003.8 879.5 984.4<br />
Accounts payable, provisions and tax 2,520.6 2,168.0 1,959.0<br />
Borrowings - - -<br />
3,524.4 3,047.5 2,943.4<br />
*Prior year figures restated
<strong>woolworths</strong> operations<br />
turnover analysis<br />
Dec 2005 Dec 2004 * % Chg Jun 2005 *<br />
Rm Rm Rm<br />
Clothing & home 3,024.3 2,685.1 12.6% 5,349.5<br />
Corporate (retail) 2,644.4 2,364.5 11.8% 4,730.8<br />
Franchise (wholesale) - local 278.3 233.0 19.4% 452.8<br />
Franchise (wholesale) - international 101.6 87.6 16.0% 165.9<br />
Foods 3,329.3 2,753.2 20.9% 5,666.0<br />
Corporate (retail) 3,152.3 2,631.0 19.8% 5,407.8<br />
Franchise (wholesale) - local 160.1 99.1 61.6% 226.7<br />
Franchise (wholesale) - international 16.9 23.1 -26.8% 31.5<br />
Logistics & other 135.1 107.4 25.8% 223.1<br />
6,488.7 5,545.7 17.0% 11,238.6<br />
*Prior year figures restated
financial services <strong>results</strong><br />
income statement<br />
Dec 2005 Dec 2005 Dec 2004 Dec 2004 Jun 2005 Jun 2005<br />
Rm % to Book Rm % to Book Rm % to Book<br />
Income 430.0 22.8% 354.3 23.4% 773.9 22.6%<br />
Interest received 344.6 18.3% 283.9 18.8% 626.8 17.6%<br />
Other income - external 48.7 2.6% 35.8 2.4% 78.6 2.3%<br />
Other income - internal 36.7 1.9% 34.6 2.3% 68.5 2.0%<br />
Expenses 242.7 12.9% 193.2 12.8% 425.7 12.4%<br />
Net bad debt & provisions 88.2 4.7% 73.7 4.9% 171.9 5.0%<br />
Operating costs 154.5 8.2% 119.5 7.9% 253.8 7.4%<br />
Operating profit 187.3 9.9% 161.1 10.7% 348.2 10.2%<br />
Interest 111.5 60.1 149.0<br />
Base 75.0 60.1 129.0<br />
On increased gearing 36.5 0.0 20.0<br />
Profit before tax 75.8 101.0 199.2<br />
Tax 22.0 26.0 56.9<br />
Profit after tax 53.8 75.0 142.3<br />
Average gross books 3,764.2 2,023.3 3,421.6<br />
Average equity 1,066.4 1,836.2 1,408.9<br />
Gearing ratio 71.7% 45.3% 72.4%<br />
ROE 10.1% 8.2% 9.5%
financial services<br />
<strong>woolworths</strong> credit statistics<br />
Dec Dec<br />
2005 2004<br />
Store card sales as a % of total sales 32.5% 34.4%<br />
Average yield 18.3% 18.8%<br />
Weighted average usury rate 20.0% 20.5%<br />
Average cost of funds 7.7% 8.0%
country road <strong>results</strong><br />
income statement<br />
Dec 2005 Dec 2004* % Chg<br />
A$m<br />
A$m<br />
Revenue 105.1 104.0 1.1%<br />
Turnover 104.2 103.1 1.1%<br />
Cost of merchandise 47.4 48.7 -2.7%<br />
Gross profit 56.8 54.4 4.4%<br />
Other revenue 1.0 0.8 25.0%<br />
Expenses 55.0 53.5 2.8%<br />
Operating profit 2.8 1.7 64.7%<br />
Finance costs 0.5 0.4 25.0%<br />
Net profit before tax 2.3 1.3 76.9%<br />
Average exchange rate (R/A$) 4.9 4.5<br />
Effective profit translation rate (R/A$) 3.4 4.6<br />
Gross margin - on turnover 54.5% 52.8%<br />
Operating margin - on revenue 2.7% 1.6%<br />
ROE (A$) 8.8% 5.1%<br />
*Prior year figures restated
country road <strong>limited</strong> <strong>results</strong><br />
balance sheet<br />
Dec 2005 Dec 2004*<br />
A$m<br />
A$m<br />
Assets<br />
Property, plant and equipment 28.6 26.4<br />
Trademarks** 10.9 11.1<br />
Inventory 33.2 22.0<br />
Accounts receivable 9.4 12.2<br />
Cash 12.2 14.4<br />
94.3 86.1<br />
Equity and liabilities<br />
Shareholders funds 53.6 54.3<br />
Accounts payable and provisions 40.7 31.8<br />
94.3 86.1<br />
Period-end exchange rate (R/A$) 4.7 4.4<br />
*Prior year figure restated<br />
* *Eliminated at Holdings level