Creating an Evidence Base for Vision Rehabilitation
Creating an Evidence Base for Vision Rehabilitation
Creating an Evidence Base for Vision Rehabilitation

Create successful ePaper yourself
Turn your PDF publications into a flip-book with our unique Google optimized e-Paper software.
Gr<strong>an</strong>t Final Report<br />
Gr<strong>an</strong>t ID: 5UC1HS15052<br />
<strong>Creating</strong> <strong>an</strong> <strong>Evidence</strong> <strong>Base</strong> <strong>for</strong> <strong>Vision</strong> <strong>Rehabilitation</strong><br />
Inclusive Dates: 09/01/04 - 08/31/08<br />
Principal Investigator:<br />
Cynthia Stuen, PhD, DSW<br />
Team Members:<br />
Verena Cimarolli, PhD co-PI<br />
John Cullen*<br />
Elizabeth D<strong>an</strong>iels*<br />
Josephine DeFini*<br />
Lenny Goldstein*<br />
Jo<strong>an</strong>nou Ng*<br />
Tom Nol<strong>an</strong>*<br />
Karen Seidm<strong>an</strong>*<br />
Peter Spencer*<br />
Vivi<strong>an</strong> Torres-Suarez*<br />
†<br />
Ken Galarneau<br />
†<br />
Priscilla Wrobel<br />
‡<br />
Reginald MacDonald<br />
Per<strong>for</strong>ming Org<strong>an</strong>izations:<br />
* Lighthouse International<br />
‡ IRIS Network<br />
Ruth Mlotek ‡<br />
‡<br />
Jim Phipps<br />
‡<br />
David Searle<br />
‡<br />
Stephen Trabold<br />
§<br />
Jim Armstrong<br />
§<br />
Kathy Beaver<br />
§<br />
Rudy D’Amico<br />
§<br />
Earl Holmes<br />
§<br />
Kathleen Neary<br />
Stephen Hegedeos<br />
J. Elton Moore<br />
† NYS CVBH<br />
§ CABVI<br />
Project Officer:<br />
David Meyers<br />
Submitted to:<br />
The Agency <strong>for</strong> Healthcare Research <strong>an</strong>d Quality (AHRQ)<br />
U.S. Department of Health <strong>an</strong>d Hum<strong>an</strong> Services<br />
540 Gaither Road<br />
Rockville, MD 20850<br />
www.ahrq.gov
Abstract<br />
Purpose: “<strong>Creating</strong> <strong>an</strong> <strong>Evidence</strong> <strong>Base</strong> <strong>for</strong> <strong>Vision</strong> <strong>Rehabilitation</strong>," focused on the<br />
implementation of the Electronic <strong>Vision</strong> <strong>Rehabilitation</strong> Record (EVRR®) - a patient care system<br />
designed to allow <strong>for</strong> st<strong>an</strong>dardized patient assessment <strong>an</strong>d intervention of vision rehabilitation.<br />
The project objectives were to increase patients’ functional ability, to determine predictors of<br />
optimal post-intervention functional ability, <strong>an</strong>d to achieve optimal levels of perceived patient<br />
satisfaction.<br />
Scope: The project involved the installation <strong>an</strong>d implementation of EVRR® at Lighthouse<br />
International, The IRIS Network in Maine, <strong>an</strong>d the Central Association <strong>for</strong> the Blind <strong>an</strong>d<br />
Visually Impaired (CABVI) in Utica, New York.<br />
Methods: EVRR®’s methodology is consistent with the functional model of rehabilitation<br />
which involves the assessment of the patient's functional difficulties <strong>an</strong>d relating them to needed<br />
interventions. Following service delivery, patients are re-assessed to document ch<strong>an</strong>ges in<br />
functioning. EVRR® <strong>an</strong>d patient satisfaction surveys served as data sources.<br />
Results: All self-assessment <strong>an</strong>d provider intervention functional ability scores signific<strong>an</strong>tly<br />
improved following the receipt of service, with the exception of one at one agency. Receiving a<br />
orientation <strong>an</strong>d mobility (safe travel) intervention consistently emerged as a predictor of optimal<br />
post-service functioning. Patient satisfaction surveys demonstrated high levels of satisfaction<br />
with services received.<br />
Key Words: vision rehabilitation outcomes, low vision<br />
The authors of this report are responsible <strong>for</strong> its content. Statements in the report should not<br />
be construed as endorsement by the Agency <strong>for</strong> Healthcare Research <strong>an</strong>d Quality or the U.S.<br />
Department of Health <strong>an</strong>d Hum<strong>an</strong> Services of a particular drug, device, test, treatment, or<br />
other clinical service.<br />
2
Final Report<br />
Purpose<br />
The primary purpose of the project “<strong>Creating</strong> <strong>an</strong> <strong>Evidence</strong> <strong>Base</strong> <strong>for</strong> <strong>Vision</strong> <strong>Rehabilitation</strong>”<br />
was to implement the Electronic <strong>Vision</strong> <strong>Rehabilitation</strong> Record (EVRR®) - a patient care system<br />
that would improve the consistency <strong>an</strong>d quality of vision rehabilitation interventions across<br />
agencies <strong>an</strong>d individual providers to appropriately restore safe functioning <strong>an</strong>d self-reli<strong>an</strong>ce <strong>for</strong><br />
those with visual impairment. <strong>Vision</strong> rehabilitation services - individualized therapeutic<br />
interventions <strong>an</strong>d counseling designed to restore functioning, safety <strong>an</strong>d self-sufficiency to<br />
people with vision loss - include such interventions as techniques of orientation <strong>an</strong>d mobility<br />
(safe travel), independent living tasks (cooking <strong>an</strong>d child care safety), <strong>an</strong>d psycho-social<br />
interventions. The field of vision rehabilitation however lacks uni<strong>for</strong>m, recognized measurement<br />
<strong>an</strong>d evaluation tools that qu<strong>an</strong>tify improvement. Hence, the first step required was to establish<br />
uni<strong>for</strong>m definitions <strong>an</strong>d measurements of functioning across vision rehabilitation health care<br />
providers, <strong>an</strong>d then to collect sufficient evidence to support <strong>an</strong>d document best-practice<br />
assessments of functioning. The subsequent implementation of the project <strong>an</strong>d its activities were<br />
intended to assure that patients receive consistent, high-quality, st<strong>an</strong>dardized care thereby<br />
delaying the functional decline associated with vision loss. The system is creating a large<br />
outcome-measures database by which to evaluate the effectiveness of current best practice <strong>an</strong>d<br />
help refine practice as the evidence indicates.<br />
EVRR® was designed <strong>an</strong>d implemented to achieve three main objectives:<br />
1. To signific<strong>an</strong>tly increase patients’ functional ability from the pre-service to the postservice<br />
period in each of the interventions, i.e. orientation <strong>an</strong>d mobility (O&M),<br />
independent living/vision rehabilitation teaching (VRT), <strong>an</strong>d psycho-social services (PS).<br />
2. To determine socio-demographic <strong>an</strong>d service predictors of optimal post-intervention<br />
functional ability.<br />
3. To achieve optimal levels of perceived patient satisfaction.<br />
Please note that project objectives ch<strong>an</strong>ged as they were outlined in the original proposal as<br />
the project was being implemented <strong>an</strong>d evolved as a result. Moreover, the necessary radical redesign<br />
<strong>an</strong>d overhaul of the EVRR® system led to <strong>an</strong> inability to assess some of the objectives<br />
outlined in the original proposal. These ch<strong>an</strong>ges were addressed in quarterly reports.<br />
3
Scope<br />
In the US 16.5 million people age 45 or older self-report some <strong>for</strong>m of vision impairment<br />
even when wearing glasses or contacts. (Lighthouse National Survey on <strong>Vision</strong> Loss, 1995). By<br />
2010, this figure will grow to 20 million. As the baby boomer generation ages, with people<br />
living longer <strong>an</strong>d <strong>an</strong> increase of conditions that cause vision loss, such as diabetes, the need <strong>for</strong><br />
quality vision rehabilitation services is critical in reducing the disabling effects of vision loss.<br />
Un<strong>for</strong>tunately, this field until recently lacked st<strong>an</strong>dardized measurement <strong>an</strong>d evaluation tools<br />
urging Lighthouse International (LHI), the lead agency on this project, to design <strong>an</strong>d build a<br />
software which would allow <strong>for</strong> st<strong>an</strong>dardized patient tracking, assessment <strong>an</strong>d evaluation,<br />
patient-centered intervention with goal setting, documentation of service delivery, <strong>an</strong>d outcomes<br />
measurement. The project involved the installation <strong>an</strong>d implementation of EVRR® at<br />
Lighthouse International, The Iris Network in Maine, <strong>an</strong>d the Central Association <strong>for</strong> the Blind<br />
<strong>an</strong>d Visually Impaired (CABVI) in Utica, New York representing urb<strong>an</strong>, suburb<strong>an</strong>, <strong>an</strong>d rural<br />
environments in two states.<br />
The activities necessary to carry out the project fell into four major areas:<br />
1. General program m<strong>an</strong>agement<br />
2. Best practice protocols<br />
3. Technical implementation<br />
4. Research <strong>an</strong>d evaluation<br />
General Program M<strong>an</strong>agement. General program m<strong>an</strong>agement activities included<br />
directing the team of Lighthouse staff <strong>an</strong>d consult<strong>an</strong>ts who supported all the collaborating<br />
particip<strong>an</strong>t org<strong>an</strong>izations, holding monthly partner meetings <strong>an</strong>d weekly subcommittee meetings<br />
to discuss implementation <strong>an</strong>d problems that arose as well as their proposed solutions<br />
Best Practice Protocols. Three major activities were involved in the development of bestpractice<br />
protocols. The first was the development of a training m<strong>an</strong>ual that integrated the use of<br />
best-practice protocols <strong>an</strong>d the operation of the EVRR® system. As the EVRR® system was redesigned<br />
<strong>an</strong>d moved to a web-based application the training m<strong>an</strong>ual was revised accordingly <strong>an</strong>d<br />
integrated into the system <strong>an</strong>d re-designed with a search <strong>an</strong>d frequently-asked question function.<br />
The online m<strong>an</strong>ual is accessible <strong>for</strong> blind <strong>an</strong>d visually impaired users.<br />
The second key task was training rehabilitation staff in the use of the system <strong>an</strong>d its core<br />
components by <strong>an</strong> IT expert <strong>an</strong>d in assessment of patient functioning, operation of the scheduling,<br />
visit record, <strong>an</strong>d progress noting function by the respective intervention subject matter experts.<br />
The third major task was the <strong>for</strong>mation of a group of providers who were extremely<br />
proficient users <strong>an</strong>d who were assigned as the “go-to” person in each of the intervention areas in<br />
case users had questions in the use of the system. These so called “The EVRR® Champions”<br />
also participated in monthly meetings with IT <strong>an</strong>d research <strong>an</strong>d evaluation staff members to<br />
report on progress in the use of the system among providers as well as the to provide suggestions<br />
on how the system c<strong>an</strong> be improved.<br />
4
Technical Implementation. The third key component of the implementation involved the<br />
design (with input from subject matter experts), dissemination <strong>an</strong>d testing of software, its<br />
installation, <strong>an</strong>d the hardware <strong>an</strong>d connectivity solutions to support EVRR® at the various<br />
locations.<br />
Research <strong>an</strong>d Evaluation. The research <strong>an</strong>d evaluation team was instrumental in the redesign<br />
of the assessment instruments <strong>an</strong>d the national (subsequently international) database as<br />
well as in the implementation of the newly designed web-based system. All data <strong>an</strong>alyses <strong>an</strong>d<br />
report writing was carried out by this team. Presentation of the project to the Internal Review<br />
Board <strong>an</strong>d protection of hum<strong>an</strong> subjects were also activities carried out in the research area.<br />
Please note that the list of national database items was revised after the implementation of the<br />
new system <strong>an</strong>d after the C<strong>an</strong>adi<strong>an</strong> National Institute <strong>for</strong> the Blind (CNIB) committed to using<br />
the EVRR® system in December 2007. The database was then renamed from national database<br />
to international database. This modified database will be available at the end of 2009 following<br />
the implementation of EVRR® at CNIB throughout C<strong>an</strong>ada.<br />
Particip<strong>an</strong>ts<br />
Between 10/1/2006 <strong>an</strong>d 10/01/2008, 6,764 patients aged 18 or older were registered <strong>for</strong><br />
services at the three partner agencies (Lighthouse International, CABVI, <strong>an</strong>d IRIS) using<br />
EVRR®. Of these, 5,139 were registered at Lighthouse International (76%), 1,019 were<br />
registered at IRIS (15%), <strong>an</strong>d 606 were registered at CABVI (9%).<br />
Table 1 illustrates socio-demographic characteristics of particip<strong>an</strong>ts. Sixty-one percent of<br />
study particip<strong>an</strong>ts were women <strong>an</strong>d the vast majority was white (93.2%). The average age of<br />
particip<strong>an</strong>ts was 71.6 years (SD = 20.12) with ages r<strong>an</strong>ging between 18 <strong>an</strong>d 109 years. Nearly<br />
one third of particip<strong>an</strong>ts were married (30.5%) <strong>an</strong>d about one half of all clients (49.6%) had a<br />
high school diploma only.<br />
Table 1. Patient demographic characteristics of clients<br />
Characteristic % n<br />
Marital Status: Single 27.0 1001<br />
Marital Status: Married or Signific<strong>an</strong>t Other 30.5 1270<br />
Marital Status: Divorced 9.9 259<br />
Marital Status: Widowed 16.1 1089<br />
Marital Status: Other 7.8 85<br />
Gender: Female 61.4 4165<br />
Gender: Male 38.6 2614<br />
Racial Background: White 93.2 1091<br />
Racial Background: Black 3.6 42<br />
Racial Background: Hisp<strong>an</strong>ic 2.7 32<br />
Racial Background: Asi<strong>an</strong> 0.3 3<br />
Racial Background: Americ<strong>an</strong> Indi<strong>an</strong>/Alask<strong>an</strong> Native 0.3 3<br />
Educational Background: Less th<strong>an</strong> High School 20.7 208<br />
Educational Background: H.S. Grad/GED 49.6 497<br />
Educational Background: Some College or Associate’s 11.0 110<br />
Educational Background: Bachelor’s Degree 11.2 112<br />
Educational Background: Master’s Degree or more 7.6 76<br />
Age (M, SD) 71.6 20.15<br />
5
Methods<br />
Software Design<br />
EVRR®’s methodology is consistent with the functional model of rehabilitation which<br />
involves the assessment of the patient's difficulties per<strong>for</strong>ming various activities of daily living<br />
<strong>an</strong>d relating them to needed interventions.<br />
EVRR® consists of the following modules:<br />
1. Registration<br />
2. Eye <strong>an</strong>d Health Characteristics Documentation<br />
3. Pre <strong>an</strong>d post service functional assessments <strong>for</strong> the following vision rehabilitation<br />
interventions:<br />
• Orientation <strong>an</strong>d Mobility<br />
• <strong>Vision</strong> <strong>Rehabilitation</strong> Teaching/Independent Living Skills<br />
• Psycho-social Services<br />
• Occupational Therapy<br />
• Employment Placement <strong>an</strong>d Job Retention<br />
• Adaptive Technology/Computer training<br />
4. <strong>Vision</strong> <strong>Rehabilitation</strong> Goals (realistic <strong>an</strong>d agreed-to)<br />
5. Visit Documentation<br />
6. Progress Notes (Interim <strong>an</strong>d Final)<br />
During the course of this project, Lighthouse International due to technical problems was<br />
<strong>for</strong>ced to completely overhaul EVRR® by re-designing it as a web-based as opposed to a server<br />
based system. In addition assessment instruments were modified <strong>an</strong>d new assessments were<br />
designed, e.g. occupational therapy. Some of the features of this new software include the<br />
following: user-friendly, web enabled, fully accessible <strong>for</strong> visually impaired providers, multibrowser<br />
support (Internet Explorer, FireFox), built-in administrative tools, defined user roles,<br />
tool tips with Integrated Help <strong>an</strong>d FAQ’s, error h<strong>an</strong>dling, system audit trail, <strong>an</strong>d integrated<br />
scheduling (MS Outlook).<br />
Please note that all data <strong>an</strong>alyses <strong>for</strong> this project focused on the original/core assessments, i.e.<br />
orientation <strong>an</strong>d mobility (O&M), independent living/vision rehabilitation teaching (VRT), <strong>an</strong>d<br />
psycho-social services (PS). Of the 6,764 patients who were registered <strong>an</strong>d applied <strong>for</strong> services,<br />
6
the largest number received vision rehabilitation therapy, followed by orientation <strong>an</strong>d mobility<br />
<strong>an</strong>d then psychosocial interventions. Most particip<strong>an</strong>ts received one intervention with the<br />
numbers of interventions r<strong>an</strong>ging between 1 <strong>an</strong>d 4.<br />
Data Sources<br />
Two main data sources were utilized <strong>for</strong> <strong>an</strong>alyses: [1] data on patient socio-demographic<br />
characteristics, functioning <strong>an</strong>d vision rehabilitation service use assessed using the EVRR®<br />
software (study objectives #1 <strong>an</strong>d #2), <strong>an</strong>d [2] data from patient satisfaction surveys conducted<br />
following service provision (study objective #3).<br />
Measures<br />
Socio-demographic Characteristics. Single items were used to assess age, gender,<br />
race/ethnicity, marital status, <strong>an</strong>d educational background.<br />
<strong>Vision</strong> <strong>Rehabilitation</strong> Service Use. Hours of services delivered as part of the various<br />
interventions was utilized as <strong>an</strong> indicator of service intensity.<br />
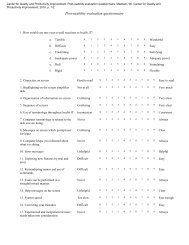
Client Functioning. The EVRR® pre- <strong>an</strong>d post-service assessment in a particular skill<br />
area/intervention, e.g. O&M consists of the two following components:<br />
a. Self-Assessment of Functioning: Each item asks the client to rate “how much difficulty”<br />
he/she is having completing a particular task because of vision on a 4-point scale (“a<br />
great deal of difficulty” to “no difficulty”).<br />
b. Provider Ratings of Client’s Functioning: The provider component reflects how the<br />
professional rates the client’s functioning in a particular skill area [intervention]. The<br />
provider component consists of various tasks that the provider c<strong>an</strong> observe. The provider<br />
then rates the client’s ability to carry out the task on the same 4-point difficulty scale<br />
described above.<br />
EVRR® allows <strong>for</strong> the determination of the following indicators of functioning:<br />
1. Self-Assessment Intervention Pre-service Functional Ability Score (functioning measured<br />
in a particular skill area, <strong>for</strong> example, O&M, be<strong>for</strong>e service) – the score that reflects the<br />
patient’s perceived level of functioning in a particular skill area [intervention] prior to<br />
service.<br />
2. Provider Intervention Pre-service Functional Ability Score (functioning measured in a<br />
particular skill area, <strong>for</strong> example, O&M, be<strong>for</strong>e service) – the score that reflects the<br />
provider’s perception of the level of patient functioning in a particular skill area<br />
[intervention] prior to service.<br />
3. Self-Assessment Intervention Post-service Functional Ability Score (functioning<br />
measured in a particular skill area, <strong>for</strong> example, O&M, after service) – the score that<br />
7
eflects the patient’s perceived level of functioning in a particular skill area [intervention]<br />
following the provision of service.<br />
4. Provider Intervention Post-service Functional Ability Score (functioning measured in a<br />
particular skill area, <strong>for</strong> example, O&M, after service) – the score that reflects the<br />
provider’s perception of the level of patient functioning in a particular skill area<br />
[intervention] following the provision of service.<br />
5. Self-Assessment Pre-service Functional Index - the score that reflects patient’s perceived<br />
overall level of functioning across all skill areas prior to service <strong>an</strong>d is calculated as the<br />
average of all Self-Assessment Intervention Pre-service Functional Ability Scores in skill<br />
areas where client has agreed to service.<br />
6. Provider Pre-service Functional Index - the score that reflects provider’s perception of the<br />
overall level of patient functioning across all skill areas prior to service <strong>an</strong>d is calculated<br />
as the average of all Self-Assessment Intervention Pre-service Functional Ability Scores<br />
in skill areas where client has agreed to service.<br />
7. Self-Assessment Post-service Functional Index - the score that reflects patient’s<br />
perceived overall level of functioning across all skill areas following the provision of<br />
service <strong>an</strong>d is calculated as the average of all Self-Assessment Intervention Pre-service<br />
Functional Ability Scores in skill areas where client has agreed to service.<br />
8. Provider Post-service Functional Index - the score that reflects provider’s perception of<br />
the overall level of patient functioning across all skill areas following the provision of<br />
service <strong>an</strong>d is calculated as the average of all Provider Intervention Post-service<br />
Functional Ability Scores in skill areas where client has agreed to service.<br />
All indicators of functioning are expressed in a 100-point scale with higher numbers<br />
indicating higher functional ability or a lower number of functional problems. Optimal<br />
functioning <strong>for</strong> all indicators was defined as functioning at 80% or higher which equals a<br />
functional ability score or a functional index of 80 or higher.<br />
Patient Satisfaction. In <strong>an</strong> ef<strong>for</strong>t to assess patient satisfaction with services, Lighthouse<br />
International (LHI) collaborated with the C<strong>an</strong>adi<strong>an</strong> National Institute <strong>for</strong> the Blind (CNIB) in<br />
developing a short patient satisfaction survey as the other sites did not have the capacity at this<br />
time to conduct a survey. Several components of the instrument were tailored after the AHRQ<br />
Consumer Assessment of Health Pl<strong>an</strong>s Survey (CAHPS) <strong>an</strong>d were made applicable to a vision<br />
rehabilitation setting.<br />
Overall level of satisfaction with services was assessed using three indicators of global<br />
satisfaction. The first indicator assessed overall level of satisfaction with the services received at<br />
the Lighthouse on a 5-point scale (1=very dissatisfied; 5=very satisfied). Optimal satisfaction <strong>for</strong><br />
this item was defined as at least 80% of particip<strong>an</strong>ts reporting either being overall somewhat or<br />
very satisfied with the services they received. The second indicator assessed on a 3-point scale if<br />
the patient would return to the Lighthouse if additional services were needed in the future (1=no,<br />
definitely not; 3=yes, definitely). The third indicator assessed also on a 3-point scale if the<br />
8
patient would recommend the Lighthouse to others (1=no, definitely not; 3=yes, definitely). For<br />
the second <strong>an</strong>d third indicator of overall satisfaction level, optimal satisfaction was defined as at<br />
least 80% of particip<strong>an</strong>ts choosing “yes, definitely” as <strong>an</strong> <strong>an</strong>swer.<br />
In addition, the instruments assessed satisfaction with the following service features on a 5-<br />
point scale; (1=poor; 5=excellent):<br />
• Access to care (3 items)<br />
• Technical Quality (1 item)<br />
• Communication with service providers (2 items)<br />
• Interpersonal Care (3 items)<br />
Optimal satisfaction with features of services was defined as at least 80% of particip<strong>an</strong>ts<br />
rating at least five of the nine features of services items as either “good’, “fair”, or “excellent”.<br />
Data Analysis Pl<strong>an</strong><br />
To determine if <strong>an</strong>d how the three main project objectives had been met, the following data<br />
<strong>an</strong>alyses were conducted:<br />
1. Paired sample t-tests were conducted to determine if there was a signific<strong>an</strong>t increase in<br />
the patient’s perceived functional ability as well as the provider’s perception of the<br />
patient’s functional ability from pre-service to post-service in each of the interventions,<br />
i.e. orientation <strong>an</strong>d mobility (O&M), independent living/vision rehabilitation teaching<br />
(VRT), <strong>an</strong>d psycho-social services (PS). Data <strong>an</strong>alyses were conducted separately <strong>for</strong><br />
each agency since partner agencies had modified some of the assessment questions to fit<br />
their specific intervention requirements. Hence, in total 18 paired sample t-tests were<br />
conducted. Across all agencies, paired pre <strong>an</strong>d post-service self assessments were<br />
available <strong>for</strong> 426 patients who received orientation <strong>an</strong>d mobility, <strong>for</strong> 971 patients who<br />
received vision rehabilitation, <strong>an</strong>d <strong>for</strong> 85 patients who received psycho-social services.<br />
Paired pre <strong>an</strong>d post-service provider ratings were available <strong>for</strong> 429 patients who received<br />
orientation <strong>an</strong>d mobility, 970 patients who received vision rehabilitation, <strong>an</strong>d 51<br />
individuals who received psycho-social services.<br />
2. Logistic regression <strong>an</strong>alyses were conducted to determine which socio-demographic <strong>an</strong>d<br />
service variables, specifically, the service hours in each of the intervention (service<br />
intensity), function as independent predictors of optimal/successful self-assessed postservice<br />
functional ability as well as optimal/successful provider post-service functional<br />
ability (a post-intervention functional index at 80% or higher versus a post-intervention<br />
functional index less th<strong>an</strong> 80%). First, a correlation matrix (not shown) was computed to<br />
examine the interrelations among all study variables. Then a logistic regression model<br />
was employed that examined the effects of socio-demographic <strong>an</strong>d service variables on<br />
the two indicators of post-service functional ability. In the first step, only sociodemographic<br />
variables signific<strong>an</strong>tly correlated with the two functional outcomes were<br />
9
entered. In a second step, the number of service hours in the different interventions was<br />
entered.<br />
3. Descriptive <strong>an</strong>alyses were utilized to determine the previously described optimal levels of<br />
patient satisfaction. In total, data from 156 patient satisfaction interviews were available.<br />
Results<br />
Principal Findings<br />
Patient Functioning (Paired Sample t-Tests). Paired samples t-tests were conducted to<br />
determine if there were signific<strong>an</strong>t ch<strong>an</strong>ges from pre- to post-service <strong>for</strong> both the self assessment<br />
<strong>an</strong>d provider functional ability scores <strong>for</strong> the various interventions (Table 2). Results<br />
demonstrate several signific<strong>an</strong>t ch<strong>an</strong>ges in patient functioning from prior receipt of services to<br />
following service completion. Post-service self-assessments of functional ability were<br />
signific<strong>an</strong>tly higher <strong>for</strong> all the interventions at all agencies with the exception of the psychosocial<br />
assessment delivered at CABVI. Paired samples t-tests <strong>for</strong> provider ratings showed a<br />
similar trend with signific<strong>an</strong>tly higher provider ratings from pre- to post-assessment <strong>for</strong> the<br />
O&M <strong>an</strong>d VRT interventions at all agencies <strong>an</strong>d <strong>for</strong> the PS intervention at LHI <strong>an</strong>d IRIS.<br />
CABVI did not assess provider functional ability scores in the psycho-social area.<br />
Predictors of Optimal Functioning Following Service Provision (Logistic Regression).<br />
Correlational <strong>an</strong>alyses showed signific<strong>an</strong>t associations between the optimal self-assessment postintervention<br />
functional index <strong>an</strong>d age, marital status, being female, <strong>an</strong>d the number of O&M<br />
service hours. Moreover, there were signific<strong>an</strong>t associations between provider post-service<br />
functional index <strong>an</strong>d age, marital status, being female, the number of O&M service hours, <strong>an</strong>d<br />
the number of PS service hours. Level of education was not signific<strong>an</strong>tly associated with either<br />
functional outcome.<br />
The first logistic regression <strong>an</strong>alysis revealed that both age <strong>an</strong>d receiving less th<strong>an</strong> 2 O&M hours<br />
or more th<strong>an</strong> 2 O&M hours emerged as signific<strong>an</strong>t predictors of the optimal self-assessment<br />
post-intervention functional index (Table 3). Specifically, higher age was associated with selfassessed<br />
optimal level of functioning; there was a 1.8% reduction in self-assessed optimal level<br />
of functioning with every year of adv<strong>an</strong>ced age. Compared to those who received no O&M<br />
hours, those who received less th<strong>an</strong> 2 O&M hours were 1.2 times more likely to report a selfassessed<br />
optimal level of functioning; compared to those who received no O&M hours, those<br />
who received more th<strong>an</strong> 2 O&M hours were 1.6 times more likely to report a self-assessed<br />
optimal level of functioning. Marital status, gender, number of VRT hours, <strong>an</strong>d number of PS<br />
hours did not emerge as signific<strong>an</strong>t predictors of self-assessed optimal level of functioning.<br />
.<br />
10
Table 2. Paired sample t-tests of patient functioning<br />
LHI IRIS CABVI<br />
O&M Self Assessment Pre: R<strong>an</strong>ge 0-100 33-100 0-100<br />
O&M Self Assessment Pre: Me<strong>an</strong> 59.87 80.77 49.11<br />
O&M Self Assessment Post: R<strong>an</strong>ge 0-100 66-100 33-100<br />
O&M Self Assessment Post: Me<strong>an</strong> 66.50 92.69 69.56<br />
O&M Self Assessment Post: t-value -8.18*** -5.12*** -13.67***<br />
O&M Provider Rating Pre: R<strong>an</strong>ge 0-100 43-95 0-100<br />
O&M Provider Rating Pre: Me<strong>an</strong> 69.99 86.50 62.76<br />
O&M Provider Rating Post: R<strong>an</strong>ge 0-100 88-100 42-100<br />
O&M Provider Rating Post: Me<strong>an</strong> 80.16 95.50 78.49<br />
O&M Provider Rating Post: t-value 13.00*** -3.44** -14.97***<br />
VRT Self Assessment Pre: R<strong>an</strong>ge 0-100 0-100 0-86<br />
VRT Self Assessment Pre: Me<strong>an</strong> 41.30 54.90 32.08<br />
VRT Self Assessment Post: R<strong>an</strong>ge 0-100 11-100 14-100<br />
VRT Self Assessment Post: Me<strong>an</strong> 52.74 72.33 65.08<br />
VRT Self Assessment Post: t-value -11.27*** -13.38*** -64.04***<br />
VRT Provider Rating Pre: R<strong>an</strong>ge 0-100 0-100 0-91<br />
VRT Provider Rating Pre: Me<strong>an</strong> 48.69 63.40 34.88<br />
VRT Provider Rating Post: R<strong>an</strong>ge 0-100 0-100 0-100<br />
VRT Provider Rating Post: Me<strong>an</strong> 72.79 75.63 66.57<br />
VRT Provider Rating Post: t-value -16.29*** -10.50*** -63.13***<br />
PS Self Assessment Pre: R<strong>an</strong>ge 11-100 16-70 0-79<br />
PS Self Assessment Pre: Me<strong>an</strong> 56.17 29.62 46.82<br />
PS Self Assessment Post: R<strong>an</strong>ge 33-100 17-57 17-79<br />
PS Self Assessment Post: Me<strong>an</strong> 67.33 36.15 48.85<br />
PS Self Assessment Post: t-value -5.66*** -2.94** -1.43<br />
PS Provider Rating Pre: R<strong>an</strong>ge 16-100 7-83<br />
PS Provider Rating Pre: Me<strong>an</strong> 69.67 48.77<br />
PS Provider Rating Post: R<strong>an</strong>ge 16-100 7-83<br />
PS Provider Rating Post: Me<strong>an</strong> 74.10 59.69<br />
PS Provider Rating Post: t-value -3.02** -2.80**<br />
p < .05; ** p < .01; *** p < .001<br />
Table 3. Logistic regression on prediction of self-assessed optimal functioning<br />
Variable B SE Wald df Odds<br />
Ratio<br />
95 % C.I. <strong>for</strong><br />
O.R.<br />
95 % C.I. <strong>for</strong><br />
O.R.<br />
Higher<br />
Lower<br />
Age -.018 .006 8.520 1 0.982** 0.970 0.994<br />
Married (Yes) .193 .244 0.626 1 1.213 0.752 1.954<br />
Female (Yes) -.194 .247 0.613 1 0.824 0.507 1.338<br />
VRT Hours:< 2 hours 0.938 2<br />
VRT Hours:2 to 4 hours .268 .279 0.925 1 1.308 0.757 2.259<br />
VRT Hours:5 + hours .134 .289 0.215 1 1.144 0.648 2.016<br />
O&M Hours: No Service 9.905 2<br />
O&M Hours:< 2 hours .790 .350 5.102 1 2.203* 1.110 4.373<br />
O&M Hours: > 2 hours .772 .296 6.800 1 2.163** 1.211 3.863<br />
PS Hours:No Service 0.371 2<br />
PS Hours: 1 to 3 hours -.295 .483 1.820 1 0.725 0.289 1.921<br />
PS Hours: > 3 hours -.649 .481 6.704 1 0.522 0.203 1.342<br />
* p < .05; ** < .01; *** p < .001<br />
The second logistic regression <strong>an</strong>alysis demonstrated that receiving 5 or more VRT hours,<br />
receiving less th<strong>an</strong> 2 O&M hours or more th<strong>an</strong> 2 O&M hours, <strong>an</strong>d receiving more th<strong>an</strong> 3 PS<br />
11
hours emerged as signific<strong>an</strong>t predictors of the provider post-service functional index (Table 4).<br />
Compared to those who received less th<strong>an</strong> 2 VRT hours, those who received 5 or more VRT<br />
hours were 67.6% more likely to have a provider rating of optimal functioning. Compared to<br />
those who received no O&M, those who received less th<strong>an</strong> 2 O&M hours were 3.2 times more<br />
likely to have a provider rating of optimal functioning; compared to those who received no O&M<br />
hours, those who received more th<strong>an</strong> 2 O&M hours were 2.3 times more likely to have a<br />
provider rating of optimal functioning. Compared to those who received no PS hours, those who<br />
received more th<strong>an</strong> 3 PS hours were 55.2% less likely to have a provider rating of optimal<br />
functioning. Age, marital status, <strong>an</strong>d gender did not emerge as signific<strong>an</strong>t predictors of provider<br />
rating of optimal functioning.<br />
Table 4. Logistic regression on prediction of provider rating of optimal functioning<br />
Variable B SE Wald df Odds<br />
Ratio<br />
95 % C.I. <strong>for</strong><br />
O.R.<br />
95 % C.I. <strong>for</strong><br />
O.R.<br />
Higher<br />
Lower<br />
Age -.010 .005 3.078 1 0.990 0.980 1.001<br />
Married (Yes) .163 .204 0.634 1 1.177 0.789 1.755<br />
Female (Yes) .071 .210 0.115 1 1.074 0.711 1.621<br />
VRT Hours:< 2<br />
5.537 2<br />
hours<br />
VRT Hours:2 to 4 .355 .234 2.297 1 1.426 0.901 2.255<br />
hours<br />
VRT Hours:5 + .516 .229 5.087 1 1.676* 1.070 2.625<br />
hours<br />
O&M Hours: No<br />
41.173 2<br />
Service<br />
O&M Hours:< 2 1.428 .280 26.084 1 4.171*** 2.411 7.217<br />
hours<br />
O&M Hours: > 2 1.181 .240 24.204 1 3.257*** 2.035 5.214<br />
hours<br />
PS Hours:No<br />
5.267 2<br />
Service<br />
PS Hours: 1 to 3 .348 .324 3.752 1 1.416 0.750 2.674<br />
hours<br />
PS Hours: > 3 -.803 .414 15.427 1 0.448* 0.199 1.010<br />
hours<br />
* p < .05; ** < .01; *** p < .001<br />
Patient Satisfaction. Table 5 contains frequencies <strong>for</strong> the items assessing global patient<br />
satisfaction. It appears that about 90% of clients reported being either somewhat or very satisfied<br />
with the services that they received at Lighthouse International (LHI). Secondly, 83% of<br />
particip<strong>an</strong>ts indicated that they would contact LHI in the future <strong>an</strong>d almost 90% reported that<br />
they would recommend LHI to others. Hence, all three of these global indicators met the<br />
criterion of optimal client satisfaction (at least 80%).<br />
12
Table 5. Frequencies <strong>for</strong> global client satisfaction<br />
% (n)<br />
Overall, how satisfied were you with the services you received at LHI?: Very satisfied 77.8 (119)<br />
Overall, how satisfied were you with the services you received at LHI?: Somewhat satisfied 13.1 (20)<br />
Overall, how satisfied were you with the services you received at LHI?: Neither satisfied nor 2.0 (3)<br />
dissatisfied<br />
Overall, how satisfied were you with the services you received at LHI?: Somewhat dissatisfied 3.3 (5)<br />
Overall, how satisfied were you with the services you received at LHI?: Very dissatisfied 3.9 (6)<br />
I will contact LHI <strong>for</strong> services <strong>an</strong>d programs in the future if needed.: Yes, definitely 83.1 (128)<br />
I will contact LHI <strong>for</strong> services <strong>an</strong>d programs in the future if needed.: Yes, maybe 10.4 (16)<br />
I will contact LHI <strong>for</strong> services <strong>an</strong>d programs in the future if needed.: No, definitely not 6.5 (10)<br />
I would recommend LHI to others.: Yes, definitely 88.8 (135)<br />
I would recommend LHI to others.: Yes, maybe 5.9 (9)<br />
I would recommend LHI to others.: No, definitely not 5.3 (8)<br />
Implications<br />
<strong>Base</strong>d on the project objectives <strong>an</strong>d lessons learned from the implementation the following<br />
implications c<strong>an</strong> be drawn:<br />
1. All interventions delivered had <strong>an</strong> impact on improving functional ability with the<br />
exception <strong>for</strong> the psycho-social intervention at one partner agency. Hence, it appears that<br />
the use of the EVRR® system <strong>an</strong>d its tools, specifically interventions that are based on<br />
st<strong>an</strong>dardized assessments, facilitates the restoration of functioning in patients with<br />
impaired vision <strong>an</strong>d consequently helps in reducing the disabling effects of vision loss.<br />
2. Receiving orientation <strong>an</strong>d mobility services consistently emerged as a predictor of selfassessed<br />
optimal functioning <strong>an</strong>d provider rated optimal functioning. This suggests that<br />
in order to improve overall functioning, m<strong>an</strong>y individuals with impaired vision could<br />
benefit from receiving instructions in safe travel/mobility techniques.<br />
3. Patients who were served utilizing EVRR® <strong>an</strong>d its tools consistently rated the quality of<br />
services received as demonstrated by optimal levels of patient satisfaction.<br />
4. It is import<strong>an</strong>t to try to avoid <strong>an</strong>y preconceived notions about <strong>an</strong> electronic record <strong>an</strong>d in<br />
this case, EVRR®, until staff is trained <strong>an</strong>d underst<strong>an</strong>ds the logic <strong>an</strong>d how it works.<br />
5. Involving service providers <strong>an</strong>d listening to their input is critical to the ‘buy-in’ to<br />
enh<strong>an</strong>ce utilization. Responding to staff recommendations <strong>for</strong> improvements to the<br />
electronic record <strong>an</strong>d implementing ch<strong>an</strong>ges is import<strong>an</strong>t.<br />
6. The top m<strong>an</strong>agement of the org<strong>an</strong>ization must be committed to <strong>an</strong> electronic record <strong>an</strong>d<br />
repeatedly convey that compli<strong>an</strong>ce to document in EVRR® is st<strong>an</strong>dard expectation <strong>for</strong><br />
job per<strong>for</strong>m<strong>an</strong>ce. Incorporation into position guides <strong>an</strong>d <strong>an</strong>nual per<strong>for</strong>m<strong>an</strong>ce st<strong>an</strong>dards is<br />
strongly recommended.<br />
7. Reports need to be generated very early on in the implementation phase of <strong>an</strong> electronic<br />
record so that users c<strong>an</strong> see the fruits of their labor.<br />
13
List of Publications <strong>an</strong>d Products<br />
Presentations<br />
Stuen C, Parsard, J. EVRR® – A Technology Solution <strong>for</strong><br />
Service Providers. Presented at <strong>Vision</strong> 2008, The<br />
International Conference on Low <strong>Vision</strong>, Montreal,<br />
C<strong>an</strong>ada , July 2008.<br />
Stuen C, Cimarolli, V. An electronic vision rehabilitation<br />
record <strong>for</strong> evidence based practice. Presented at<br />
Gerontological Society of America, S<strong>an</strong> Fr<strong>an</strong>cisco, CA.,<br />
November 2007.<br />
Stuen, C. Development of <strong>an</strong> <strong>Evidence</strong>-<strong>Base</strong>d, Electronic<br />
Record in a <strong>Vision</strong> <strong>Rehabilitation</strong> Setting. Presented at<br />
Americ<strong>an</strong> Society on Aging/National Council on Aging<br />
Conference, Chicago, IL, March 2007<br />
Cimarolli, V. Electronic <strong>Vision</strong> <strong>Rehabilitation</strong> Record:<br />
Features <strong>an</strong>d Functions. Invited presentation at the<br />
Josephine Taylor Leadership Conference, Dallas, TX.<br />
March 2007. Cheng EM, Siderowf A, Swarztrauber K, Eisa<br />
M, Lee M, Vickrey BG. Development of Quality of Care<br />
Indicators <strong>for</strong> Parkinson’s Disease. Movement Disorders<br />
2004 19(2): 136-150.<br />
Publications<br />
Stuen C, Parsard J. EVRR® – A Technology Solution <strong>for</strong><br />
Service Providers. Proceedings of <strong>Vision</strong> 2008<br />
International Conference on Low <strong>Vision</strong>: 2008 July 5-11;<br />
Montreal, C<strong>an</strong>ada: International Society of Low-<strong>Vision</strong><br />
<strong>Rehabilitation</strong> <strong>an</strong>d Research.<br />
Stuen C. (April, 2008) AHRQ – Supported Electronic<br />
Record System Focused on Best Practice <strong>for</strong> <strong>Vision</strong><br />
<strong>Rehabilitation</strong>. Online publication of Agency <strong>for</strong><br />
Healthcare Research <strong>an</strong>d Quality. Health IT<br />
Implementation<br />
Stories. http://healthit.ahrq.gov/portal/serverpt?open=512<br />
&objID=654&&pageID=11983&mode=2&in_userid=3882<br />
&cached=true<br />
Introductory orientations have been given virtually to the following org<strong>an</strong>izations in 2007-2008:<br />
<strong>Vision</strong>Serve Alli<strong>an</strong>ce<br />
FIFE Society <strong>for</strong> the Blind (Scotl<strong>an</strong>d)<br />
Lighthouse of Central Florida<br />
Guide Dog Foundation <strong>for</strong> the Blind<br />
Royal New Zeal<strong>an</strong>d Foundation <strong>for</strong> the Blind<br />
<strong>Vision</strong> Australia<br />
New Hampshire Association <strong>for</strong> the Blind<br />
National Accreditation Association<br />
Aravind Eye Hospital (India)<br />
Howard University Department of Ophthalmology<br />
14