Pseudoheterodyne Detection in Nearfield Optics - Zurich Instruments
Pseudoheterodyne Detection in Nearfield Optics - Zurich Instruments
Pseudoheterodyne Detection in Nearfield Optics - Zurich Instruments

You also want an ePaper? Increase the reach of your titles
YUMPU automatically turns print PDFs into web optimized ePapers that Google loves.
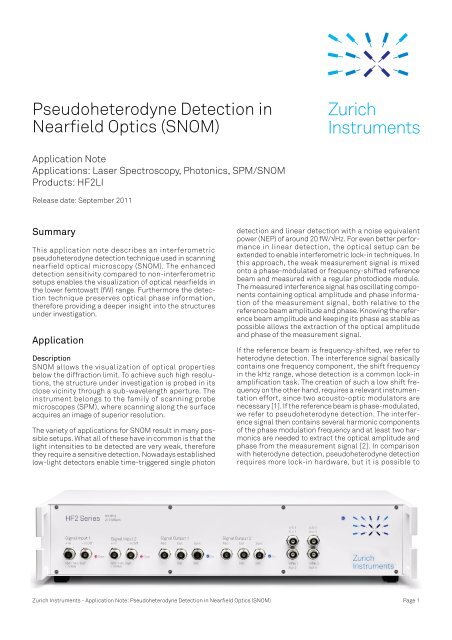
<strong>Pseudoheterodyne</strong> <strong>Detection</strong> <strong>in</strong><br />
<strong>Nearfield</strong> <strong>Optics</strong> (SNOM)<br />
Application Note<br />
Applications: Laser Spectroscopy, Photonics, SPM/SNOM<br />
Products: HF2LI<br />
Release date: September 2011<br />
Summary<br />
This application note describes an <strong>in</strong>terferometric<br />
pseudoheterodyne detection technique used <strong>in</strong> scann<strong>in</strong>g<br />
nearfield optical microscopy (SNOM). The enhanced<br />
detection sensitivity compared to non-<strong>in</strong>terferometric<br />
setups enables the visualization of optical nearfields <strong>in</strong><br />
the lower femtowatt (fW) range. Furthermore the detection<br />
technique preserves optical phase <strong>in</strong>formation,<br />
therefore provid<strong>in</strong>g a deeper <strong>in</strong>sight <strong>in</strong>to the structures<br />
under <strong>in</strong>vestigation.<br />
Application<br />
Description<br />
SNOM allows the visualization of optical properties<br />
below the diffraction limit. To achieve such high resolutions,<br />
the structure under <strong>in</strong>vestigation is probed <strong>in</strong> its<br />
close vic<strong>in</strong>ity through a sub-wavelength aperture. The<br />
<strong>in</strong>strument belongs to the family of scann<strong>in</strong>g probe<br />
microscopes (SPM), where scann<strong>in</strong>g along the surface<br />
acquires an image of superior resolution.<br />
The variety of applications for SNOM result <strong>in</strong> many possible<br />
setups. What all of these have <strong>in</strong> common is that the<br />
light <strong>in</strong>tensities to be detected are very weak, therefore<br />
they require a sensitive detection. Nowadays established<br />
low-light detectors enable time-triggered s<strong>in</strong>gle photon<br />
<strong>Zurich</strong><br />
<strong>Instruments</strong><br />
detection and l<strong>in</strong>ear detection with a noise equivalent<br />
power (NEP) of around 20 fW/√Hz. For even better performance<br />
<strong>in</strong> l<strong>in</strong>ear detection, the optical setup can be<br />
extended to enable <strong>in</strong>terferometric lock-<strong>in</strong> techniques. In<br />
this approach, the weak measurement signal is mixed<br />
onto a phase-modulated or frequency-shifted reference<br />
beam and measured with a regular photodiode module.<br />
The measured <strong>in</strong>terference signal has oscillat<strong>in</strong>g components<br />
conta<strong>in</strong><strong>in</strong>g optical amplitude and phase <strong>in</strong>formation<br />
of the measurement signal, both relative to the<br />
reference beam amplitude and phase. Know<strong>in</strong>g the reference<br />
beam amplitude and keep<strong>in</strong>g its phase as stable as<br />
possible allows the extraction of the optical amplitude<br />
and phase of the measurement signal.<br />
If the reference beam is frequency-shifted, we refer to<br />
heterodyne detection. The <strong>in</strong>terference signal basically<br />
conta<strong>in</strong>s one frequency component, the shift frequency<br />
<strong>in</strong> the kHz range, whose detection is a common lock-<strong>in</strong><br />
amplification task. The creation of such a low shift frequency<br />
on the other hand, requires a relevant <strong>in</strong>strumentation<br />
effort, s<strong>in</strong>ce two acousto-optic modulators are<br />
necessary [1]. If the reference beam is phase-modulated,<br />
we refer to pseudoheterodyne detection. The <strong>in</strong>terference<br />
signal then conta<strong>in</strong>s several harmonic components<br />
of the phase modulation frequency and at least two harmonics<br />
are needed to extract the optical amplitude and<br />
phase from the measurement signal [2]. In comparison<br />
with heterodyne detection, pseudoheterodyne detection<br />
requires more lock-<strong>in</strong> hardware, but it is possible to<br />
<strong>Zurich</strong> <strong>Instruments</strong> - Application Note: <strong>Pseudoheterodyne</strong> <strong>Detection</strong> <strong>in</strong> <strong>Nearfield</strong> <strong>Optics</strong> (SNOM) Page 1
select the modulator from a larger subset (electro-optical<br />
EOM, or piezo-electrical phase modulators PEPM).<br />
Setup Description<br />
The measurement setup is shown <strong>in</strong> Figure 1. The SNOM<br />
itself is depicted <strong>in</strong>side the grey box and controlled by an<br />
external control system (SPM controller). The setup is<br />
used to visualize light propagation <strong>in</strong>side planar<br />
waveguide structures. The fiber po<strong>in</strong>t<strong>in</strong>g towards the<br />
sample from the side couples light <strong>in</strong>to the waveguide<br />
and the fiber tip above the sample surface collects the<br />
evanescent nearfields of the waveguide structure buried<br />
underneath.<br />
The SNOM is <strong>in</strong>corporated <strong>in</strong>to a fiber-based<br />
Mach-Zehnder <strong>in</strong>terferometer with a piezoelectric fiber<br />
stretcher for phase modulation (PM) <strong>in</strong> the reference<br />
branch. The HF2LI’s output of up to 10V is able to drive the<br />
fiber stretcher without additional <strong>in</strong>strumentation, with<br />
frequencies around 10 kHz. To detect the <strong>in</strong>tensity of the<br />
<strong>in</strong>terference signal, a general purpose photodiode module<br />
with <strong>in</strong>tegrated preamplifier is used. The harmonics<br />
of the <strong>in</strong>terference signal are then readily available <strong>in</strong> the<br />
HF2LI lock-<strong>in</strong> unit. It is important to account for electrical<br />
delays by adjust<strong>in</strong>g the electrical phases of the <strong>in</strong>ternal<br />
demodulation carriers so that they are <strong>in</strong>-phase with the<br />
harmonics. Due to the scann<strong>in</strong>g speed of the SNOM, a<br />
small demodulation bandwidth below 100 Hz is chosen<br />
for a better signal-to-noise ratio. The large DC contribution<br />
<strong>in</strong> the measurement signal is suppressed by AC coupl<strong>in</strong>g<br />
for a higher dynamic range on the <strong>in</strong>put. The<br />
demodulated signals are sent <strong>in</strong> real-time to the SPM<br />
controller with the auxiliary outputs of the HF2LI (Aux<br />
Out).<br />
�������������������<br />
��������������<br />
�����<br />
���������<br />
Figure 1. Diagram of the pseudoheterodyne setup without <strong>in</strong>terferometer<br />
polarization controllers. The SNOM is controlled by an external SPM<br />
controller. The HF2LI provides the phase modulation with 3-4 V drive and<br />
detects the harmonics of the <strong>in</strong>terference signal.<br />
���<br />
���<br />
������������������� ��������<br />
<strong>Detection</strong> Pr<strong>in</strong>ciple<br />
The detected signal is composed of the sum of the <strong>in</strong>terference<br />
signals at DC and by several sidebands created<br />
by the PM.<br />
Figure 2 shows an example spectrum of the result<strong>in</strong>g<br />
<strong>in</strong>terference signal. The DC component is not of <strong>in</strong>terest.<br />
The harmonics are all proportional to the optical field<br />
amplitudes <strong>in</strong> the signal (sig) and reference (ref) optical<br />
<strong>in</strong>terference branches, to the Bessel coefficients of the<br />
modulation amplitude a m , and to the relative optical<br />
phase ϕ between sig and ref.<br />
�����<br />
�����������������<br />
���������<br />
���������<br />
�����������<br />
�����������<br />
�����������<br />
�����������������<br />
������������<br />
<strong>Zurich</strong> <strong>Instruments</strong> - Application Note: <strong>Pseudoheterodyne</strong> <strong>Detection</strong> <strong>in</strong> <strong>Nearfield</strong> <strong>Optics</strong> (SNOM) Page 2<br />
�������������������<br />
��<br />
�����������������<br />
�������������<br />
Figure 2. Spectrum of the <strong>in</strong>terference signal<br />
�����������������<br />
�������������<br />
����������������<br />
�������������<br />
� �� ��<br />
If the modulation amplitude is calibrated to a m = 2.63<br />
rad, such as J 1 (a m ) = J 2 (a m ), the optical phase ϕ is the<br />
argument of the first and second harmonic. For the<br />
amplitude of sig, the square sum of the two harmonics,<br />
the measured <strong>in</strong>tensity of ref and the Bessel coefficient<br />
���<br />
�����������������<br />
�
is needed. By do<strong>in</strong>g this, it is important to dist<strong>in</strong>guish<br />
between field amplitude and field <strong>in</strong>tensity, which is the<br />
square of the field amplitude. All calculations can be performed<br />
<strong>in</strong> a post-process<strong>in</strong>g step follow<strong>in</strong>g data acquisition.<br />
Achievements<br />
In a collaboration with R. Brönnimann at the EMPA<br />
Dübendorf, Switzerland, the setup described is used to<br />
measure optical nearfields <strong>in</strong> the fW range. The NEP is<br />
estimated to 170 aW/√Hz, which is 2 orders of magnitude<br />
better than for l<strong>in</strong>ear low-light detectors. Figure 3 shows<br />
a measured <strong>in</strong>tensity and phase pattern from a photonic<br />
crystal waveguide at telecom wavelengths (sample courtesy<br />
R. Houdré, EPF Lausanne). The acquisition time for<br />
the image was 30 m<strong>in</strong>utes. The <strong>in</strong>tensity pattern illustrates<br />
the conf<strong>in</strong>ement of the propagat<strong>in</strong>g mode. The<br />
phase pattern is also def<strong>in</strong>ed <strong>in</strong> regions of weak <strong>in</strong>tensity<br />
at the borders of the waveguide prov<strong>in</strong>g the high detection<br />
sensitivity. Unwanted environmental <strong>in</strong>fluences to<br />
the phase pattern can be m<strong>in</strong>imized by keep<strong>in</strong>g the optical<br />
path as short and isolated as possible.<br />
Optical Intensity [arbitrary units]<br />
Optical Phase [rad]<br />
Figure 3. Intensity/phase image of a photonic crystal waveguide with 30<br />
m<strong>in</strong>utes acquisition time (sample courtesy R. Houdré, EPFL, image<br />
courtesy R. Brönnimann, EMPA)<br />
Conclusions and User Benefits<br />
Amongst other phase sensitive detection techniques,<br />
pseudoheterodyne detection offers a variety of options to<br />
design the optical system towards the user’s needs. For<br />
the demodulation of the result<strong>in</strong>g sidebands, the HF2LI<br />
provides an easy-to-use solution due to its capability of<br />
measur<strong>in</strong>g up to 3 or 6 sidebands simultaneously. To further<br />
enhance the SNR, higher harmonics (up to 6) or the<br />
other <strong>in</strong>terferometer branch could be <strong>in</strong>cluded <strong>in</strong> the<br />
measurement result.<br />
With an operation range of up to 50 MHz, the HF2LI comb<strong>in</strong>ed<br />
with an EOM can modulate the phase at frequencies<br />
where the laser noise is lower than <strong>in</strong> the kHz region.<br />
With respect to heterodyne detection, the broad range<br />
allows the implementation of a heterodyne setup with<br />
only one AOM.<br />
As with any other SPM, it is possible to add the HF2LI-PLL<br />
option to control the oscillation of the probe with a bandwidth<br />
of up to 50 kHz and provide a topography feedback<br />
signal for the SPM controller.<br />
For advanced detection schemes <strong>in</strong> pseudoheterodyne<br />
scatter<strong>in</strong>g SNOM (sSNOM) [3], the HF2LI-MOD upgrade<br />
allows for detection of up to 4 sidebands around one<br />
higher harmonic of the probe oscillation frequency. If your<br />
SPM operation mode additionally requires oscillation<br />
control, it is possible to detect and track any of the 4 sidebands<br />
with a comb<strong>in</strong>ation of the HF2LI-PLL and<br />
HF2LI-MOD options.<br />
<strong>Zurich</strong> <strong>Instruments</strong> - Application Note: <strong>Pseudoheterodyne</strong> <strong>Detection</strong> <strong>in</strong> <strong>Nearfield</strong> <strong>Optics</strong> (SNOM) Page 3<br />
5 μm<br />
5 μm
References and Further Read<strong>in</strong>g<br />
[1] Nesci, Dändliker, Herzig, Quantitative amplitude and<br />
phase measurement by use of a heterodyne scann<strong>in</strong>g<br />
near-field optical microscope, <strong>Optics</strong> Letter, Vol 26, 2001<br />
[2] Vaez-lravani, Toledo-Crow, Phase contrast and amplitude<br />
pseudoheterodyne <strong>in</strong>terference near field scann<strong>in</strong>g<br />
optical microscopy, Appl. Phys. Lett. 62, 1993<br />
[3] Ocelic, Huber, Hillenbrand, <strong>Pseudoheterodyne</strong> detection<br />
for background-free near-field spectroscopy, Appl.<br />
Phys. Lett. 89, 2006<br />
<strong>Zurich</strong><br />
<strong>Instruments</strong><br />
Technoparkstrasse 1<br />
CH-8005 <strong>Zurich</strong><br />
Switzerland<br />
Phone +41-44-5150410<br />
Fax +41-44-5150419<br />
Email <strong>in</strong>fo@zh<strong>in</strong>st.com<br />
Web www.zh<strong>in</strong>st.com<br />
About <strong>Zurich</strong> <strong>Instruments</strong><br />
Technology-leader <strong>Zurich</strong> <strong>Instruments</strong> (ZI) designs and manufactures high performance dynamic signal<br />
analysis <strong>in</strong>struments for advanced scientific research and lead<strong>in</strong>g <strong>in</strong>dustrial applications. ZI products <strong>in</strong>clude<br />
lock-<strong>in</strong> amplifiers, phase-locked loops, <strong>in</strong>struments for electrical impedance spectroscopy, and application<br />
specific pre-amplifiers. Headquartered <strong>in</strong> <strong>Zurich</strong>, Switzerland, ZI was established <strong>in</strong> 2008. ZI customers are<br />
scientists and eng<strong>in</strong>eers <strong>in</strong> lead<strong>in</strong>g research labs and organizations worldwide.<br />
Disclaimer<br />
The contents of this document are provided by <strong>Zurich</strong> <strong>Instruments</strong>, 'as is'. ZI makes no representations nor<br />
warranties with respect to the accuracy or completeness of the contents of this publication and reserves the<br />
right to make changes to the specification at any time without notice. All trademarks are the property of their<br />
respective owners.